All Stock Market Guides
Learn trading in simple and easy-to-understand chapters. Each chapter is designed to progress you toward becoming a well-informed trading enthusiast.
Articles
Technical Analysis Guide
Start your stock market journey by understanding the most foundational concept in trading – technical analysis.
Chapter 1: Introduction to Technical Analysis
If you’re here, you must have made peace with the fact that you cannot pick stocks randomly and expect to get rich one day. The stock markets don’t work that way.
You must follow a method or structure backed by reason to build wealth in the stock markets. There are many logical methods, one of the most popular ones being technical analysis.
Understanding Technical Analysis
It must be pretty clear by now that you must buy and sell the right ones at the right time to profit from stocks. But how do you know when to buy or sell a stock? And what things should you look at before choosing a stock? This is where technical analysis comes into play.
Technical analysis helps predict the directionality of financial assets such as stocks. But what is technical analysis all about? And what exactly does this mean for you as someone who wants to trade and make money through stocks?
Let us understand with a simple example.
Imagine you are a farmer. You have bought new land in another town for agricultural purposes, and you must decide which crop to plant to maximize your land’s productivity.
Option 1: Research by yourself
Imagine you try to conduct some research of your own. You might want to answer questions like:
- Based on the water conditions, which crop will suit this soil?
- What is the most appropriate crop for this climate?
- Which crop has the highest demand and will fetch a good price in the market?
After reviewing a vast checklist, you will try what seems ideal and hope for the best.
The advantage of this technique is that you will know more about the crop you are planting. However, this method will only give you an idea of what may happen, and you have to check for different crops in your limited time. Hence, there is a large uncertainty about the crop’s performance because it is based on a lot of guesswork and restricted information.
There are some advantages to this technique, too. You will have a deeper understanding of the crop you are planting. However, this method can be time-consuming, and there will be a long gestation period to determine if the chosen crop will yield the best results. The decision also risks being based on a limited set of data and personal assumptions, which may not provide the most reliable outcome.
Option 2: Learn from other who've done it
Another option to decide your crop too.
You can ask your neighbour farmers which crop they have been harvesting in the past. You will know that a particular crop has a high benefit in that area, and by following them, you can plant a crop that has worked for farmers in that area. There is a high chance that you would benefit by planting that specific crop because you’re relying on proven information from the market participants in that area.
The paramount comfort of this technique is its scalability. You need to know which crop is the best fit and has the most demand in that area. However, beware that your neighboring farmers might only sometimes be correct.
From Fields to Finance: Picking Winners
Option 1 is similar to fundamental analysis in financial markets, where you independently research the stock you buy.
Fundamental Analysis
Fundamental analysis is a way to determine a company’s actual value by examining its finances, business model, management, and the overall economy.
Option 2 is similar to technical analysis, where the idea is to select and trade stocks based on their historical data and market participants’ behavior.
Technical analysis studies market action, just like our farming analogy. You have farming tools and equipment to help you sow seeds and fertilize land. As a result, you get proper management to get the maximum yield of crops. Similarly, tools like historical price data and indicators help us estimate the market’s direction in technical analysis. Both technical and fundamental analysis solve the same problem: determining the direction in which prices will likely move. They just approach the situation differently.
Technical analysts focus on the effect, believing that the outcome is all they need to know, and do not unnecessarily consider the reasons or causes of that effect. On the other hand, fundamental analysts always seek to understand why something is happening and try to predict the factor instead of its impact.
Technical Analyst
A technical analyst studies past market data, primarily price and volume, to predict future price movements. They use charts and indicators to identify patterns and trends in the market.
Fundamental Analyst
A fundamental analyst examines a company’s financial health, such as its profits and growth, to determine whether its stock is a good investment. They study company earnings, revenue, and the overall economy to understand the stock’s value.
Like any other research technique, technical analysis has its own set of assumptions. As you trade based on technical analysis, you should know these to unleash the full potential of technical analysis.
Generally, people argue that one approach is more suitable for decoding the market. Each method has merits and demerits, and wise traders will educate themselves to look for investing and trading opportunities in the market.
Assumptions of Technical Analysis
Now that you understand the concept of technical analysis, it is crucial to know its assumptions. This approach is based on three premises:
- Markets discount everything: This assumption means that all factors—fundamental, psychological, and political—are already reflected in the market price. For example, if someone with inside information buys a lot of a company’s stock because they expect good earnings, the stock price might rise even before the announcement. This price movement hints to technical analysts that something significant will happen. Here, we are assuming that no such publicly available information is yet to be reflected in the market price.
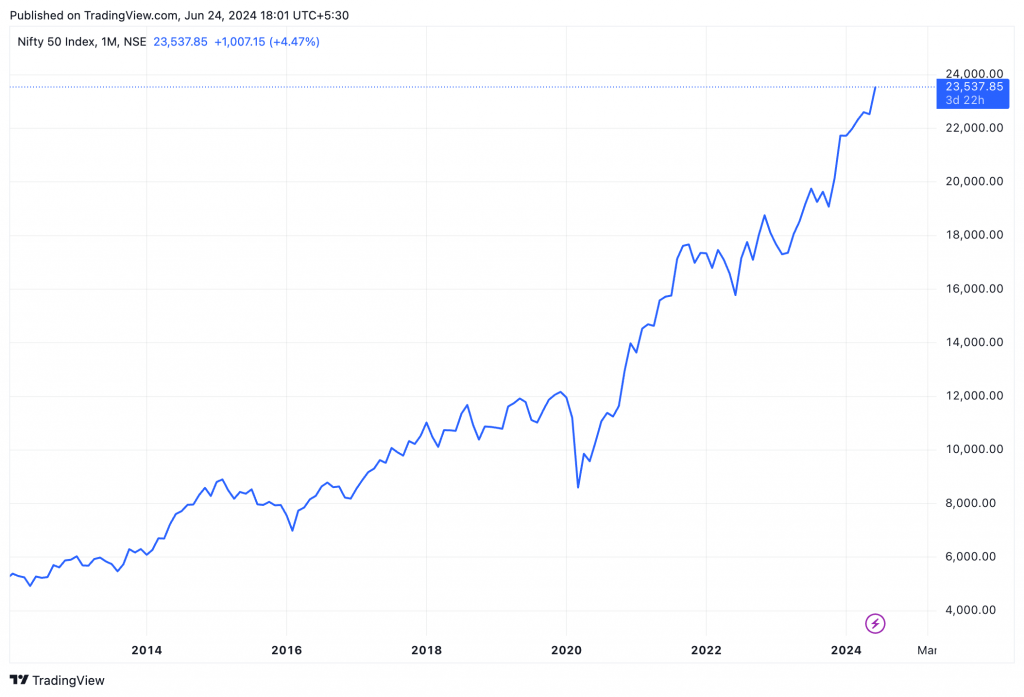
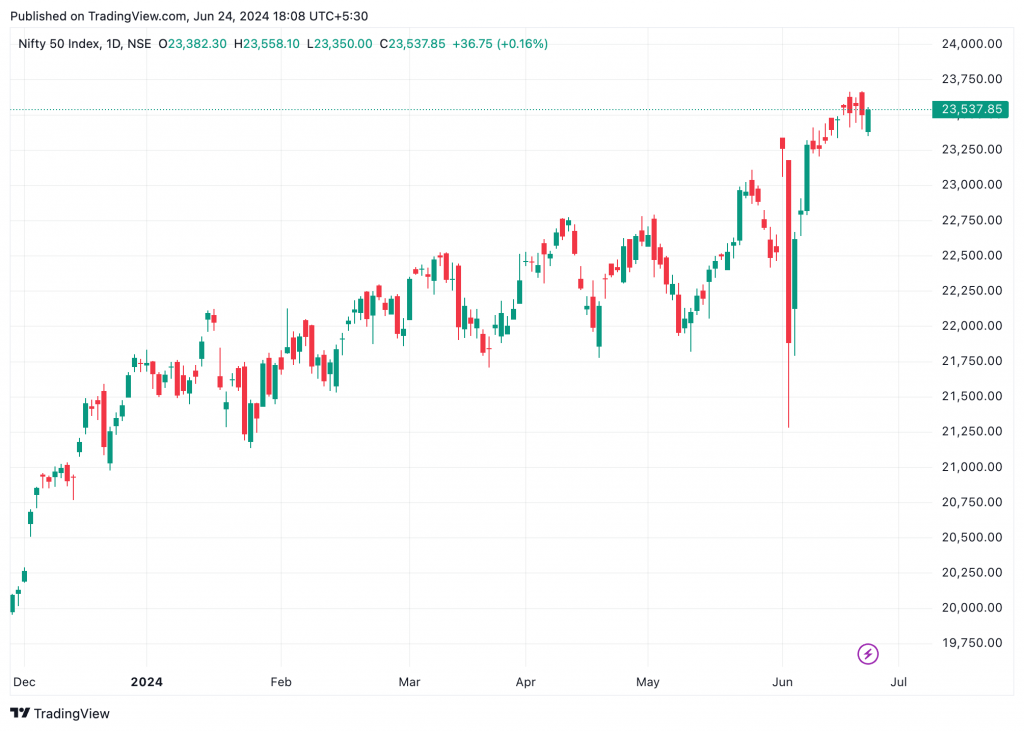
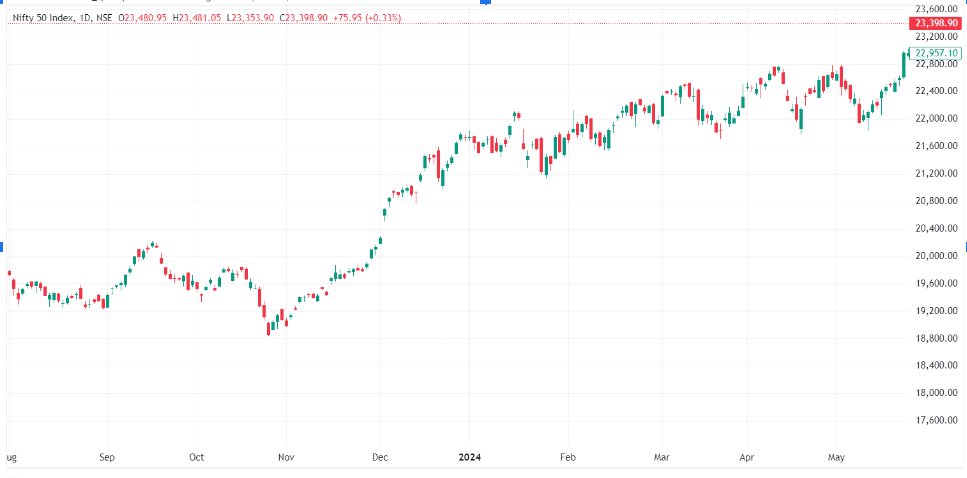
- Price moves in a trend: Market prices always follow a trend. All significant market moves are the outcome of a trend. Most techniques used in technical analysis are trend-following, meaning they intend to identify and follow existing trends. For example, the recent rise in the NIFTY 50 index is a good illustration. The index has been reaching new highs and has surged significantly this year. Once a trend is established, prices tend to move in that direction.
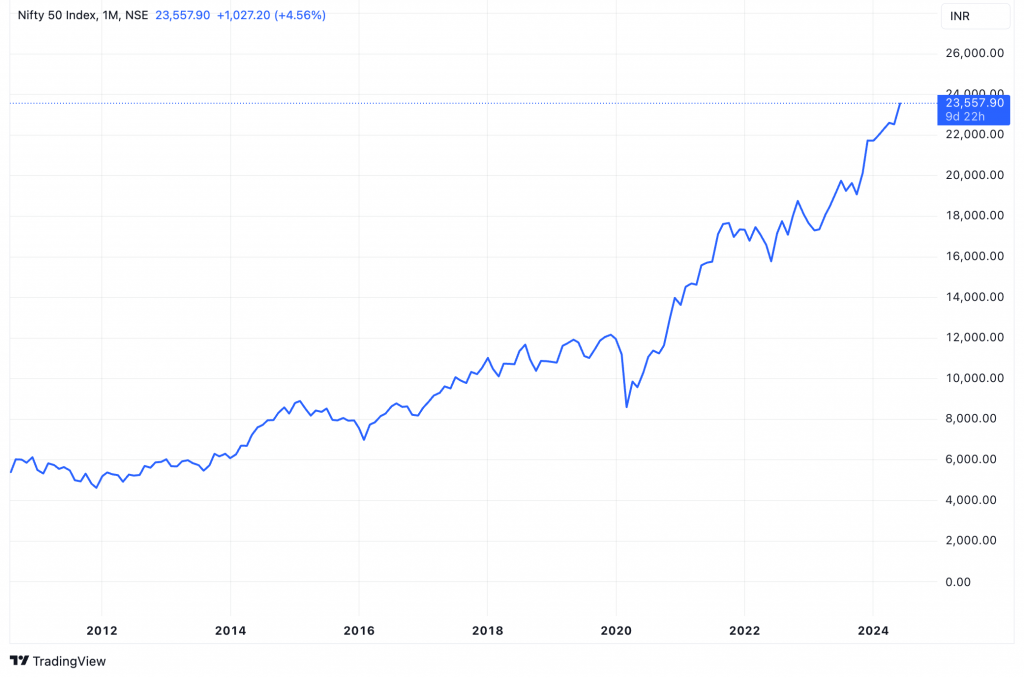
All Time High
An all-time high in the context of stocks is the highest price a stock has ever reached in its trading history.
Technical Analysis Fits Everywhere
One of the beauties of technical analysis is that it can be applied to any asset class with historical time series data. Time series data in technical analysis includes price information such as open price, high price, low price, close price, and volume.
Types of Prices
- Open Price: The first price at which a stock is traded when the market opens for the day.
-
High Price: The highest price at which a stock has been traded during a specific period, like a day.
-
Low Price: The lowest price at which a stock has been traded during a specific period, like a day.
-
Close Price: The last price at which a stock is traded when the market closes for the day.
-
Volume: The total number of shares of a stock that are bought and sold during a specific period, like a day.
Trading is just like learning to play guitar. Once you master the basic chords and techniques, you can play any song, regardless of the genre. Similarly, once you learn technical analysis, you can apply the concept to trade across Indian markets, such as equity, crypto, forex, and fixed income.
Fundamental Analysis vs. Technical Analysis
Technical analysis provides flexibility across asset classes, which is impossible with any other research technique. However, fundamental analysis requires studying many aspects of an asset class. And these fundamentals change with each asset class. For example, while you will have to research company financials and management commentary when analyzing companies, you will have to check factors such as rainfall, harvest, demand, supply, inventory, etc., while studying commodities. On the other hand, technical analysis will remain the same. It is independent of the asset you are studying. We can apply the same technical indicator to various asset classes because it’s primarily about historical data.
Annual Report
An annual report is a detailed document that a company publishes yearly to show its financial performance and activities. It includes information about how much money the company made and spent, what it owns and owes, and its plans for the future. It helps investors understand the company’s performance, history, and future plans.
Can Technical Analysis be Used Across Time Frames?
Another strength of technical analysis is its ability to handle different time frames. The same principles apply when trading minute-by-minute changes for intraday or focusing on longer-term trends. Some believe this technique is only valid for short-term analysis, but that’s not true. It can also be very effective for long-term forecasting. Using weekly and monthly charts that span several years, you can successfully apply technical analysis for long-term predictions, just as you do for short-term trades.
Intraday
Intraday means within the same trading day, i.e., buying and selling a stock between market opening and closing.
When to Use Technical Analysis and When Not TO
Market players often see technical analysis as an easy way to earn money in the stock market because it involves identifying patterns and making trading opportunities for them. However, one must try to learn the technique to reach that stage.
Before diving deeper into this technical analysis guide, it’s essential to understand when and when not to use technical analysis.
When to use technical analysis
- Short-term trading: Technical analysis is ideal for intraday or swing trading because it mainly helps capture quick gains based on short to medium-term trends.
- Identifying entry and exit points: Technical analysis reads price and volume to determine the directionality. It helps traders decide when to enter and exit trades by identifying patterns and signals that indicate potential price changes.
- Volatile and liquid markets: Technical analysis helps traders get more accurate signals in volatile markets where fundamental analysis might be less meaningful to deploy. For instance, forex markets have very high liquidity and volatility, and there is historical proof that technical analysis generates decent returns there.
Volatile
A market or stock is considered volatile when its prices change quickly and unpredictably, often with large swings up or down.
Liquid Markets
A liquid market is one where assets can be quickly bought or sold without causing a significant change in their price, typically because there are many buyers and sellers.
When to not use technical analysis
Just like you learned when to use technical analysis, you should also know when not to…
- Not Suitable for Long-Term: Fundamental analysis is more suitable for long-term investments because, over long periods, factors like a company’s fundamentals, industry trends, and overall economic conditions have a more significant impact than price trends. These long-term trends are guided by underlying factors, which fundamental analysis aims to determine. Let’s understand this with TCS, short for Tata Consultancy Services, an IT company whose stock trades on Indian exchanges.
Technical analysis doesn’t always work…
Take Tata Consultancy Services (TCS), a leading IT company in India. You’d choose to invest in TCS for its long-term growth, strong earnings, and solid business model. However, in the short term, regulatory concerns might arise. Technical analysis might signal a short-term decline, helping you avoid buying TCS at a lower value and suffering a loss. So, from a long-term perspective, fundamentals typically play a vital role in the price of assets.
2. Unpredictable Events: Technical analysis offers little help in predicting and capturing profits from significant news events, such as election results, geopolitical issues, or economic events, like changes in GDP and interest rates, because market sentiment shifts suddenly. Thus, technical analysis of stocks is of little use in these situations.
3. Illiquid Markets: Technical analysis often fails in low-liquid assets because low trading activity makes assets easy to manipulate, rendering the logic of technical analysis meaningless. Here, general patterns or indicators of technical analysis don’t work.
In the next chapter, we’ll explore how stock prices fluctuate and learn how to read and interpret them for effective trading.
Summary
1. Technical analysis helps determine the future direction of financial assets using historical data, such as price and volume.
2. This method can be applied to various assets as long as historical data is available, making it adaptable to different time frames.
3. Technical analysis is based on a few core assumptions:
- Markets discount everything: All factors are reflected in the market price.
- Price moves in trends: Significant market moves follow established trends.
- History tends to repeat itself: Price trends repeat due to consistent human psychology.
4. In liquid markets, technical analysis identifies short-term trading opportunities but is less suitable for predicting uncertain events and determining asset values in the long term.
Chapter 2: Types of Stock Price Charts
As we learned, technical analysis is like predicting the future by looking at the past. It assumes that prices follow trends, history repeats itself, and the market tells all. In this chapter, we’ll explore the exciting world of different types of stock price charts, such as line charts, bar charts, and candlestick charts. We’ll also understand the different types of prices: open (O), high (H), low (L), and close (C).
You may wonder why we need charts in the first place. Charts help us clearly see price movements over time, making it easier to spot trends, patterns, and trading opportunities. Since technical analysis requires four data points to be displayed simultaneously for a complete view of price movements, charts also provide a clear picture of the market’s behavior, helping traders make informed decisions.
This chapter will focus on the different types of charts, especially Japanese candlestick patterns, which are one of the most loved chart types. But before that, we’ll look at the pros and cons of other charts to understand why candlesticks are so popular.
Trade Summary
Before we discuss the formation of different types of charts, let’s consider the different types of prices a stock trades at during a regular market day.
The Indian stock market is open from 9:15 AM to 3:30 PM. During these market hours, numerous trades occur throughout the day. Tracking all of these price movements is impossible for a trader. One needs a summary of the trading action that points to the important stuff, not the details on every price point.
Let’s understand what the open, high, low, and close prices are using a real-life example of Reliance Industries’ stock price:
- Open Price: The price at which Reliance Industries’ stock trades first when the market opens at 9:15 AM. For example, on June 7th 2024, the opening price was ₹2,857.
- High Price: The highest price at which Reliance Industries’ stock is traded during the day, between 9:15 AM and 3:30 PM. On June 7th 2024, the high price was ₹2,944.
- Low Price: The lowest price at which Reliance Industries’ stock is traded during the day, between 9:15 AM and 3:30 PM. On June 10th 2024, the low price was ₹2,853.
- Close Price: The price at which Reliance Industries’ stock is traded when the market closes at 3:30 PM. On June 10th 2024, the closing price was ₹2,940.
The trading session is considered ‘positive’ if the closing price is higher than the opening price, like in this case (₹2,940 close vs. ₹2,857 open). It is considered ‘negative’ if the closing price is lower than the opening price.
We use these prices to plot charts, which help us analyze future price movements. But let’s first understand why are charts so useful in the first place.
Why Traders Love Charts?
The chart is a price sequence plotted over a specific time frame, typically with a price scale on the y-axis and a time scale on the x-axis. Charts mainly help see past price movements, which in turn help us predict future price movements. Technical analysts use charts to analyze various securities and forecast future price movements. Charts also help fundamental analysts because they show how a company’s stock price reacts to its financial health.
Security
In finance, security is a claim that you can buy, sell, or trade, like a stock or bond. Stocks represent owning a part of a company, while a bond is a certificate of lending to the company with a promise of repayment with interest. Securities represent financial interest and let you earn from either ownership or lending.
Let’s explore the different types of charts and learn how they can be used.
Line Chart
The most basic chart type is a line chart because it uses only the closing price of the stock price or index over a defined period to form the chart. On the chart, a dot is plotted on a specified period, that is, the closing price, and then these dots are connected, forming a line that is plotted across a specific period of time.
The advantage of a line chart is that it is simple and easy to understand, and a trader can identify general security trends over long periods of time like weeks, months, or years. The disadvantage is that they do not provide additional details besides closing prices, ignoring the open, high, and low prices. Though closing prices are useful,traders prefer seeing more information, taking us to the next type of chart.
Bar Chart
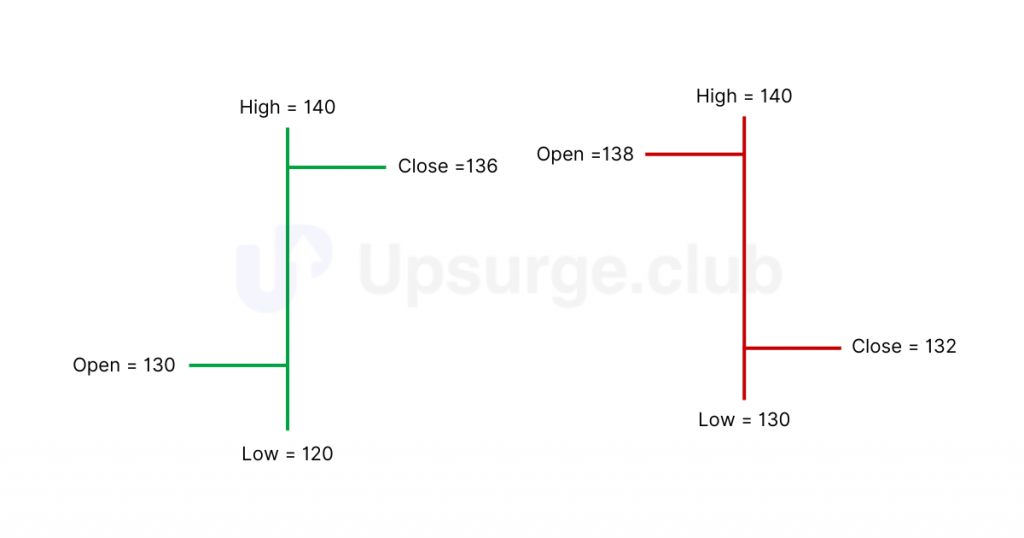
A bar chart is more flexible than a line chart because it considers all price types: open, high, low, and close. A bar chart looks like this and has three components:

Here is a table summarizing what the different lines mean in a bar chart:
| Line | Meaning |
|---|---|
|
Central vertical line
|
The price range of the security during a specific period. The top of this line is the high price, and the bottom is the low price.
|
|
The left horizontal line |
Shows the price at which the security started trading in that period, i.e., opening price. |
|
The right horizontal line |
Shows the price at which the security traded at the end of that period, i.e., closing price. |
Let’s understand with an example. Assume OHLC (open, high, low, close) price data for a stock as follows:
Open – 130
High – 140
Low – 120
Close – 136
For the above data, the bar chart would look like this:
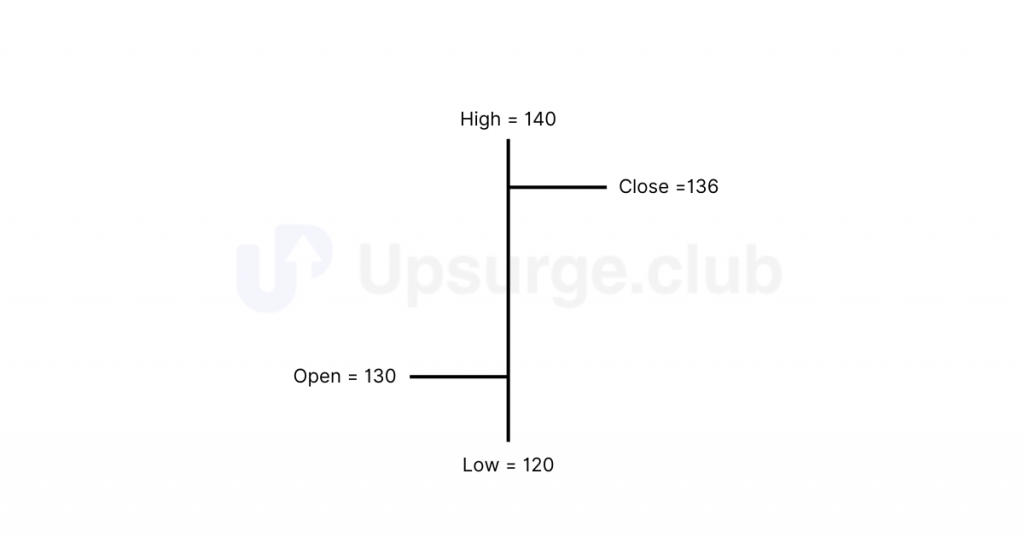
Here, you can see that we can plot all price types over a specific period in a single bar. Hence, if we create one bar for one day, we will have five vertical bars to view a five-day chart. Here is how a bar chart looks:
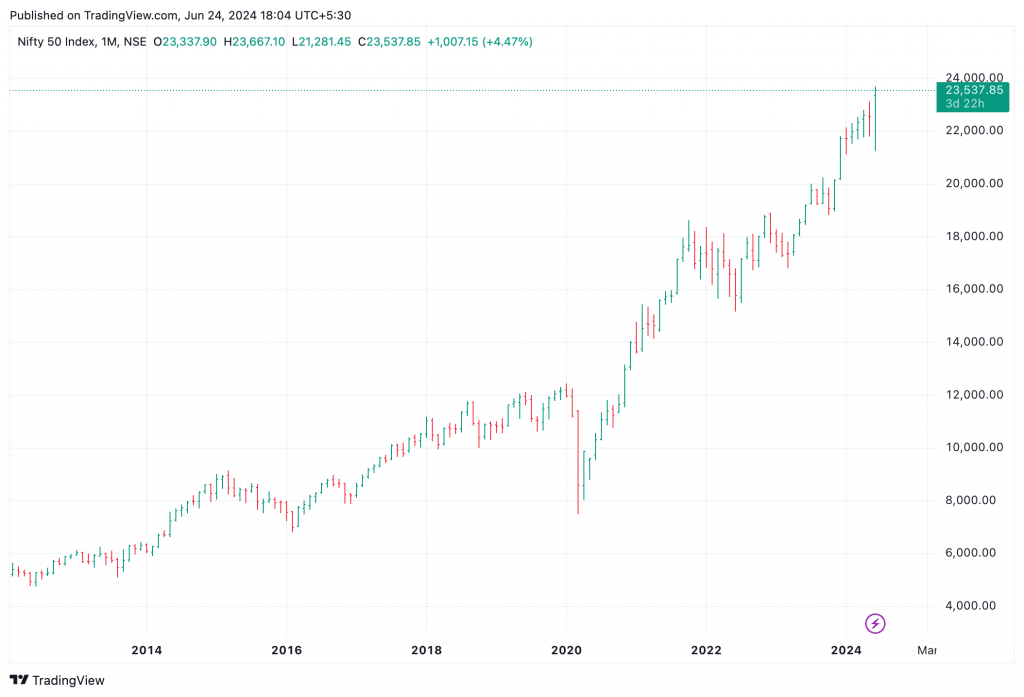
If the left horizontal line, which represents the opening price, is lower than the right horizontal line, i.e., the closing price, then it is a positive day for the markets, called a bullish day. A bullish day is typically represented by a green or blue bar.
If the left horizontal line, which represents the opening price, is higher than the right horizontal line, i.e., the closing price, then it is a negative day for the markets, called a bearish day. A bullish day is typically represented by a red or black bar.
Here is a snapshot of both types of bars:
The bar chart displays all four data points, but its disadvantage is that it lacks visual appeal. It is difficult and tedious to spot potential patterns when looking at a bar chart, especially the opening and closing prices. Analyzing bar charts in multiple time frames becomes more challenging.
Some traders prefer bar charts, so they are worth mentioning. However, most traders prefer Japanese candlesticks, the default option for most charting tools.
So, let’s dive deeper into them.
Lighting Up Your Trading Game with Candlesticks
In the 18th century, Homma discovered that by observing rice’s opening, closing, high, and low prices, he could identify patterns that predicted future price movements. This method allowed him to gain insights into market psychology and price action.
Although candlesticks have been used in Japan for centuries, western traders were unaware of them until the 1980s when Steve Nison introduced them in his book, “Japanese Candlestick Charting Techniques.” Following the book, many candlestick patterns retain their original Japanese names, adding an oriental touch to technical analysis.
Understanding a Candlestick
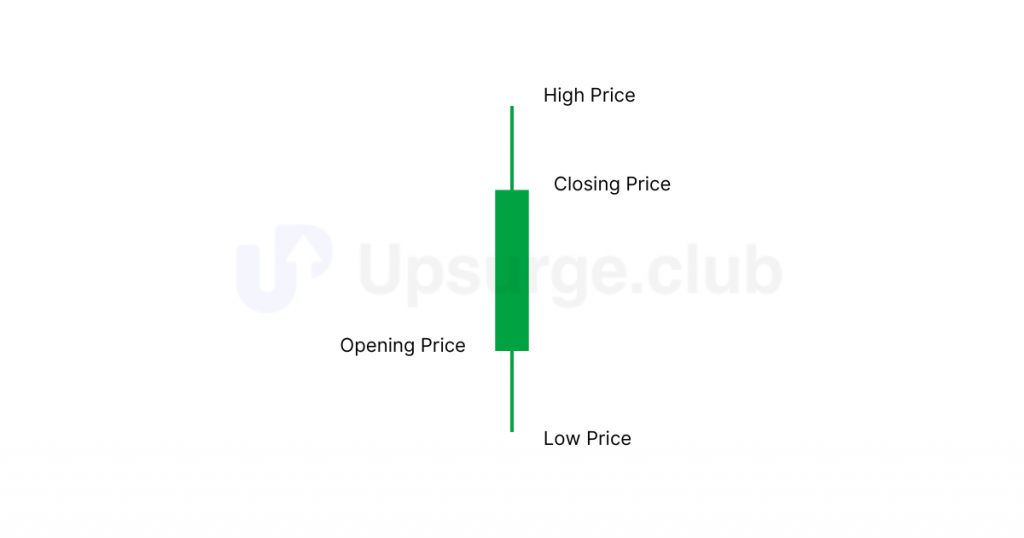
You have seen the bar chart, which shows opening and closing prices by a tick on the left and right of the bar, respectively. However, in a candlestick chart, the opening and closing prices are displayed by a rectangular body, and the high and low prices are displayed using wicks.
The candlestick, like a bar chart, is made of 3 components. Let’s look at how a bullish candlestick looks:
- The central body – The thicker, rectangular body connects the opening and closing price.
- Upper shadow – Connects the high price to the opening or closing price, whichever is greater.
- Lower Shadow – Connects the low price to the opening or closing price, whichever is lesser.
Here’s how a bullish candlestick looks:
Conversely, here’s how a bearish candlestick looks:
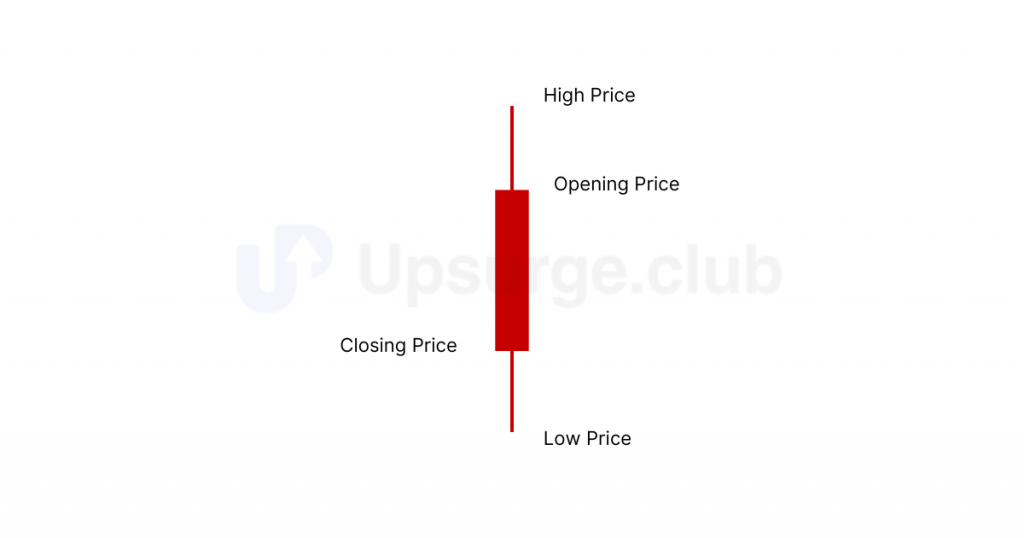
The candlestick chart takes shape by plotting them in a time series: green candles indicate bullishness, and red candles indicate bearishness.
In summary, candlesticks are easier to interpret than bar charts. They help you visualize the relationship between the opening and closing prices and the high and the low prices more clearly than any other chart type.
Interpreting Candlesticks
Candlesticks are super important because they help us predict market trends. They can show if prices will form trends that go up (bullish), down (bearish), or stay the same (sideways). Let’s check out each one!
- Bullish Trends (Uptrends): An uptrend is when prices rise. A bullish trend can be spotted when several candlesticks form consecutively higher, often with most candlesticks being green.
- Bearish Trends (Downtrends): A downtrend is when prices decline. A bearish trend can be spotted when you visit several candlesticks being formed consecutively lower, often with most candlesticks being red.
- Sideways Trends (Consolidation): A sideways trend is when prices remain within a small range over time in a narrow range, indicating little to no movement. This happens when multiple candles on a chart form at about the same level, neither going up nor down.
Now that you have understood candlesticks and their versatility, let’s examine other types of non-candlestick charts as well.
Some Other Useful Chart Types
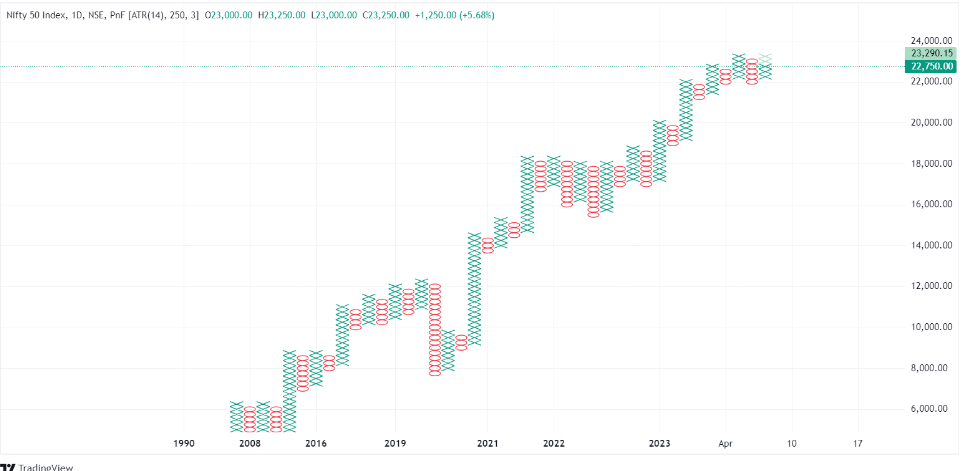
While Japanese candlestick charts are widely used for their versatility, other charts like point and figure, Renko, and Heikin-Ashi charts are also crucial for analyzing trends. These charts offer unique perspectives that can enhance a trader’s understanding of market movements, helping to create a more comprehensive view of price action and trends.
Let’s learn a little about each one of them.
Point and figure charts focus solely on price movements, using Xs and Os to indicate rising and falling prices while ignoring time. This method filters out minor price fluctuations, making identifying major trends easier. However, the downside is that these charts can miss detailed price action since they do not consider the time factor.
As you have seen, you can use different charting types to your advantage, depending on your objective. However, Japanese candlesticks are widely used because of their versatility and simplicity. Here’s a table summarizing the pros and cons of each chart type:
| Chart Type | Pros | Cons |
|---|---|---|
|
Bar Chart |
Shows all price types (open, high, low, close), good for detailed analysis
|
Not very visually appealing, hard to spot patterns quickly |
|
Candlestick |
Easy to read and understand, shows market sentiment with color |
Can look cluttered, might give insufficient context
|
|
Point and Figure |
Filters out small price changes, highlights big trends
|
Ignores time, can miss detailed price movements
|
|
Renko |
Simplifies trends, reduces market noise |
Updates slowly, can miss short-term price changes
|
|
Heikin-Ashi |
Makes trends clearer, reduces small price fluctuations
|
Lags behind real-time changes, can hide immediate price signals
|
The leading reason traders prefer candlestick charts is that they are easily read and visually apparent. It shows crucial information in a simple format, making it easy to spot trends and patterns. Candlesticks reflect market sentiment with color, helping traders understand the market’s mood. Their versatility allows other tools to be used on top of them for a more comprehensive view and valuable analysis.
Trading Time Frames: Your Secret Weapon
When studying how stock prices move, a time frame is the duration of the candlestick you choose to examine. A candlestick can represent the trading activity of a day, week, month, year, or even minute. Choosing the right time frame is crucial in your trading game because it helps you understand different market trends.
The most common time frames used by technical analysts are:
- Monthly candlesticks
- Weekly candlesticks
- Daily or end-of-day candlesticks
- Intraday candlesticks like 30 minutes, 15 minutes, and 5 minutes
Look at the stock price of HDFC Bank and see how its chart differs in different time frames.
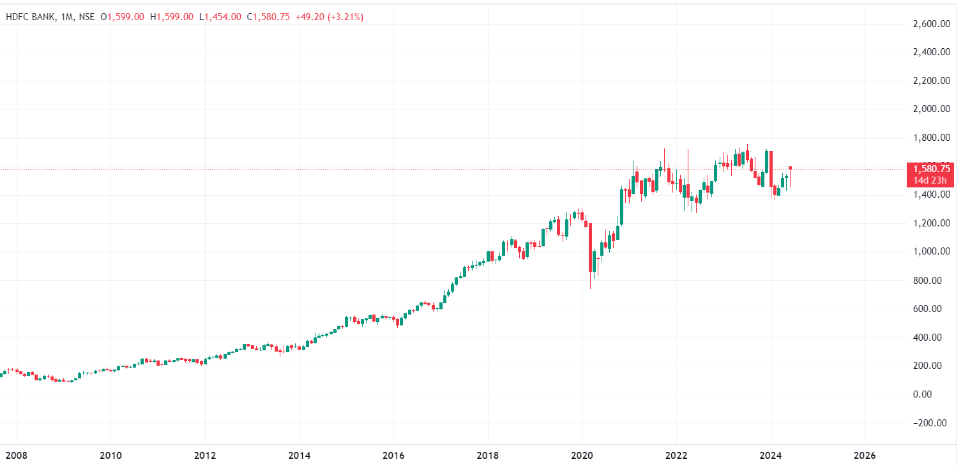
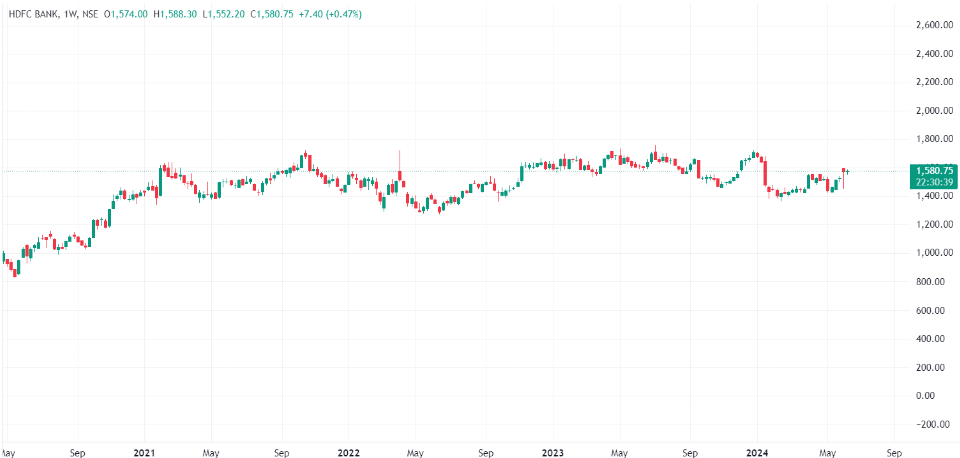
The monthly chart (2007-2024) shows HDFC Bank’s long-term trends over 17 years, as you see the four different time frames. The weekly chart (May 2020-June 2024) captures medium-term trends over four years. The number of candles increases when the time frame reduces.
Now, let’s uncover which time frame is suitable for you.
How to Pick Your Ideal Time Frame for Trading
Choose a time frame that fits your investment goals, market volatility, personal schedule, and trading time availability.
An individual must align the time frame with their trading style and goals. Intraday charts suit short-term traders aiming for quick gains, while long-term investors seeking sustained growth often rely on monthly or weekly charts.
Market volatility also plays a role. For instance, shorter time frames capture rapid price changes in high-volatility markets, while more extended time frames are better for stable markets. One should also consider the time they can give for trading because shorter time frames require more frequent monitoring, which may not be feasible for those with limited availability.
So, choose a trading time frame that matches your goals, market volatility, and availability. Here’s a table summarizing various time frames and when they should be used
| Time Frame | Useful When | Suitable For |
|---|---|---|
|
Monthly
|
Identifying long-term trends and major
market cycles |
Long-term investors |
|
Weekly |
Spotting medium to long-term trends |
Swing traders |
|
Daily |
Analyzing price movements over a period of a few days/weeks |
Swing traders and long-term investors |
|
Intraday |
Detailed views of price movements within a single trading day need to be seen |
Intraday traders |
Swing trader
Swing traders buy and sell stocks to profit from short-term price changes, usually holding them for a few days or weeks. We’ll learn more about swing trading in further chapters.
Traders also combine other time-frames to get a comprehensive of the market. Let’s look at that.
Blending Time Frames for Trading Success
You do not necessarily have to stick to one time frame. You can look at different time frames for trade objectives or even at multiple time frames to get a wider perspective of a stock price’s movement.
To identify the overall trend, you can look at longer time frames, such as daily or weekly. Then, you can switch to shorter time frames, such as hourly or 15-minute charts, to identify entry and exit points in the market. Generally, this method is helpful to avoid false signals and confirm trends. Here’s how it can work.
Let’s get an idea of how this works.
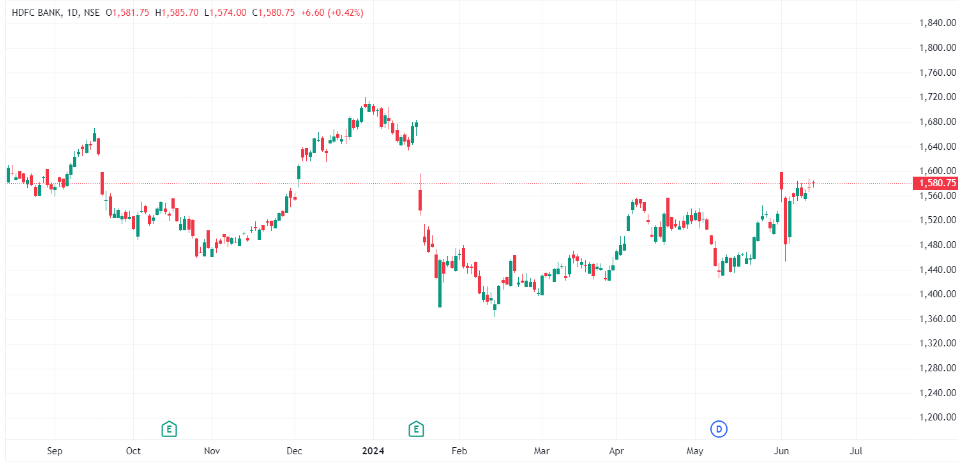
A trader notices HDFC Bank’s stock rising on the daily chart, moving from ₹1,400 to ₹1,450 over the past week. This shows a strong upward trend. The trader switches to a 15-minute chart to find a good buying point.
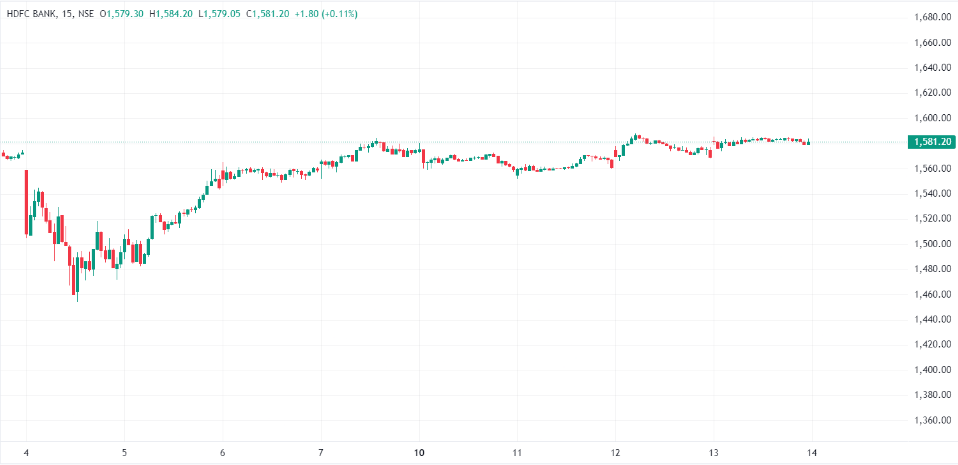
The 15-minute chart shows that HDFC Bank opened at ₹1,455 but then dipped to ₹1,450. This dip can be seen as the stock price briefly returning to its average level before continuing to rise, a concept known as mean reversion.
Seeing this brief dip within the overall uptrend, the trader buys shares at ₹1,450. They increase their chances of success by aligning their short-term trade with the long-term trend and considering the mean reversion.
Using multiple timeframes and the idea of mean reversion, the trader makes a well-rounded decision, reducing the risk of false signals and improving the likelihood of a successful trade.
Summary
- The different types of prices in a defined period – Open, High, Low, Close
- Open Price: The first price at which a stock is traded when the market opens for the day.
- High Price: The highest price at which a stock is traded during a specific period, like a day.
- Low Price: The lowest price at which a stock is traded during a particular period, like a day.
- Close Price: The final price at which a stock is traded, serving as a reference point for the next day.
- Different chart types used in technical analysis include:
- Line Charts: Simple and easy to understand, using only closing prices.
- Bar Charts: Show all price types (open, high, low, close) without visual appeal.
- Candlestick Charts: Preferred by traders for their visual clarity and ability to show market sentiment.
- Japanese candlestick charts are highly favored for their versatility, ease of interpretation, and ability to highlight trends and market sentiment effectively.
- Other Chart Types and Their Characteristics:
- Point and Figure Charts: Focus on price movements and ignore time, making them suitable for spotting major trends but lacking detailed price action.
- Renko Charts: Renko charts use bricks to simplify trends. They effectively highlight trends but can be slow to update as they only form a new brick when the price moves by a specific amount.
- Heikin-Ashi Charts: Heikin-Ashi charts smooth out price data, making trends more apparent. The average price data reduces market noise, but this smoothing causes a lag in real-time changes.
- Select a timeframe that aligns with your investment goals, matches the market’s volatility, and fits into your personal schedule for effective trading.
- Combining longer timeframes (daily or weekly) with shorter ones (hourly or 15-minute) helps identify overall trends and find precise entry/exit points, reducing the risk of false signals.
Chapter 3: Single Candlestick Patterns - Part 1
We have learned that candlestick charts are a better way to interpret market movements than any other chart type. So, in this chapter, we will discuss the most prominent single candlestick patterns that can help us understand these movements better to take a trade.
As the name suggests, single candlestick patterns are formed by just one candle. The trading signal is generated based on a single-period trading action. Trades based on single candlestick patterns can be highly profitable, provided the patterns are identified, rules are followed, and the trade is correctly executed.
Another crucial factor to consider while trading based on candlestick patterns is the length of the candle. One candlestick shows the day's trading activity. Generally speaking, the longer the body, the more intense the buying or selling pressure. Conversely, short candlesticks indicate little price movement and represent consolidation. Here is an image depicting candles with long and short bodies, respectively:

Candlestick Trading Rules
Before we delve into single candlestick patterns, we must remember a few rules that must be followed.
Buy strength, sell weakness
The universal stock market rule says, “Buy low, sell high”. A bullish (green) candle represents a price strength, and a bearish (red) candle represents weakness. Hence, we must ensure it is a green day when we are buying, and whenever we are selling, ensure it’s a red candle day.
Be flexible with patterns
While the textbook definition of a pattern could state specific criteria, minor changes due to market conditions could occur. So we have to be flexible. However, one must be flexible within limits, so quantifying the flexibility is always required.
From now on, we will discuss the different single candlestick patterns. Let’s start with a simple but powerful pattern: the Marubozu.
Marubozu
How does a bullish marubozu form?
A bullish marubozu is a candle whose:
- The closing price is greater than its opening price
- The opening price is equal to the low price, and
- The closing price is equal to the high price.
Whenever a candlestick with the above characteristics occurs, a bullish marubozu is said to be formed. Irrespective of prior trends, a bullish marubozu indicates strong bullishness in the market. It may look like this:
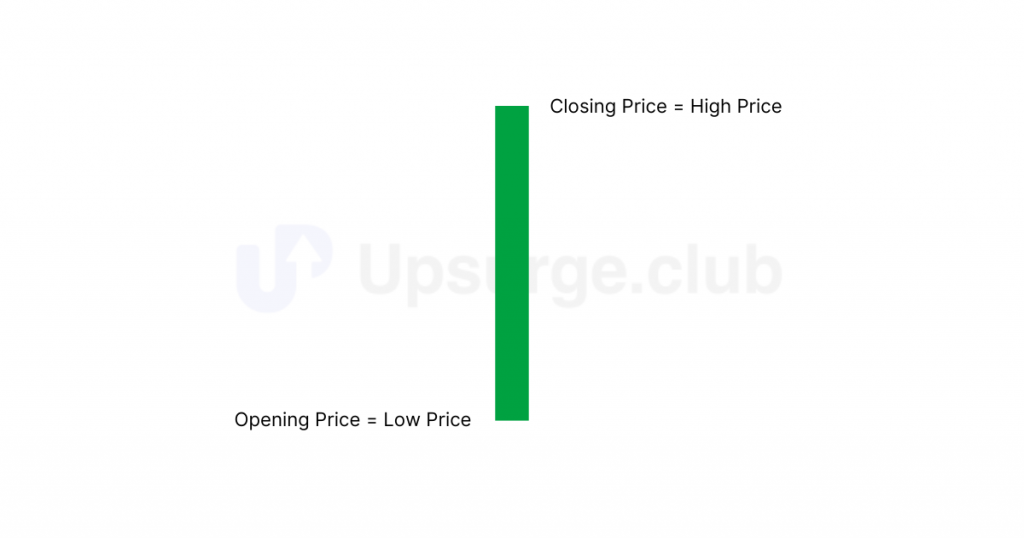
A bullish marubozu signifies enormous buying pressure in the market. Considering a daily chart, market participants are willing to buy from the start of the day until the market closes for trading. This shows buyers have gained control of the market, and the overall market sentiment is bullish.
How to trade a bullish marubozu?
As traders, we should seek buying opportunities since the market outlook has turned bullish with the appearance of the marubozu candlestick. This bullish sentiment is anticipated to persist for the subsequent few trading sessions.
Ideally, a trade can be entered on the same day the marubozu is formed, just before the market closes at 3:20 PM. Still, the bullish marubozu must be validated by checking that the candle’s high equals the stock’s current market price (CMP). If these conditions are met, we will confirm that a bullish marubozu is formed, and we can go long on the stock.
Long
Going “long” on an asset means buying and holding it because you expect its price to increase. This involves purchasing stocks, bonds, or other securities to sell them later at a higher price for a profit. It reflects a positive outlook on the asset’s future performance.
- Entry point: Enter the trade at or just below the close of the bullish marubozu candle.
- Confirmation: An uptrend is confirmed if the next candle is bullish and breaks the high of the marubozu. If you prefer a more risk-averse approach, you can also enter here.
- Stop loss: A stop loss can be placed below the low of the bullish marubozu candle to limit potential losses.
Let’s understand with an example trade in Infosys.
Here, first, we will validate the physical characteristics of a candle as highlighted in the image.
Open = 1414
High = 1427
Low = 1413
Close = 1426
As we know, a bullish marubozu’s opening price should equal its low price, and a high price should equal its closing price. Although the opening price does not match its low price, there is hardly any difference between them. Remember that there can be minor variations in candlestick patterns, and we must be flexible as long as the logic of the concept holds.
Based on our method, the trade setup for the above Infosys stock would be as follows:
Entry price = Between 1427 and 1430
Stop Loss = 1413
But if we want to confirm the formation of a bullish marubozu or have a risk-averse approach, we must wait until the next day. The downside is that buying the next day results in a much higher purchase price and a deeper stop loss.
In our example, buying Infosys on the same or the next day would have been profitable.
Here is another example of a bullish marubozu pattern and a resulting uptrend:
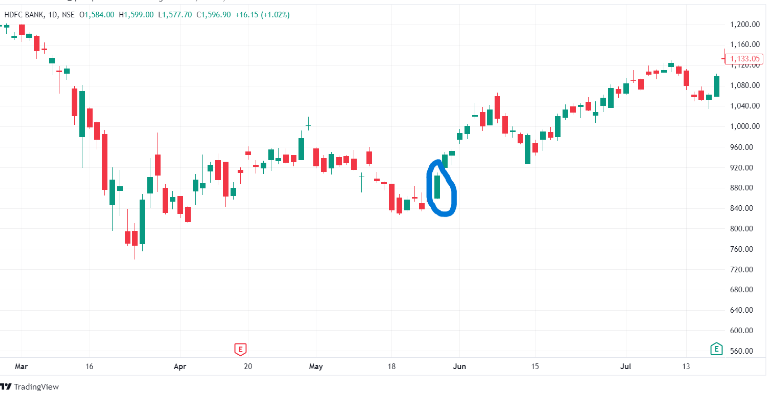
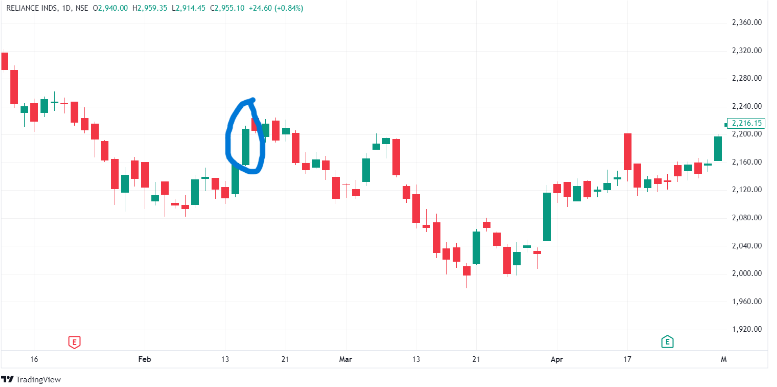
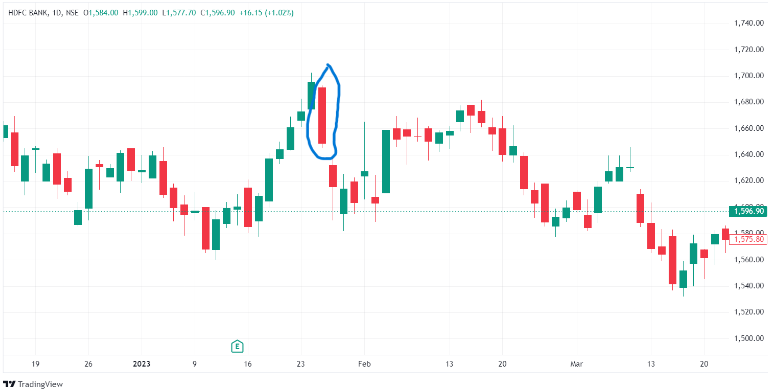
The above example of HDFC Bank shows that it would have been profitable here if we had bought this stock on the same day or the next day. However, there will be some cases where marubozu candlesticks fail, like the one below:

After a bullish marubozu formed on Reliance’s stock, a downtrend resulted. Hence, remember that not every marubozu is foolproof, and having a stop loss can help you deal with such situations.
Now, let’s move on to the bearish marubozu.
Bearish Marubozu
How does a bearish marubozu form?
As a bullish marubozu indicates a strong sentiment of bullishness, the bearish marubozu reflects bearish sentiment in the market, and it is formed when a candle’s
- The closing price is less than its opening price
- The opening price is equal to its high price
- The closing price is equal to its low price
This candlestick indicates selling is done for each price point throughout the day. It does not matter what the prior trend has been; the action on the marubozu day suggests that the sentiment has changed, and the stock is now bearish.
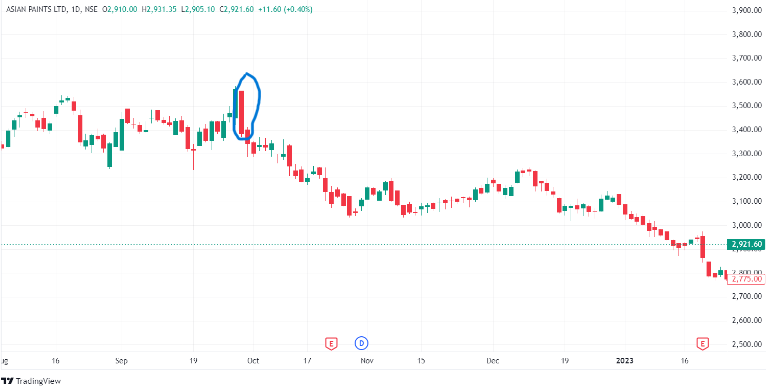
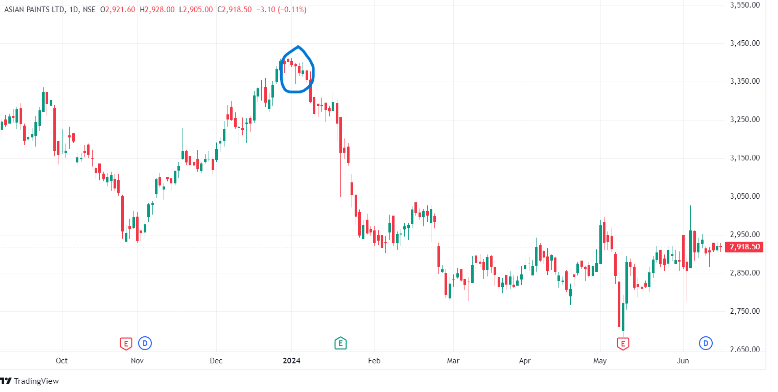
In the above chart of Asian Paints, a bearish marubozu pattern is formed after a significant drop in the stock. If we look at the OHLC data,
Open = 3563
High = 3563
Low = 3378
Close = 3378
As mentioned before, a slight variation in OHLC is acceptable up to a specific limit.
Typically, for a marubozu candle, the open and high (for bearish marubozu) or open and low (for bullish marubozu) can have a slight difference, generally not more than 1% of the stock's price. We use this 1% limit because it ensures the candle still clearly indicates strong selling (or buying) pressure without significant price fluctuations, which might otherwise weaken the reliability of the marubozu pattern.
For example, if the stock price is 3563, a 1% variation would be about 36 points. So, if the high were slightly higher at 3599, it would still be considered a valid marubozu pattern. This 1% limit maintains the integrity of the marubozu pattern by ensuring it accurately reflects market sentiment.
How to trade a bearish marubozu?
A trader should look out for shorting opportunities in the market because sudden changes in sentiment will be carried forward over the subsequent few trading sessions.
- Entry Point: Enter the trade at the close of the bearish Marubozu candle or the opening of the next candle.
- Confirmation: Confirm the downtrend by checking if the next candle breaks the marubozu low. If you prefer a more risk-averse approach, you can also enter here.
- Setting Stop Loss: Place the stop loss at the high of the Marubozu candle to limit potential losses if the trade goes against you.
Let’s look at an example in HDFC Bank’s stock:
When the Pattern Falls Short
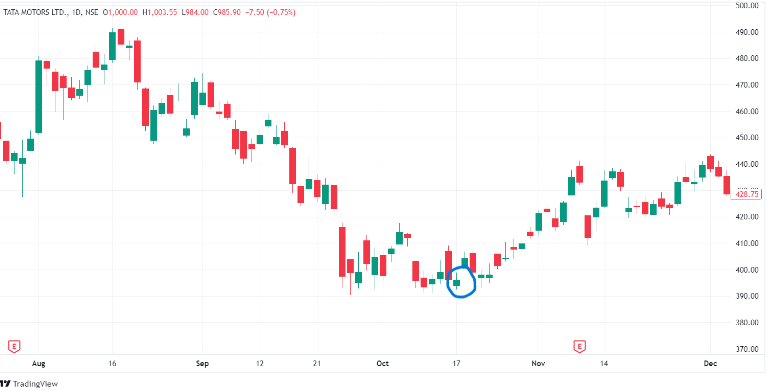
Earlier in this chapter, we discussed why a candle’s length is essential. We should avoid trading when the candles are small because they show low trading activity. Small candles make it hard to predict market movement because they indicate that prices are the same, making it unclear how the market is going. With fewer people trading, price signals are less reliable, increasing overall volatility.
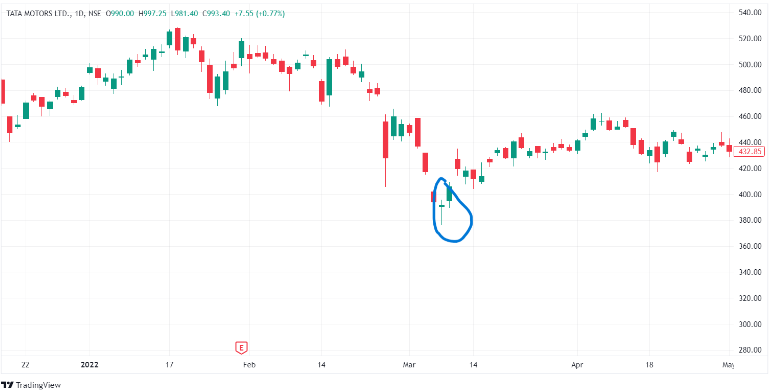
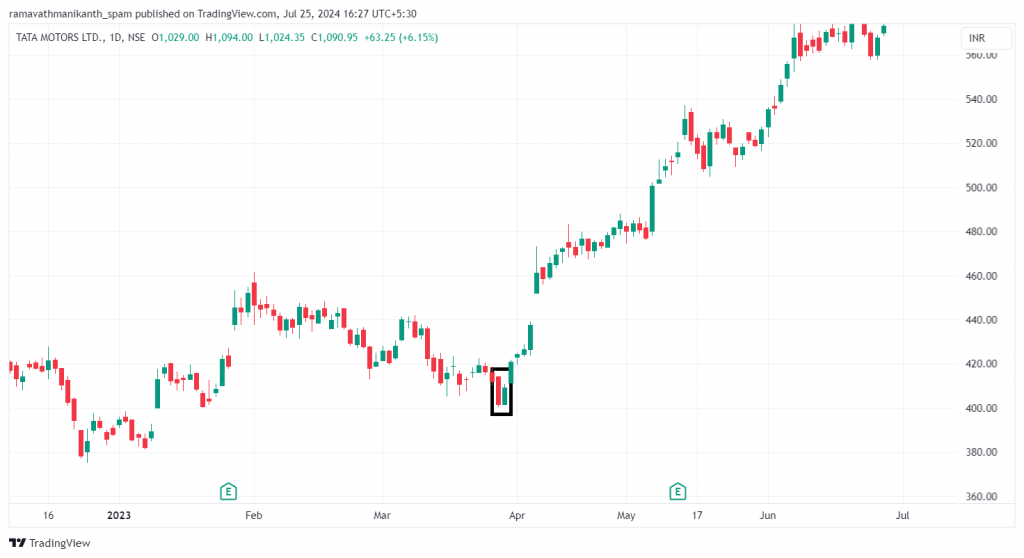
Here is an example from the Tata Motors Ltd. chart:
For this reason, one should avoid trading in too short candles.
Let’s move on to the second candlestick pattern – the Doji.
Doji
How does a doji form?
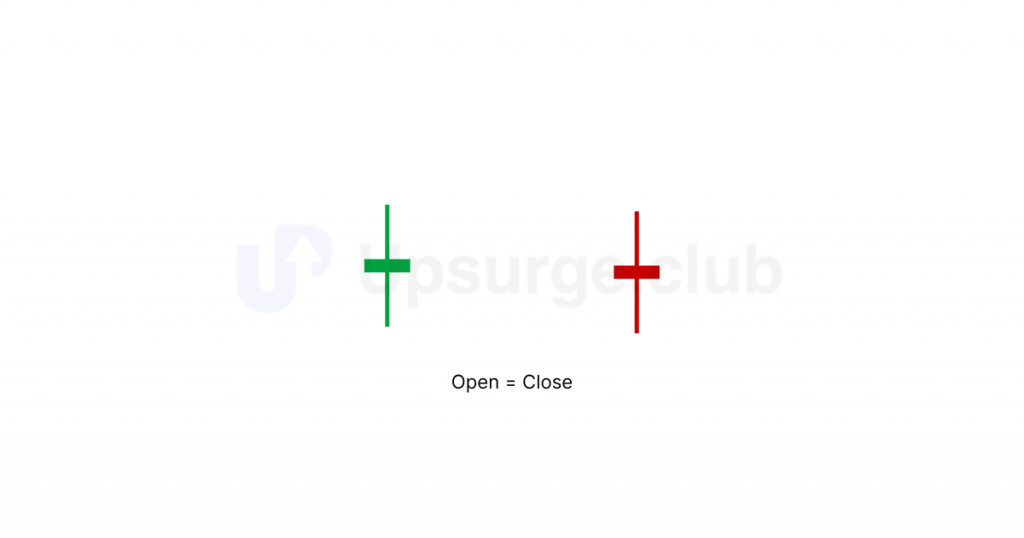
A Doji is formed when
- The opening price of a candle is equal to the closing price.
The upper and lower wicks can be of any length, resulting in the cross, inverted cross, or plus sign. It is a vital candlestick pattern that tells us about market sentiment. The word “doji” refers to both the singular and plural forms.
Though bullish and bearish dojis signify roughly the same sentiment, here’s a pictorial representation of the candlestick:
A doji conveys a sense of indecision or tug-of-war between buyers and sellers. Prices move above and below the opening level during the session but close at or near the opening level. The result is a standoff. Neither bulls nor bears could gain control, and a turning point could develop.
A doji can signal different things based on its place in the trend, making it a vital pattern to watch. Let’s discuss each one.
Doji in an uptrend
The relevance of doji depends upon the preceding trend or preceding candlesticks. The formation of doji after an uptrend or a long green candlestick shows that buying pressure is weakening. After a downtrend or a prolonged red candlestick, a doji signifies that selling pressure is easing.
Dojis indicate that supply and demand are balancing, and a trend change may be near. Dojis alone don’t confirm a reversal; further proof is needed.
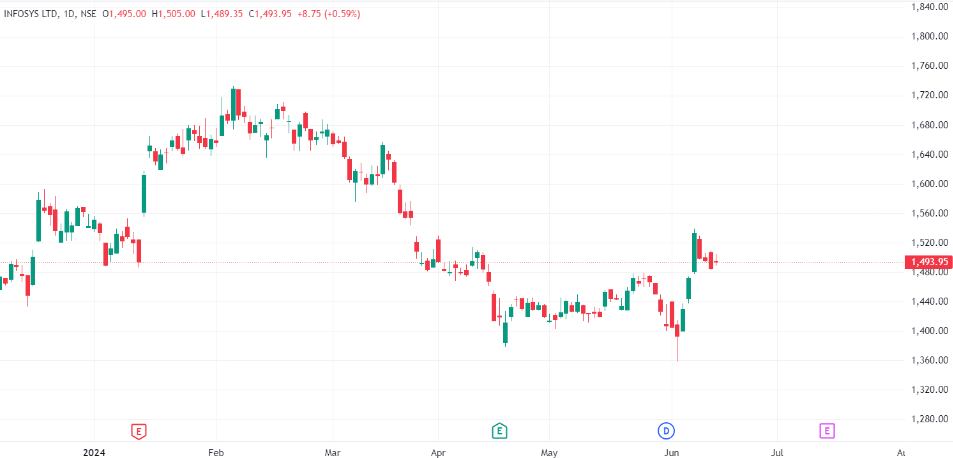
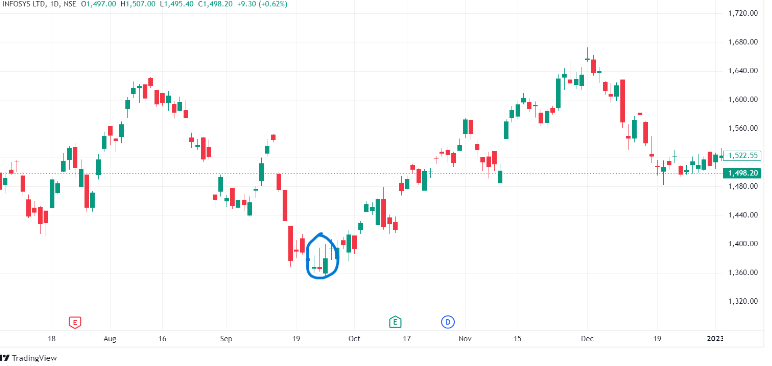
Let’s look at the daily chart of the Infosys Ltd. chart.
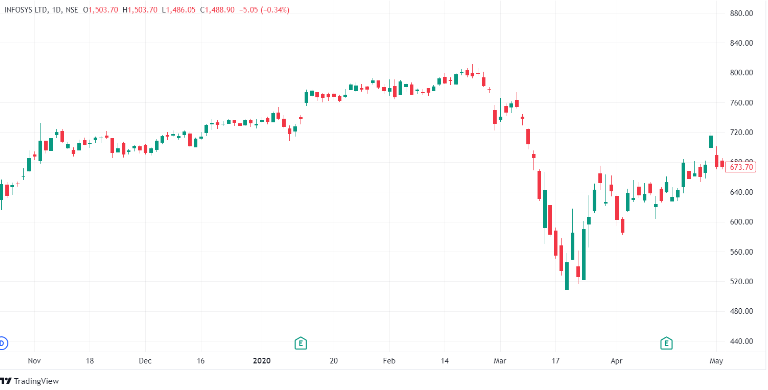
Here, the doji appears after a healthy uptrend, after which the stock reverses its direction and corrects.
Doji in a downtrend
After a decline or long red candlestick, a doji shows that selling pressure might be easing, and the downtrend could end. Though the bears are losing control, more strength is needed to confirm a reversal.
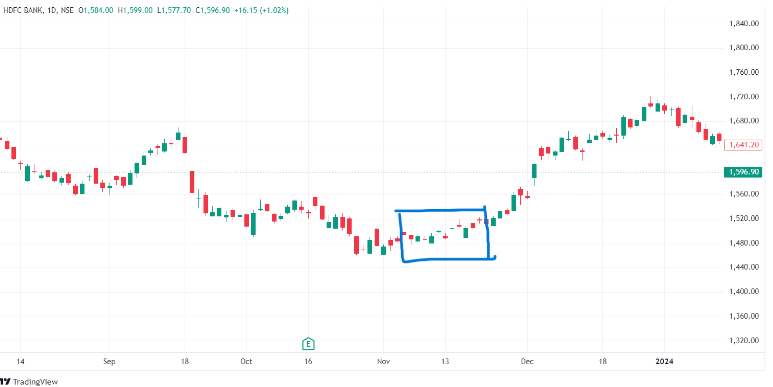
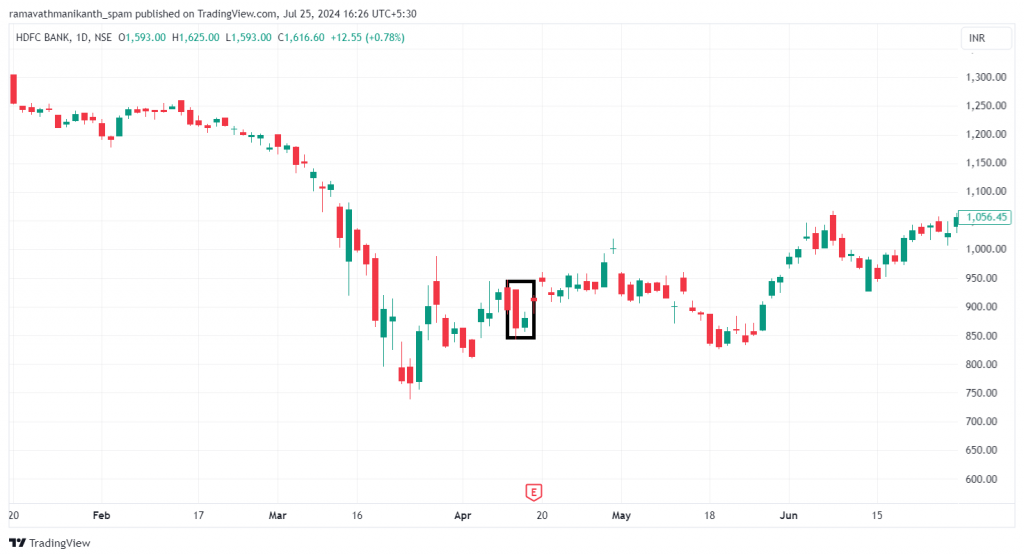
The chart shows an initial downtrend, indicating a period of selling pressure for HDFC Bank. Following this, several doji candlesticks suggest indecisiveness in the market, as buyers and sellers have a definitive upper hand. After this period of indecision, the buyers are marking a significant upward movement.
So, the next time you see a doji individually or in a cluster, remember that the market is indecisive. The market could swing either way, and you need to build a stance that adapts to the expected movement.
Other types of doji candles also exist, depending on their shape and size. Let’s decode each one.
- Long-Legged Doji: These candles have long upper and lower shadows almost equal in length. These reflect a significant amount of indecision in the market. Long-legged doji indicate that prices traded well above and below the session’s opening level but closed virtually even with the open. After much noise and commotion, the outcome was almost the same as the beginning of that day.
- Dragonfly Doji: A Dragonfly Doji forms when the open, high, and close prices are the same, creating a long lower shadow. The candlestick resembles a “T” because there is no upper shadow. This pattern indicates that sellers controlled the session, pushing prices down, but by the end, buyers returned and brought prices back up to the opening level. A Dragonfly Doji suggests a potential reversal or shift in market sentiment.
- Dragonfly Doji in a Downtrend: In a falling market or near a low point, this pattern can suggest a possible turnaround to higher prices.
- Dragonfly Doji in an Uptrend: In a rising market, a Dragonfly Doji means buyers tried to push prices up, but sellers were still strong. After a good rally, this pattern suggests a price drop. We need more proof to confirm this change.
3. Gravestone Doji: This candle’s structure is inverted to dragonfly doji, resulting in an upside-down “T” due to the lack of a lower shadow. It is formed when the open, low, and close are equal. The psychology behind this candle is that sellers had resurfaced by the end of the day and pushed prices back to the opening level and the session low.
- Gravestone Doji in a Downtrend: After a long downtrend, a long black candlestick, or near a low point, the focus shifts to the buying pressure, suggesting a potential bullish reversal.
- Gravestone Doji in an Uptrend: Gravestone Doji shows a failed rally despite some buying pressure in a rising market. Near a high point, this pattern suggests a potential bearish reversal.
Here’s an image representing all types of Doji

In the next chapter, we will study the hammer candlestick pattern and its different variations. We will also understand how to set targets while trading with single candlestick patterns.
Summary
1. A single candle represents day trading activity. The length of the candle is very crucial. Longer bodies indicate stronger buying or selling pressure, while shorter ones indicate consolidation.
2. A marubozu candlestick does not have an upper or lower wick, which indicates strong momentum on either side.
- Bullish marubozu candle’s open = low, close = high, shows bullishness
- Bearish marubozu candle’s high=open, low=close,showing bearishness
3. A doji candlestick represents indecisiveness in the market. One should also consider the preceding candle to anticipate future market sentiment.
Chapter 4: Single Candlestick Patterns - Part 2
This chapter will focus on the four candlestick patterns: hammer, inverted hammer, hanging man, and shooting star.
Hammer
How does a hammer form?
A hammer is a significant candlestick pattern that is formed after a downtrend. It is formed when
- The closing price is near the high,
- The opening price is near the high, and
- There is enough gap between the closing price (in case of bearish) or opening price (in case of bullish) and the candle’s low.
The longer, the lower the shadow, the more bullish the pattern. Here is how a hammer may look, whether bullish or bearish.

A hammer candlestick pattern forms when sellers push the price down, but buyers step in and drive it back up, showing strong buying interest and a potential reversal. The color of a hammer doesn’t matter much because its shape indicates a possible reversal. The key is the shadow-to-body ratio. The natural body of a hammer candlestick should be small compared to its long lower shadow, which should ideally be at least twice the length of the natural body.
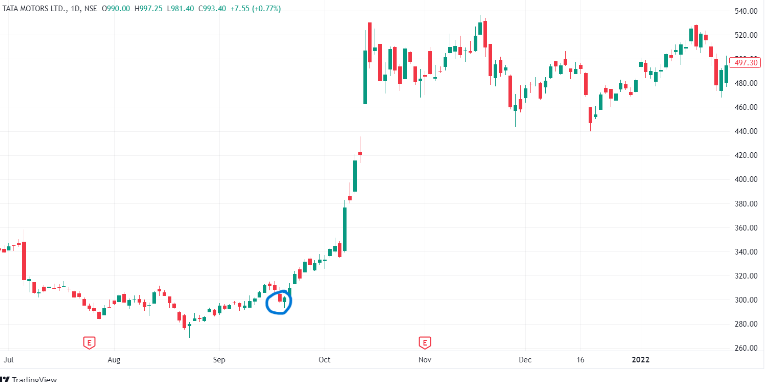
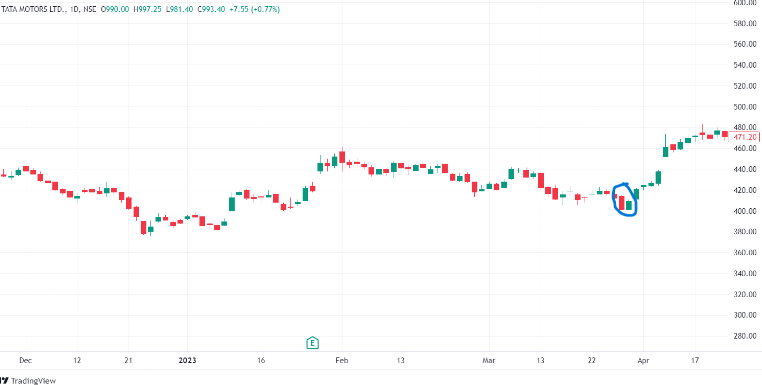
Let’s understand the above chart. Tata Motors faced a significant decline with sellers in control. Each day, the stock opens and closes lower than the previous day’s close, making a new low. When the hammer candlestick is formed, some buyers step in and start buying the stock, pushing it to near the day’s high.
The hammer’s occurrence shows that buyers are trying to stop the stock from falling further and becoming somewhat successful. This has resulted in a bullish market sentiment, making it an excellent time to look for buying opportunities.
How to trade a hammer?
The trade setup for the hammer candle is that we should go long if it occurs after a downtrend, entering at the closing price of the hammer and keeping the stop loss as low as the hammer.
- Entry: Enter a long position at the opening of the candle that forms after the hammer.
- Confirmation: A hammer is more reliable in a downtrend if the next candlestick shows a higher close, indicating a potential bullish reversal.
- Stop Loss: Place a stop loss below the low of the Hammer candle to limit potential losses if the trade goes against you.
For instance in the chart of Tata Motors Ltd. below, the buying price is the closing of stock, at 391, and the stop loss is placed at 376. As the above candle has a slight upper wick, we can consider it as a hammer according to the second candlestick rule (be flexible). In the below trade, we would have been profitable.
Hanging Man
How does a hanging man form?
A hanging man is nothing but a hammer pattern appearing an uptrend. It is formed when
- The opening price is almost similar to the higher price,
- The closing price is nearly identical to the higher price,
- There is enough gap between the closing price (in case of bearish) or opening price (in case of bullish) and the candle’s low.
A hanging man signals a market high. The market is in an uptrend, signaling a bullish trend. The bears entered after the hanging man’s formation, depicted by a longer lower shadow. The entry of bears signifies that they are trying to break the stronghold of bulls. Forming after an uptrend, this candlestick pattern signals selling pressure.
A hanging man helps traders to set up directional trades. The color of the candlestick does not matter much, but the crucial thing we must consider is a shadow-to-accurate body ratio, where the length of the shadow should be at least double the size of the body.
Let’s look at the example of the hanging man below:
In the above chart of Asian Paints Ltd., a significant downfall can be seen after the occurrence of a hanging man.
How to trade a hanging man?
As a hanging man is a bearish reversal candlestick pattern, one should look for shorting opportunities in a particular stock or index. Wait for the formation of the closing of the hanging man candle.
- Entry point: You can create a short position at the opening of the candle after the hanging man
- Confirmation: Look for a bearish signal, like a gap down or lower close, after a significant uptrend and hammer pattern is formed, to ensure reliability
- Stop loss: Place a stop loss above the high of the hanging man to limit potential losses if the trade goes against you.
In the above chart of Asian Paints, the entry would be at 3396, and the stop loss would be the high of the candle at 3398.
Shooting Star
How does a shooting star form?
The shooting star is a candlestick pattern, indicating potential trend reversal. It has a long upper shadow where the shadow length is at least twice the length of the natural body.
- The opening price is almost equal to the closing price,
- The low of the candle is nearly equal to the closing price, and
- There is a significant gap between the closing price and the high of the candle
Though the color of the candlestick does not change its interpretation, it is comforting to know when a shooting star is bearish. Here is how it looks:

Let’s look at the pattern forming in a chart:
Here’s the logic for the shooting star candlestick pattern formation. The stock is in an uptrend, with bulls in control, making new highs and higher lows. On the day the shooting star pattern forms, the stock trades higher and creates a new high.
However, selling pressure at the high point causes the price to drop, closing near the day’s low and forming a shooting star. This indicates the bears have entered, successfully pushing prices down, as evidenced by the long upper shadow. The bears are expected to continue selling in the coming sessions, potentially reversing the uptrend.
The longer the upper wick, the more bearish the pattern. According to the textbook definition, the shooting star should not have a lower shadow. However, as the chart above shows, a small lower shadow is acceptable. The shooting star is a bearish pattern; hence, the prior trend should be bullish.
Here is another example of a shooting star forming on the chart of Cipla Ltd.:
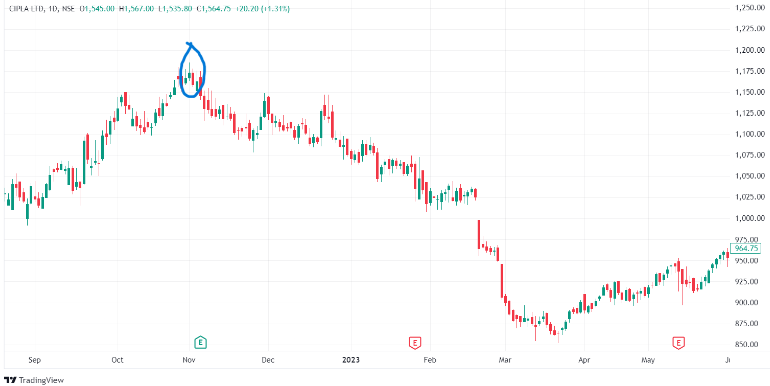
The highlighted candle has the following prices:
Open = 1167
High= 1185
Low=1167
Close=1173
The above candle qualifies as a shooting star since
- The prior trend is bullish
- The shadow-to-body ratio is 1.8 (~ 2)
How to trade a shooting star?
You should look for shorting opportunities when coming across shooting star candlestick patterns.
- Entry: Create a short position at the opening of the candle after the shooting star is formed
- Confirmation: A shooting star is confirmed if the next candlestick shows a lower close, indicating a potential bearish reversal.
- Stop loss: Place a stop loss at the high price of the shooting star candle to limit potential losses if the trade goes against you.
Inverted Hammer
How does an inverted hammer form?
The candlestick pattern is a shooting star formed at the bottom of a downtrend, signaling a bullish reversal.
An inverted hammer is formed when
- The opening price is almost equal to the closing price
- The low of the candle is nearly equal to the closing price, and
- There is a significant gap between the height of the candle and the close of the candle
Just like a hammer, the interpretation of this candlestick does not depend upon the candle’s color. But we have to look for a shadow-to-body ratio is double. This candlestick has a long upper shadow and no lower shadow.
The psychology of the inverted hammer shows a possible end to a downtrend, indicating that buyers are starting to take interest in the stock at lower prices. This means that after selling for a while, buyers step in and push the price up, forming a long upper shadow. Then, some selling happened again, bringing the price back near the opening level, creating a small body.
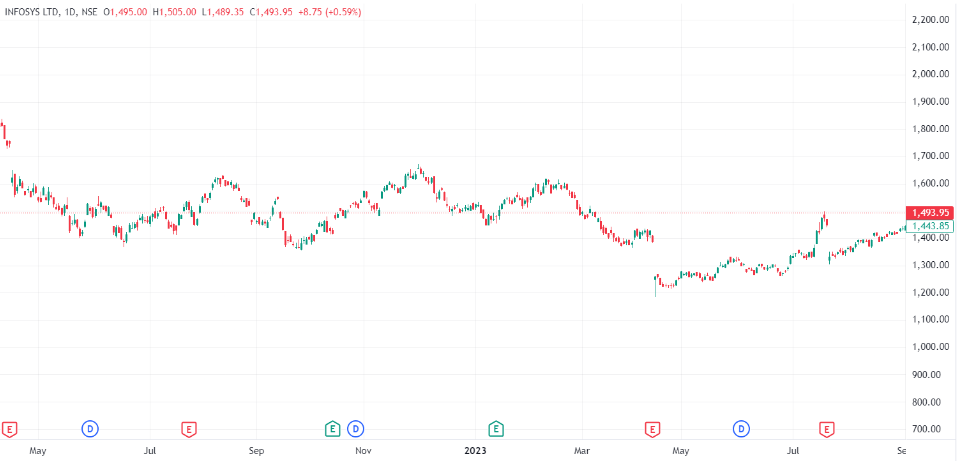
The below chart shows that Infosys’s inverted hammer took place at the end of the downtrend; after which the stock rallied significantly.
How to trade an inverted hammer?
An inverted hammer signifies an upcoming bullish trend. Here’s how a trade can be taken:
- Entry: Create a long position at the opening of the candle that forms after the inverted hammer.
- Confirmation: An inverted hammer is confirmed if the next candlestick shows a higher close, indicating a potential bullish reversal.
- Stop loss: Set a stop loss just below the low of the inverted hammer.
Let’s look at an example.
According to the rules, the trade setup for the above chart would be an entry at the closing of the inverted hammer at 398, and stop loss would be placed at the low of the candle at 392.
Target Setting for Single Candlestick Patterns
So far, we’ve explored the psychology behind single candlestick patterns and how to use them for entering trades. But have you ever thought about what our targets should be for these trades? Let’s dive into how we can set these targets strategically now.
To set a target, we need to know the risk-reward ratio concept.
The risk and reward ratio is a crucial concept in stock trading. It helps you understand how much you stand to gain compared to how much you might lose on each trade. This ratio can guide decisions to maximize profits and minimize losses.
Risk to Reward Ratio = Potential Gain / Potential Loss
If you buy a stock at a price of 100, and set a stop loss at 80, your potential loss (in case you hit the stop loss) is 20 (100 - 80). Similarly, if you set a target of 140, your potential gain (if you hit your target) is 40 (140 - 100).
Hence, the risk to reward ratio is 20:40, which can be written as 1:2.
We aim for a minimum risk-to-reward ratio of 1:1:5; let’s learn why.
Why Use the 1:1.5 Risk-to-Reward Ratio
The 1:1.5 risk-reward ratio means you aim to make 1.5 units of profit for every unit of risk. For example, if you risk ₹100 on a trade, your target profit is ₹150. This ensures your potential gains are more significant than your possible losses.
A key benefit is that it increases your chances of making a profit, even if not all trades are successful. With higher rewards for your risks, fewer winning trades can cover your losses and improve overall results. Setting a higher reward target keeps losses small compared to potential gains, which is crucial for long-term trading success. It helps you avoid significant losses that can impact your trading account.
Finally, the 1:1.5 risk-reward ratio offers a statistical advantage. Even if you win only 40% of your trades, this ratio can still lead to overall profits, making it an intelligent approach for trading in the volatile stock market.
Although it’s essential to choose a risk-reward ratio that matches your risk appetite, everyone’s comfort level with risk varies, so select a ratio that aligns with your individual trading goals and risk tolerance.
While knowing the 1:1.5 risk-reward ratio as a target is applicable, setting precise targets using a single candlestick pattern can be difficult. In the following chapters, we will discuss multiple candlestick patterns and indicators. These tools will help you set more effective targets and make better-informed trading decisions.
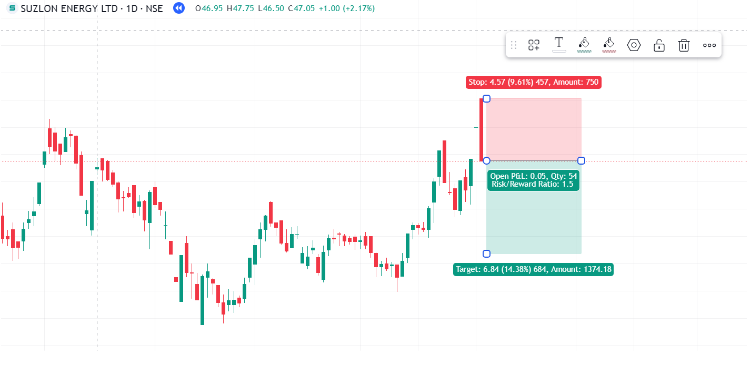
Let’s understand better with an example.
For instance, take Suzlon on a daily timeframe. It is forming a bearish marubozu angle candlestick. As we know, one should look for shorting opportunities because it signals bearishness. So we enter a short position at the closing of the candle, that is at 47.5, and we keep the stop loss at a high of the candle, which is at 52.40.
We now set a target of 40 so that Suzlon should go down by 7.5 points as our stop loss is approximately 4.5 points. In this way, we will have a risk of 5 in case it hits our stop loss and a reward of 6.8 points, maintaining the risk-to-reward of 1:1.5.
In the below image, you can see a short position on Suzlon’s stock, having a risk-to-reward ratio of 1:1.5:
Summary
- A hammer candlestick indicates a potential reversal from bearish to bullish sentiment. It is formed after a downtrend, with a small body at the upper end and a long lower shadow.
- The shooting star is a bearish candlestick that appears at the peak of an uptrend. It signals a potential bearish trend.
- The 1:1.5 risk-reward ratio helps ensure that your potential gains are greater than your losses, improving your trading results and protecting your capital.
- It’s difficult to set exact targets with single candlestick patterns alone, so we’ll examine more patterns and indicators for better accuracy.
Chapter 5: Two Candlestick Patterns
Two is better than one, even when it comes to candlestick patterns. In a double candlestick pattern, we analyze two candlesticks to make a trading decision. This means the trading opportunity unfolds over a minimum of two trading sessions.
This chapter will focus on some important two candlestick patterns: engulfing, harami, and tweezer candlestick patterns.
Engulfing Pattern
The first double candlestick pattern we are going to talk about is the engulfing pattern. As we have discussed earlier, double candlesticks require two candlesticks; the first candle with a relatively tiny body, and the second candle’s body completely engulfs the previous one and closes in the opposite direction of the trend. The engulfing pattern is a reversal pattern: it’s bullish at the end of a downtrend and bearish at the end of an uptrend.
Let’s look at their pictorial representation.
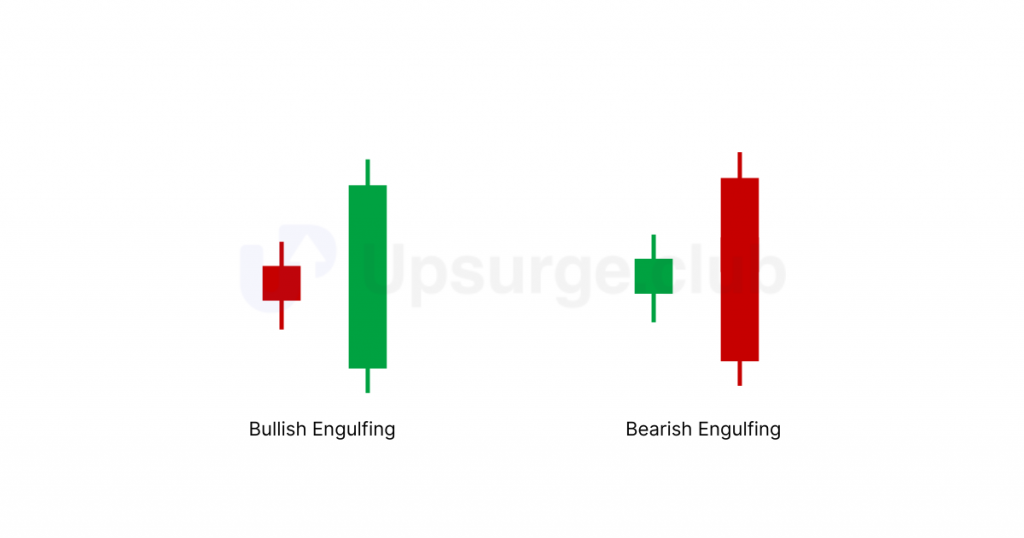
Bullish Engulfing Pattern
How does a bullish engulfing pattern form?
A bullish engulfing candlestick pattern occurs when it is found at the bottom of a downtrend. It is a potentially bullish reversal candle, which means that people tend to buy it after its formation.
The pre-requisites for a bullish engulfing candle are:
- The prior trend should be a downtrend.
- The first candle should be bearish, re-confirming the bearishness in the market.
- The second candle should be bullish, with a body long enough to engulf the whole previous candle, including its wicks.
Here is an image of a bullish engulfing candle forming at the bottom of a downtrend:
This is how it works:
- The market is in a downtrend, dominated by sellers, as shown by bearish (red) candles.
- A large bullish (green) candle forms, completely engulfing the previous bearish candle, signaling a solid shift in control to buyers.
- The bullish engulfing candle indicates strong buying interest and a change in market sentiment from bearish to bullish.
- This pattern suggests a potential reversal of the downtrend, with buyers gaining strength and the market moving upwards.
How to trade a bullish engulfing pattern?
Bullish engulfing is a potential bullish reversal trend that signals bullish sentiment in the market. The trading plan would be:
- Entry: Enter the trade at the opening price of the next candle, i.e., at the candle that forms just after the formation of the engulfing candle.
- Confirmation: An entry is confirmed if it is found after a downtrend, the second candlestick is bullish and engulfs the previous bearish candle, and the candlestick formed after the pattern closes higher than the bullish candle’s high, indicating a potential bullish reversal.
- Stop loss: Place the stop loss just below the low of the bullish engulfing pattern. This helps to minimize risk in case the pattern fails.
You must remember how to set a target, as explained at the end of the single candlestick chapter. If you need a refresher, give it a quick read here. The same applies to 2 candlestick patterns, too.
Assuming we are going long on Tata Motors, where a bullish engulfing pattern is formed.
- Entry for the above bullish engulfing candle is the opening of the following candle, which is at 122.80.
- Stop loss would be low of the previous candle, which would be at 113.00.
- The target is to aim for a risk-to-reward ratio of 1:1.5.
There often needs to be more clarity about whether a bullish engulfing pattern needs to engulf the entire previous candle, including the wicks, or just the natural body. If the natural body is engulfed, it can be considered a bullish engulfing pattern. Some may disagree, but what truly matters is how effectively you develop your trading skills with this pattern.
Bearish Engulfing Pattern
How does a bearish engulfing pattern form?
A bearish engulfing pattern signals bearishness in the market and indicates a potential reversal from an uptrend to a downtrend. It forms during an uptrend and suggests that the market sentiment has shifted, opening the door for a downward move.
The pre-requisites for a bearish engulfing candle are:
- The prior trend should be an uptrend.
- The first candle should be bullish, reconfirming the bullishness in the market.
- The second candle should be bearish, and long enough to engulf the green candle.
Here is a chart that has a bearish engulfing pattern forming at the end of an uptrend:
The above chart shows a bearish candle formed after an uptrend, totally covering the previous bullish (green) candle. There is a significant drop in the market after the occurrence of a bearish engulfing pattern.
- The market is in an uptrend, dominated by buyers, as shown by bullish (green) candles.
- A significant bearish (red) candle forms, completely engulfing the previous bullish candle, signaling a solid shift in control to sellers.
- The bearish engulfing pattern indicates intense selling pressure and a change in market sentiment from bullish to bearish.
- This pattern suggests a potential reversal of the uptrend, with sellers gaining strength and the market moving downwards.
Now, let’s see how we should trade the bearish engulfing pattern.
How to trade a bearish engulfing pattern?
- Entry: Enter the trade at the opening price of the next candle, i.e., at the candle that forms just after the formation of the engulfing candle.
- Confirmation: A bearish engulfing pattern is confirmed if it occurs after an uptrend, the bearish candle completely engulfs the previous bullish candle, and the next candle closes lower than the low of the bearish engulfing candle, signaling a potential bearish reversal.
- Stop Loss: Set the stop loss at the high of the bearish engulfing candle to minimize risk if the pattern fails.
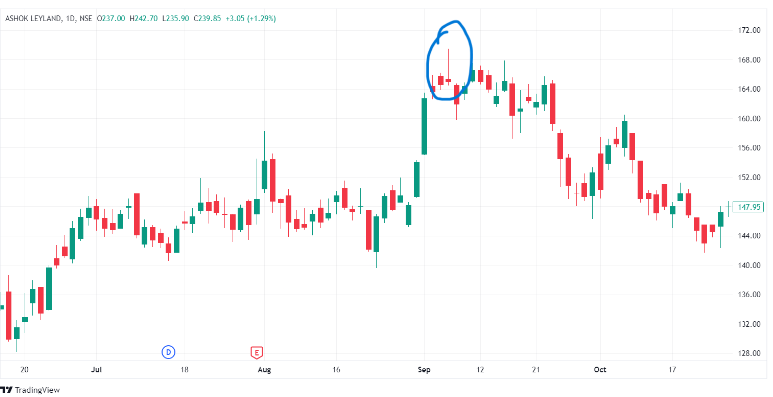
Let’s look at how a trade in Ashok Leyland enflolds using the bearish engulfing candlestick pattern.
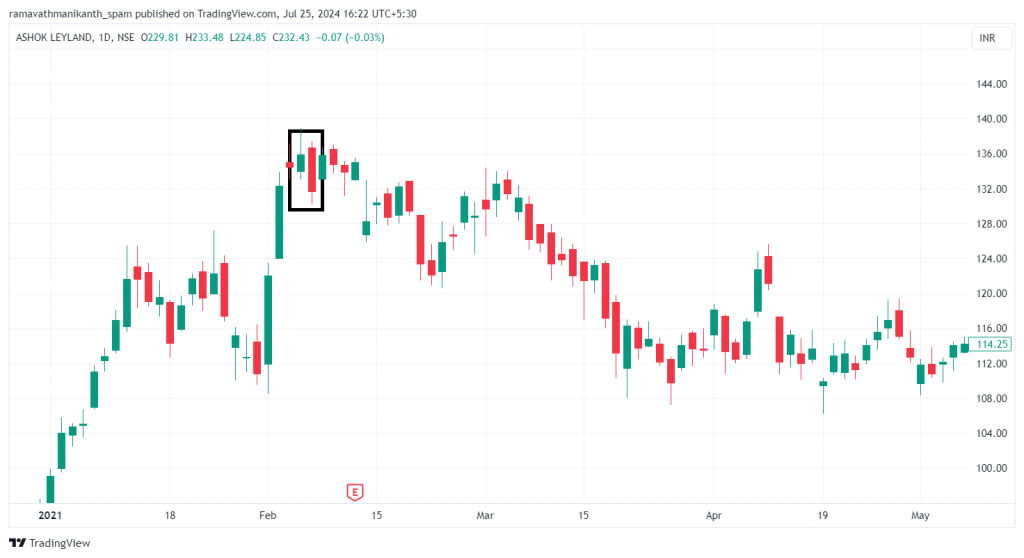
- Entry: Enter the trade at the opening of the next candle, which is 176.40.
- Stop Loss: Set the stop loss at the high of the bearish engulfing candle, which is 177.00.
- Target: Aim for a target with a risk-to-reward ratio of 1:1.5 based on the entry price.
Harami Pattern
Harami’ in Japanese means ‘pregnant’. Being a two-candlestick pattern, the first candle is significant and reflects strong market sentiment, either bullish or bearish, depending on the current trend. The second candle is smaller and has its body completely engulfed within the first candle’s body, indicating a potential reversal in the trend.
The below image shows a harami candlestick pattern.
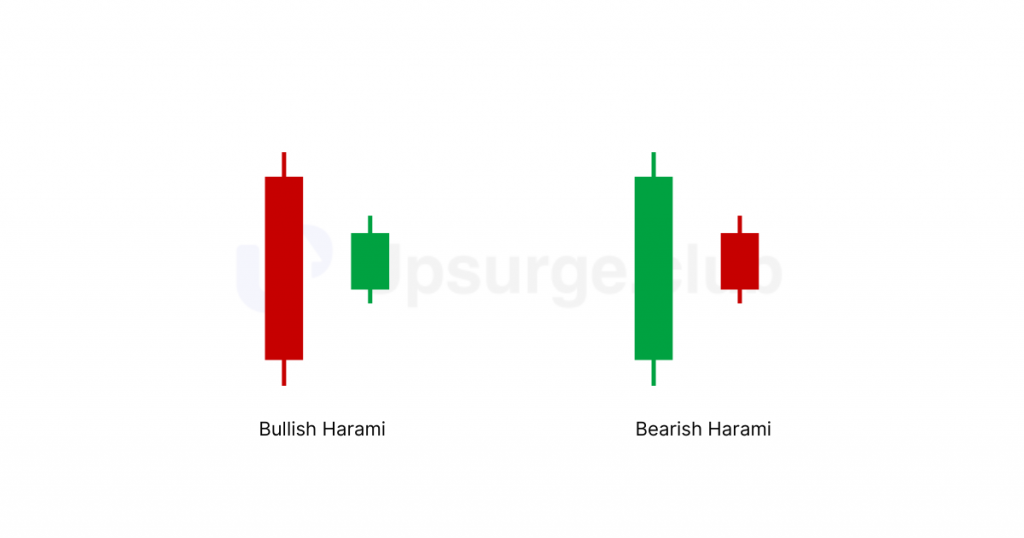
Here, you can see that the previous candle completely covers the second candle. Now, let’s talk about both harami candlestick patterns – bullish harami and bearish harami.
Bullish Harami Pattern
How does a bullish harami pattern form?
The harami pattern is a potential reversal signal that signifies a change in market sentiment.
The pre-requisites for a bullish harami pattern are:
- The prior trend should be a downtrend.
- The first candle should be bearish, confirming the bearishness in the market.
- The second candle should be bullish and small, fitting within the body of the first red candle.
Here is the formation of a bullish harami candlestick pattern, forming at the bottom of a downtrend.
The psychology behind a bullish harami candlestick pattern is:
- Initially, the market was in a downtrend, dominated by sellers, which was reflected by the large bearish (red) candle.
- The sizeable bearish candle confirms the ongoing bearish sentiment in the market.
- The following day, a smaller bullish (green) candle forms within the body of the previous red candle.
- This smaller candle represents a period of indecision (doji candles can be formed here) where the selling pressure has weakened, and buyers are starting to enter the market.
- The green candle’s appearance suggests buyers are becoming more active, although their presence is not strong enough to reverse the trend completely.
- The pattern indicates that the downtrend might be losing its momentum. If buyers continue to gain strength, a reversal from bearish to bullish could be on the horizon.
How to trade a bullish harami pattern?
With an understanding of the bullish harami candlestick pattern, let’s talk about trading it. This pattern suggests a bullish reversal, so look for buying opportunities in the stock.
- Entry: Buy when the price moves above the high of the second (green) candle.
- Confirmation: For added assurance, wait for the next candle (third candle) to close higher than the high of the first (bearish) candle.
- Stop loss: Place the stop loss just at the low of the second (green) candle to protect yourself if the pattern doesn’t work out.
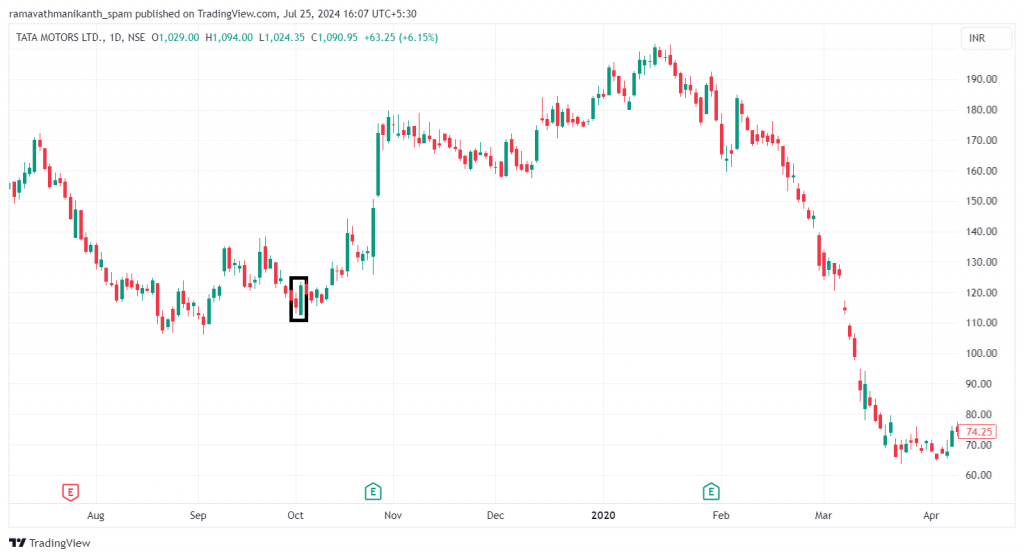
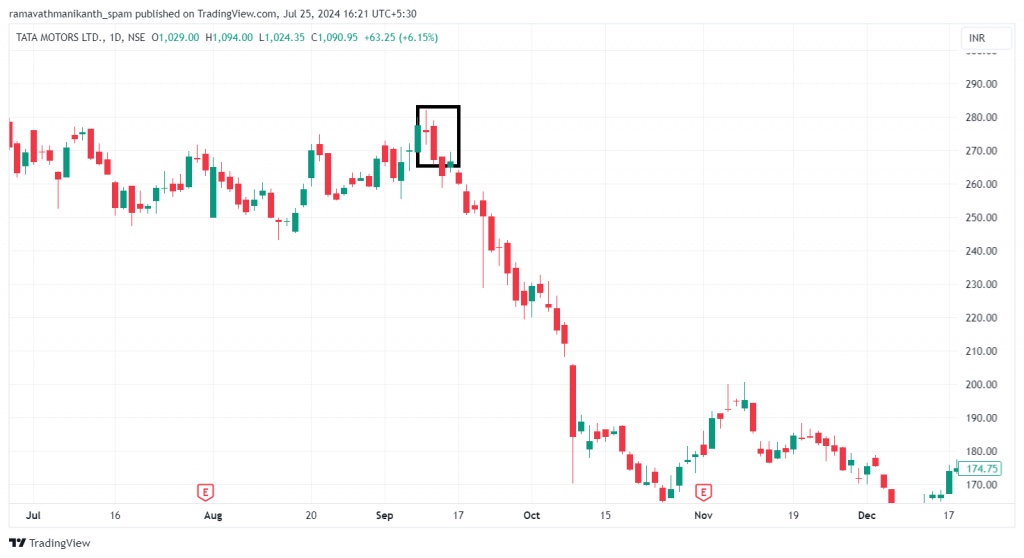
Let’s look at an example in Tata Motors.
The OHLC data of the above candlesticks are:
First candle:
Open = 414.50
High = 414.50
Low = 400.40
Close = 409.20
Second candle:
Open = 401.60
High = 410.60
Low = 401.40
Close = 409.60
You can see that the first candlestick does not entirely cover the low of the second candle. But remember that we need to be flexible!
Hence, here’s how we would trade:
Entry Point: 410.60
Stop Loss: 401.40
To gain more confidence in the bullish harami pattern, watch for the third candle. For a more decisive confirmation, the third candle should be bullish. You can initiate a trade setup if the third candle closes above the high of the first candle, i.e., above 414.50. Set your stop loss at the low of the first candle.
Now, let’s look at the bearish harami pattern, which works just the opposite of the bullish harami pattern.
Bearish Harami Pattern
How does a bearish harami pattern form?
It is a potential bearish reversal candle, and the pre-requisites for a bearish harami candlestick pattern are:
- The prior trend should be an uptrend.
- The first candle should be bullish, indicating bullishness in the market.
- The second candle should be bearish and small enough to be contained within the body of the first candle.
The psychology behind the formation of bearish harami candlesticks is as follows:
- The market is in an uptrend, dominated by buyers.
- A large bullish (green) candle confirms the ongoing bullish sentiment.
- The following day, a smaller bearish (red) candle forms within the body of the previous green candle.
- This smaller red candle represents a period of indecision (Doji candles can form here), indicating that the buying pressure has weakened and sellers are starting to enter the market.
- The new small bearish candle suggests that sellers are becoming more active, though their presence still needs to be more robust to reverse the trend completely.
- The pattern indicates that the uptrend might be losing momentum.
- If sellers continue to gain strength, a reversal from bullish to bearish could be on the horizon.
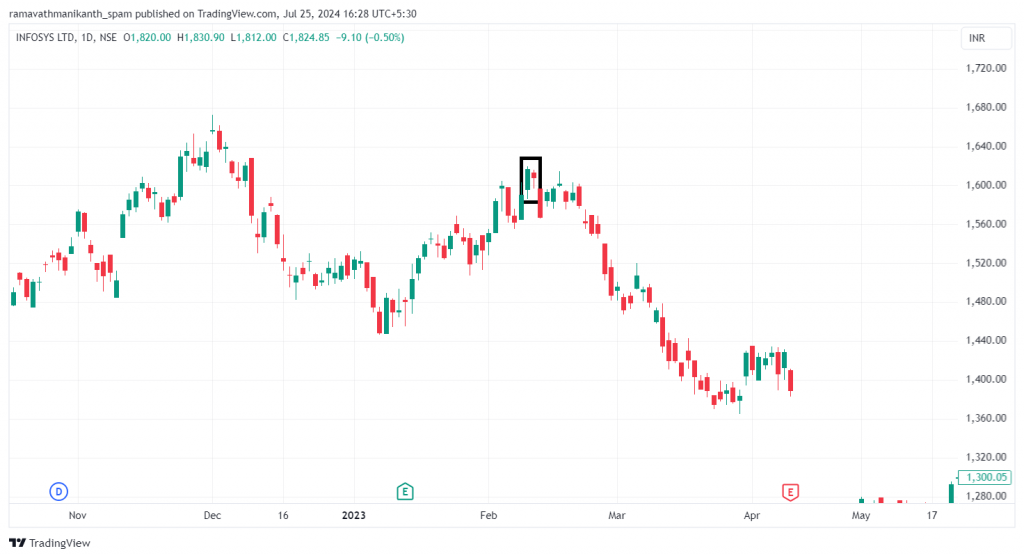
The image of a bearish harami, seen forming at the top of an uptrend in the price chart of Infosys:
How to trade a bearish harami pattern?
- Entry: Sell when the price moves below the low of the second (red) harami candle.
- Confirmation: For added assurance, wait for the next candle (third candle) to close lower than the low of the first (bullish) candle.
- Stop Loss: Place the stop loss at the high of the second (red) harami candle to protect yourself if the pattern doesn’t work out.
Now, let’s look at another exciting double candlestick pattern!
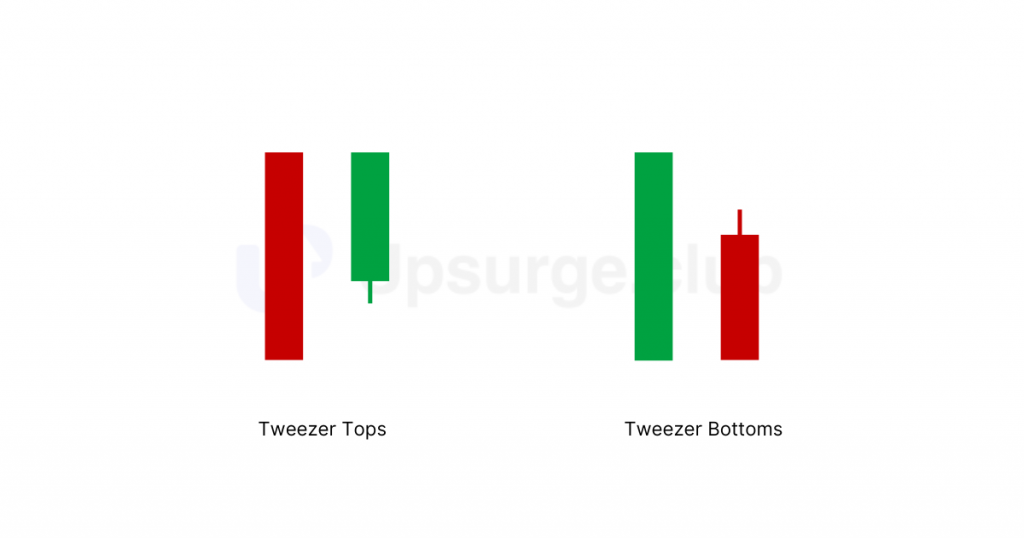
Tweezer Tops and Tweezer Bottoms
These consist of two consecutive candles with matching highs (tweezer top) or matching lows (tweezer bottom). Here’s how they look:
Let’s take a closer look at each one of them.
Tweezer Bottoms Pattern
How is a tweezer bottom formed?
It is a potential bullish reversal pattern, called a tweezer bottom, because it is found after a downtrend. The pre-requisites for a tweezer bottom candlestick pattern are:
- The prior trend should be a downtrend.
- The first candle should be bearish (red), confirming the bearishness in the market.
- The second candle should be bullish, and have a low that matches or is very close to the low of the first red candle.
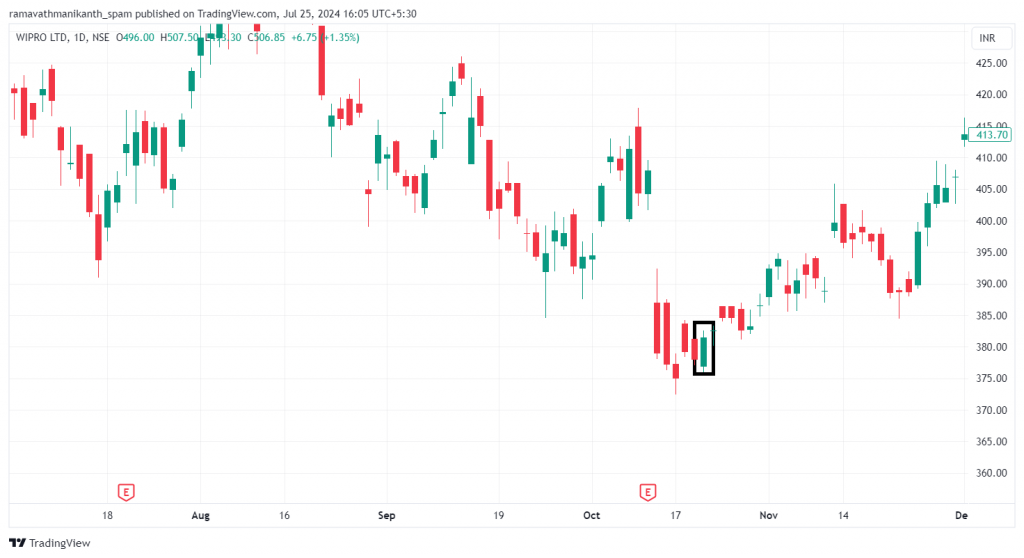
Let’s examine the tweezer bottom pattern, which forms at the bottom of a downtrend of Infosys stock, for a better understanding.
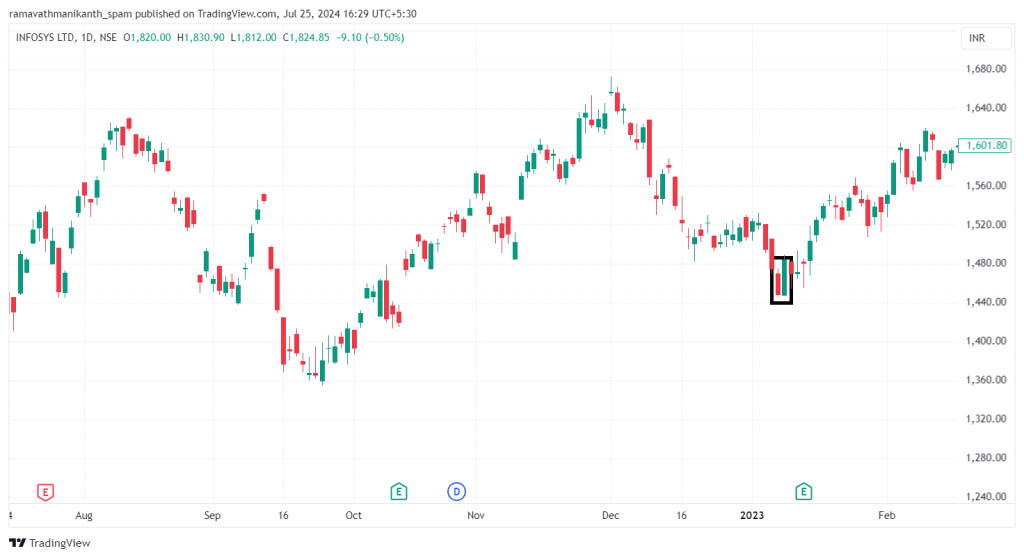
As you can see in the above chart, Infosys stock rallied significantly after the formation of the tweezer bottom. This pattern, formed after a downtrend with both candles having similar lows, indicates a potential bullish reversal.
What does the tweezer bottom tell us?
- Initially, the market was in a downtrend, dominated by sellers, as shown by the large bearish (red) candle. This sizeable bearish candle confirms the ongoing negative sentiment in the market.
- The next day, a bullish (green) candle forms with a low that matches or is very close to the low of the previous red candle. This matching low suggests that the selling pressure is weakening, and buyers are starting to step in.
- The green candle’s appearance indicates buyers are becoming more active, although their presence still needs to be stronger to reverse the trend completely.
- This pattern signals that the downtrend might be losing its momentum if buyers continue to gain strength.
Let’s look at how to trade tweezer bottom.
How to trade a tweezer bottom?
Now that you understand the tweezer bottom candlestick pattern, let’s discuss how to trade it. This pattern shows a potential bullish reversal, so it’s a good time to look for buying opportunities in the stock.
- Entry: Buy when the price moves above the high of the second (green) candle.
- Confirmation: Make sure the next (third) candle closes higher than the high of the second (green) candle to confirm the reversal.
- Stop Loss: Place the stop loss just below the low of the second (green) candle to protect yourself if the pattern doesn’t work out.
Now, let’s discover the tweezer top double candlestick pattern.
Tweezer Tops Pattern
How does a tweezer top get formed?
Converse to a tweezer bottom, a tweezer top is formed after an uptrend. The pre-requisites for the formation of a tweezer top are:
- The prior trend should be an uptrend.
- The first candle should be bullish, confirming the bullishness in the market.
- The second candle should be bearish, and have a high that matches or is very close to the high of the first candle.
Let’s understand with an example.
In the above chart, you can see they are formed in an uptrend; the OHLC of the above candlesticks are:
First candle:
Open = 1553
High = 1575
Low =1547
Close =1573
Second candle:
Open = 1572
High = 1572
Low =1545
Close =1553
We can see the high prices of both candles match, confirming the tweezer top candlestick pattern.
The psychology behind the formation of the tweezer top is as follows:
- Initially, the market was in a downtrend, dominated by sellers, shown by a large bearish (red) candle.
- The next day, a bullish (green) candle forms with a low matching or very close to the previous red candle’s low, indicating weakening selling pressure.
- This matching low suggests that buyers are starting to step in, though not yet strong enough to reverse the trend completely.
- The pattern signals that the downtrend might be losing momentum.
If buyers continue to gain strength, a reversal from bullish to bearish could be on the horizon.
How to trade a tweezer top?
- Entry: Sell when the price moves below the low of the second (red) candle.
- Confirmation: Make sure the next candle closes lower than the low of the second (red) candle to confirm the reversal.
- Stop Loss: To protect yourself if the pattern doesn’t work out, place the stop loss at the high of the second (red) candle.
Now that you’ve got the hang of interpreting and trading single and two-candlestick patterns, let’s move on to multi-candlestick patterns.
Chapter 6: Multiple Candlestick Patterns
Continuing from the previous chapter on double candlesticks, where we discussed engulfing, harami, and other patterns that help us enter the market, we now move on to multiple candlestick patterns. These patterns involve analyzing three or more candlesticks, but we will focus on just three candlesticks to understand the market direction better.
You might wonder why it is necessary to analyze three candlesticks. The reason is simple: the more candlesticks, the more solid and reliable the trend.
In this chapter, we will explore patterns like morning and evening stars, three black crows and soldiers, three inside up and down, and three rising and falling methods. These patterns give us a clearer picture of the market and help us make better trading decisions.
Let’s look at the first multiple candlestick pattern, the morning star.
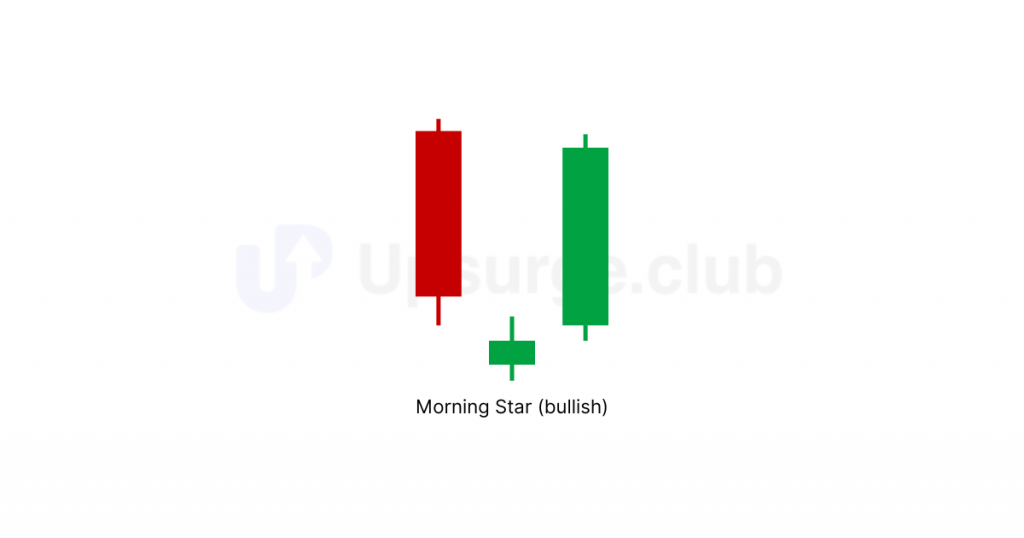
Morning Star
How is a morning star pattern formed?
A bullish candlestick pattern generally formed at the bottom of a downtrend, the morning star consists of three candlesticks.
To improve our understanding, we will denote the first candle as C1, the second candle as C2, the third candle as C3, and so on.
- The first candle (C1) is bearish, with the closing price near the previous candle’s low.
- The second candle (C2) is a doji, having a negligible body. It should form below the low of the first candle
- The third candle (C3) should be bullish and close higher than the high of the first candle (C1), like a bullish engulfing candle.
Here’s a pictorial representation of the same:
Let’s break down the same.
- The market is in a downtrend, with the bears in control, forming successive new lows.
- On day 1 (C1), the market forms a long red candle, showing selling acceleration.
- On day 2 (C2), the market forms a doji or spinning top, indicating indecision and causing restlessness among the bears who expected another down day.
- On day 3 (C3), a green candle forms, closing above C1’s red candle opening.
Buying persists throughout C3, recovering all losses of C1. - The bullishness on C3 will likely continue, suggesting buying opportunities in the market.
How to trade a morning star pattern?
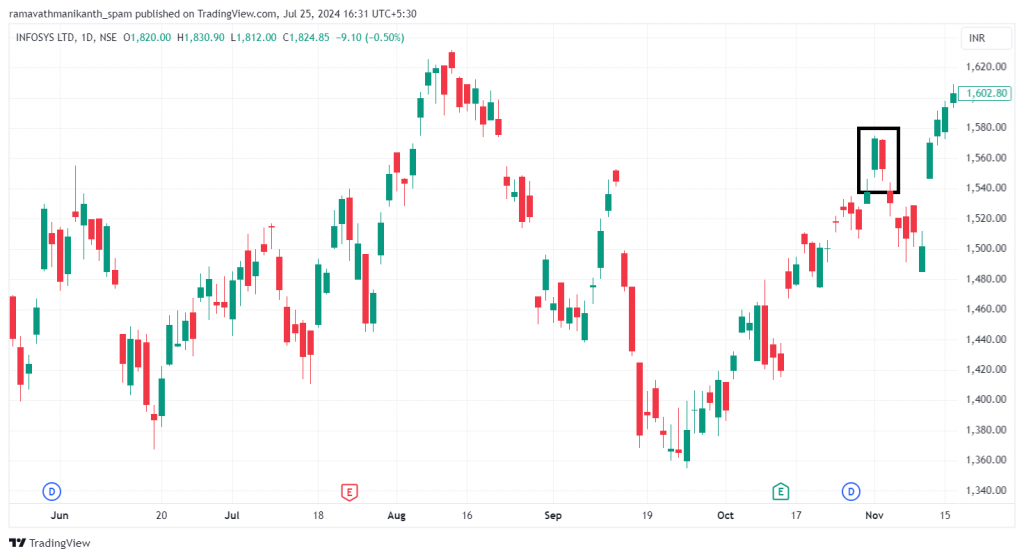
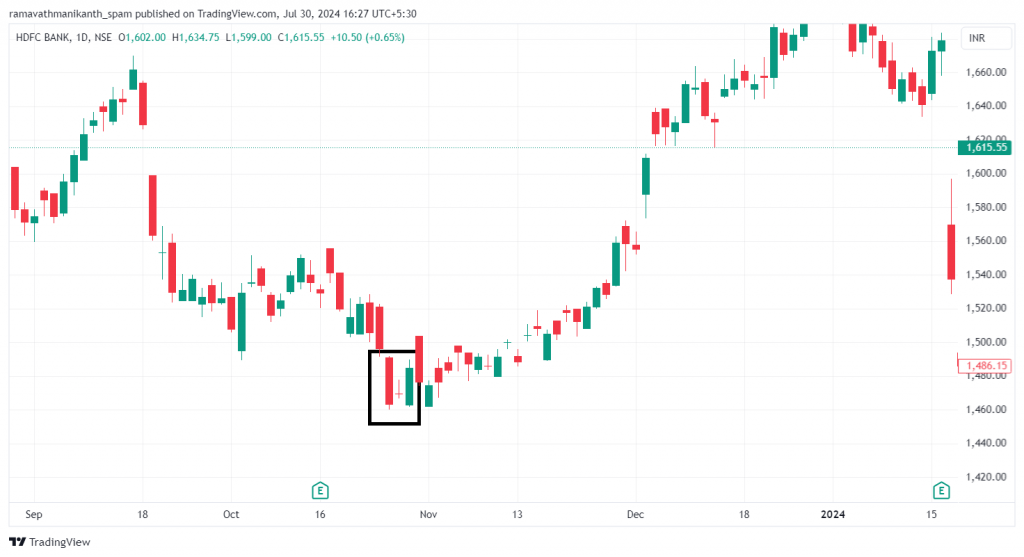
The three characteristics of a morning star are found in the HDFC Bank chart below.
Here’s how to trade it.
- Entry: Enter a long position at the candle’s opening that forms after the morning star pattern.
- Confirmation: A morning star is more reliable in a downtrend if C3 (the green candle) closes above the midpoint of C1 (the red candle), indicating a potential bullish reversal.
- Stop Loss: Place a stop loss at the low of C2 (the doji) to limit potential losses if the trade goes against you.
Let’s now move on to the evening star.
Evening Star
How is an evening star pattern formed?
This candlestick pattern signifies a potential bearish reversal, often forming at the end of an uptrend. It indicates that buyers have lost control and bears have made their entry. It also consists of 3 candlesticks.
Here’s how it is constructed:
- The first candle (C1) is bullish, with the closing price near the previous candle’s high.
- The second candle (C2) is a doji with a negligible body, indicating indecision. This forms above C1.
- The third candle (C3) is bearish and closes lower than the first candle (C1), similar to a bearish engulfing candle.
Here is a pictorial representation of the same:
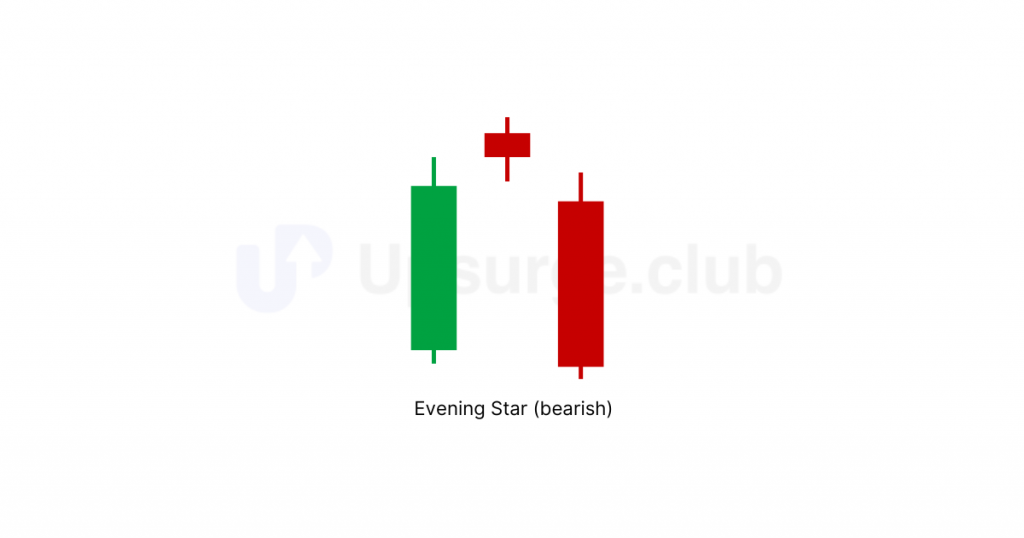
Let’s look at the psychology behind the formation of an evening star pattern.
- The market is in an uptrend, with the bulls in control and successive new highs.
- On day 1 (C1), the market forms a long green candle, showing buying acceleration.
- On day 2 (C2), the market forms a doji, signaling indecision and causing restlessness among the bulls who expected another up day.
- On day 3 (C3), a red candle forms, closing below C1’s green candle opening.
Selling persists throughout C3, erasing all gains of C1. - The bearishness on C3 will likely continue, suggesting selling opportunities in the market.
How to trade an evening star pattern?
Here is a picture of the evening star pattern forming on the daily chart of Ashok Leyland, making it clearer:
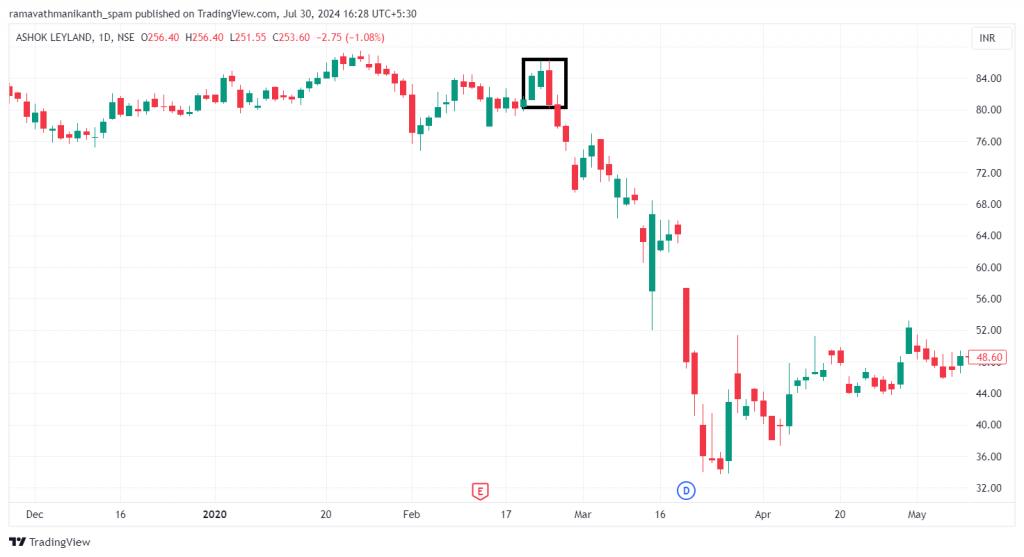
As you can see, after the formation of the evening star, Ashok Leyland stock has faced a significant downtrend. Here’s how one can trade it:
- Entry: Enter a short position at the candle’s opening that forms after the evening star pattern.
- Confirmation: An evening star is more reliable in an uptrend if C3 (the red candle) closes below the midpoint of C1 (the green candle), indicating a potential bearish reversal.
- Stop Loss: Place a stop loss above the high of C2 (the doji) to limit potential losses if the trade moves against you.
Three Black Crows
How is the three black crows pattern formed?
The three black crows pattern is a bearish reversal pattern formed when bearish forces come into action and cause prices to fall for three consecutive days.
Pre-requisites for the formation of three black crows are:
- The first candle (C1) is bearish, with the closing price near the previous candle’s low.
- The second candle (C2) is also bearish, opening within the body of C1 and closing lower, indicating continued selling pressure.
- The third candle (C3) is also bearish, opening within the body of C2 and closing lower, confirming the bearish reversal and strong presence of sellers.
Hence, it is named three black crows because the three bearish candles resemble three ominous crows in a row, indicating increasing selling pressure. Here is a pictorial representation of the same:
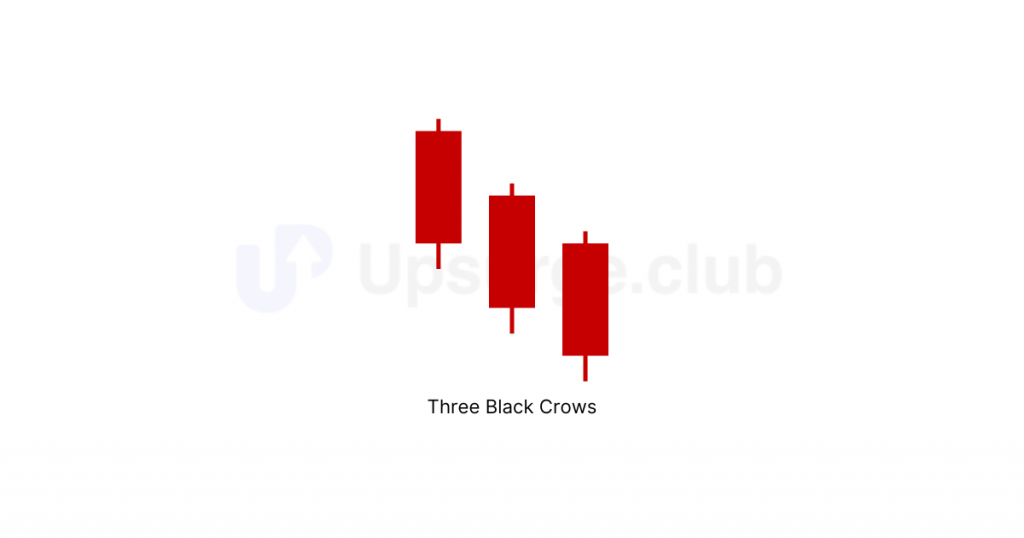
Sentiment behind the formation of three black crows:
- The market is in an uptrend, with the bulls in control and successive new highs.
- On day 1 (C1), the market forms a long red candle, signaling a strong shift in sentiment.
- On day 2 (C2), another bearish candle forms, opening within C1’s body and closing lower, indicating continued selling pressure.
- On day 3 (C3), a third bearish candle forms, opening within C2’s body and closing near its low, confirming the bearish reversal.
Selling persists throughout C3, erasing gains from the uptrend. - The bearishness suggested by the three black crows pattern will likely continue, indicating selling opportunities in the market.
Let’s uncover how to trade the three black crows.
How to trade the three black crows pattern?
Here’s how this pattern can be traded:
- Entry: Enter a short position at the candle’s opening (C4) that forms after the three black crows pattern.
- Confirmation: The three black crows pattern is more reliable if the third red candle (C3) closes near its low, indicating strong bearish momentum.
- Stop Loss: Place a stop loss above the high of C1 (the first red candle) to limit potential losses if the trade moves against you.
You can notice the pattern forming on the daily chart of HDFC Bank:
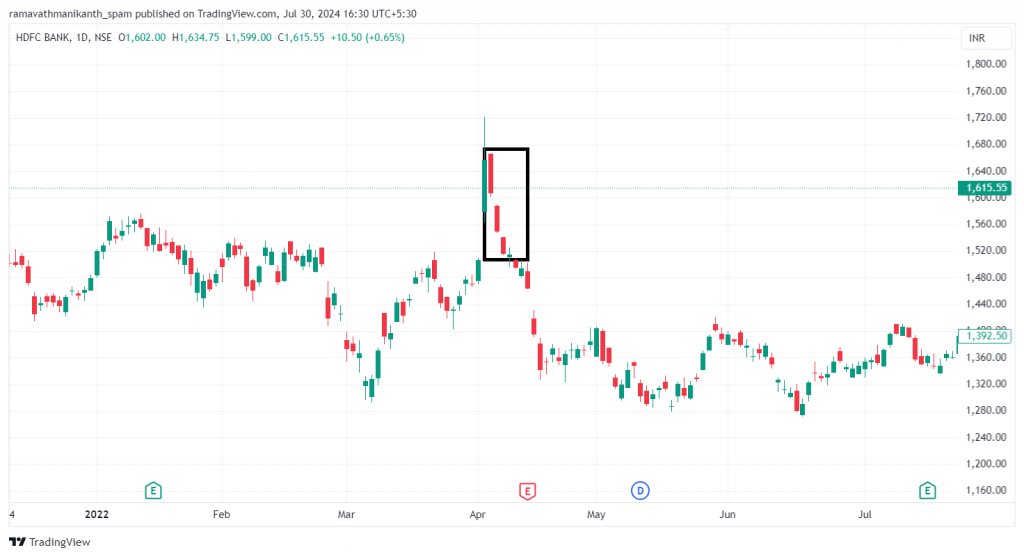
OHLC of the candle are:
Data | Open | High | Low | Close |
First candle | 1666 | 1666 | 1602 | 1608 |
Second candle | 1557 | 1589 | 1547 | 1550 |
Third candle | 1541 | 1541 | 1513 | 1516 |
Based on the above data
- Entry: Enter a short position just after the third candle (C3).
- Confirmation: We have confirmation from the three black crows pattern formed in an uptrend.
- Stop Loss: Place a stop loss above the high of the first candle (C1), at 1666.
Three White Soldiers
How is the three white soldiers pattern formed?
This multiple candlestick pattern, also known as three advancing white soldiers, helps predict a reversal from a downtrend to an uptrend. It is often found after a long downtrend, changing market sentiment to bullish.
The pre-requisites for the formation of this pattern are:
- The first candle (C1) is bullish, with the closing price near the previous candle’s high.
- The second candle (C2) is also bullish, opening within the body of C1 and closing higher, indicating continued buying pressure.
- The third candle (C3) is bullish as well, opening within the body of C2 and closing higher, confirming the bullish reversal and strong presence of buyers.
Here is a pictorial representation of the same:
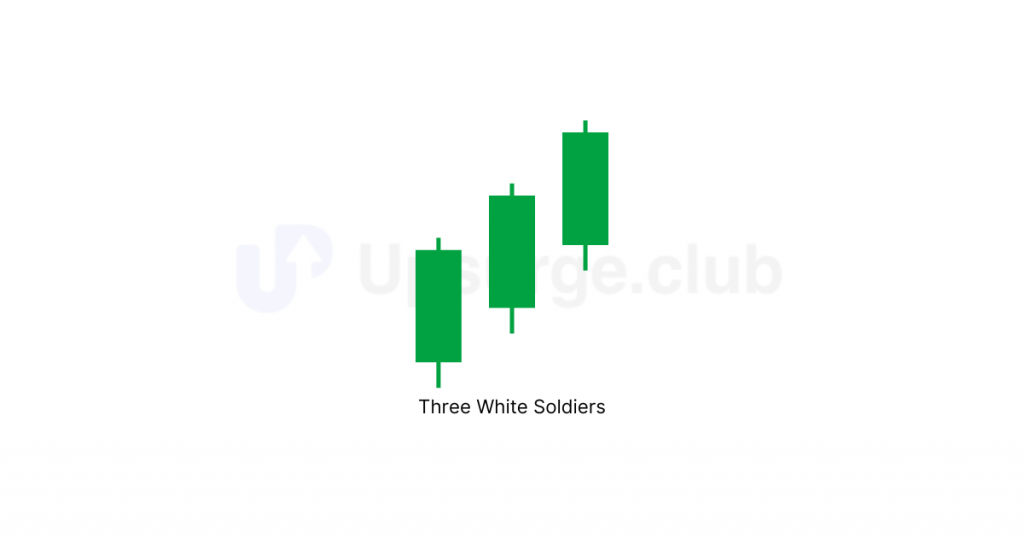
Market sentiment driving the formation of three white soldiers:
- The market is in a downtrend, with the bears in control and successive new lows.
- On day 1 (C1), the market forms a long green candle, signaling a strong shift in sentiment.
- On day 2 (C2), another bullish candle forms, opening within C1’s body and closing higher, indicating continued buying pressure.
- On day 3 (C3), a third bullish candle forms, opening within C2’s body and closing near its high, confirming the bullish reversal.
- Buying persists throughout C3, reversing losses from the downtrend.
- The bullishness suggested by the three white soldiers pattern will likely continue, indicating buying opportunities in the market.
Let’s learn how to trade this multiple-candlestick pattern.
How to trade the three white soldiers pattern?
Here’s how a trade can be taken:
- Entry: Enter a long position at the candle’s opening (C4) that forms after the three white soldiers pattern.
- Confirmation: The three white soldiers pattern is more reliable if the third green candle (C3) closes near its high, indicating strong bullish momentum.
- Stop Loss: Place a stop loss below the low of C1 (the first green candle) to limit potential losses if the trade moves against you.
Three Inside Up
How is the three inside up pattern formed?
The three inside up is a type of reversal pattern. This pattern requires a specific sequence of individual candles, indicating that the current trend has lost momentum and is likely to change direction.
How is the three inside up pattern formed?
The pre-requisites for the formation of three inside up pattern are:
- The pattern is typically found at the bottom of a downtrend.
- The first candle (C1) is bearish, with the closing price near the previous candle’s low.
- The second candle (C2) is bullish, opening within the body of C1 and closing above 50% of C1’s body length, indicating a potential shift in momentum.
- The third candle (C3) is bullish as well, opening within the body of C2 and closing higher, confirming the bullish reversal and strong presence of buyers.
Here is an image of the three inside up candlestick pattern:
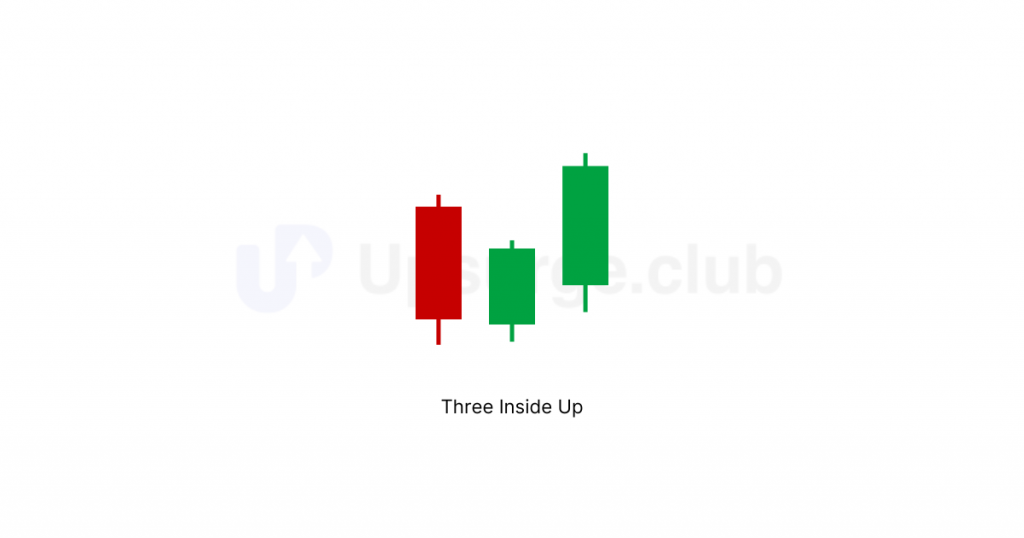
The psychology behind the formation of three inside up:
- The market is in a downtrend, with the bears in control and successive new lows.
- On day 1 (C1), the market forms a long red candle, maintaining a bearish sentiment.
- On day 2 (C2), a bullish candle forms, opening within C1’s body and closing above its midpoint, signaling a potential shift in momentum.
- On day 3 (C3), another bullish candle forms, opening within C2’s body and closing higher, confirming the bullish reversal.
- Buying persists throughout C3, reversing losses from the downtrend.
- The bullishness suggested by the three inside up is likely to continue.
How to trade the three inside up pattern?
Since it’s a bullish reversal candlestick, we should look for buying opportunities in the market. The trade setup will look like this:
- Entry: Enter a long position at the candle’s opening (C4) that forms after the three inside up pattern.
- Confirmation: The three inside up pattern is more reliable if the third green candle (C3) closes near its high, indicating strong bullish momentum.
- Stop Loss: Place a stop loss below the low of C1 (the first red candle) to limit potential losses if the trade moves against you.
Here is a formation of the three inside up candlestick pattern on the daily chart of Wipro:
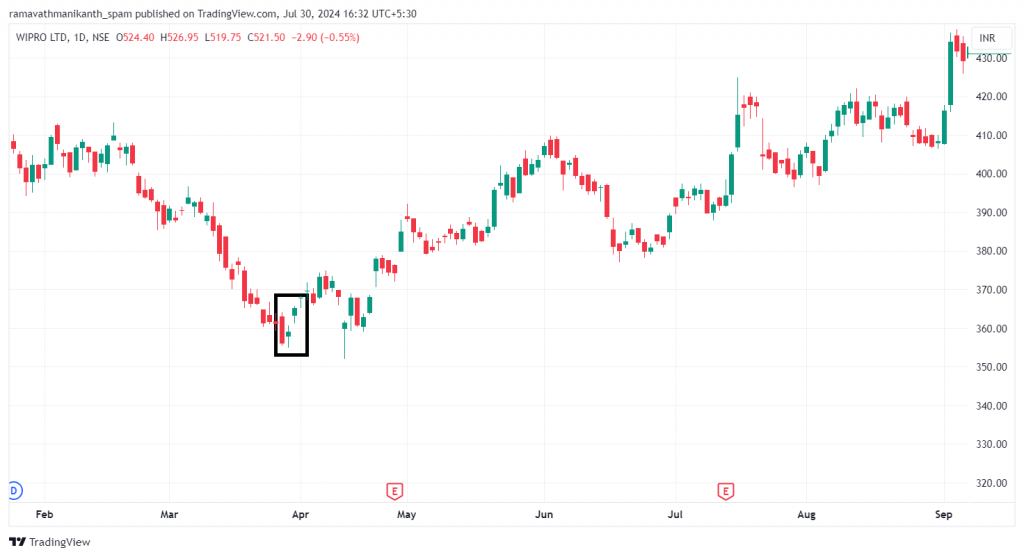
First, the stock was in a downtrend. After that, the three inside up pattern are formed: the middle candle, C2, managed to cover half of C1, and the third candle closed above the first candle, C1.
OHLC data of the above is as follows:
Data | Open | High | Low | Close |
First candle | 363 | 364 | 355 | 356 |
Second candle | 358 | 360 | 355 | 359 |
Third candle | 363 | 365 | 361 | 365 |
Here’s how it can be traded:
- Entry: Enter a long position just after the third candle (C3), i.e., on the candle forming after C3.
- Confirmation: For a stronger confirmation of the trend change, you can wait for the candle after C3 to open higher than C3.
- Stop Loss: Place a stop loss below the low of the first candle (C1), which is 355.
Three Inside Down
How is the three inside down pattern formed?
The opposite of the three-inside-up candlestick pattern is the three-inside-down pattern, which forms after an uptrend and is a potential bearish reversal pattern.
The pre-requisites for the formation of three inside down are:
- The pattern is typically found at the top of an uptrend.
- The first candle (C1) is bullish, with the closing price near the previous candle’s high.
- The second candle (C2) is bearish, opening within the body of C1 and closing below 50% of C1’s body length, with a body twice the size of C1.
- The third candle (C3) is bearish as well, opening within the body of C2 and closing lower.
Here is a pictorial representation:
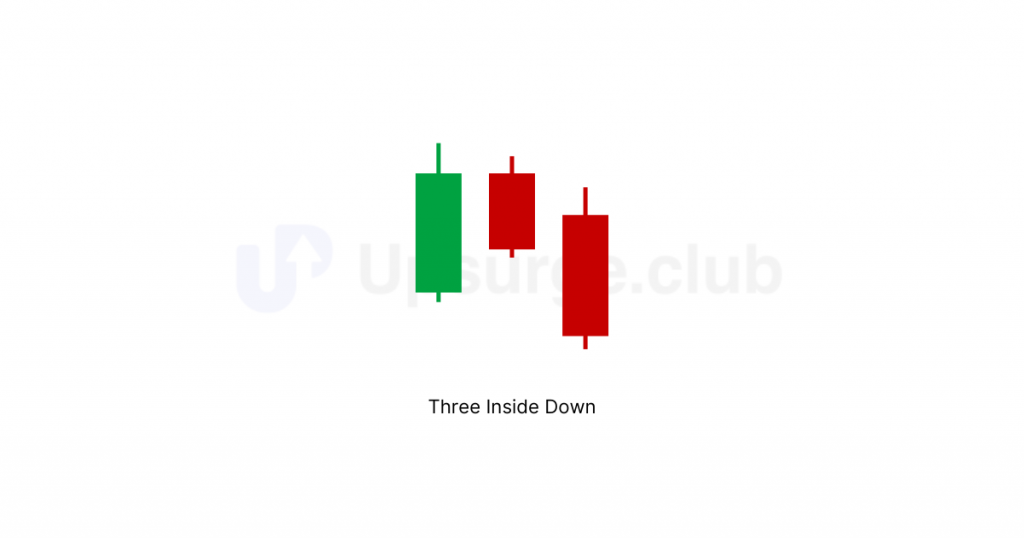
Market sentiment driving the formation of the three inside down pattern:
- The market is in an uptrend, with the bulls in control and successive new highs.
- On day 1 (C1), the market forms a long green candle, signaling a strong bullish sentiment.
- On day 2 (C2), a bearish candle forms, opening within C1’s body and closing lower, indicating a shift in sentiment.
- On day 3 (C3), a second bearish candle forms, opening within C2’s body and closing near its low, confirming the bearish reversal.
- Selling persists throughout C3, reversing gains from the uptrend.
- The bearishness suggested by the three inside down is likely to continue.
How to trade the three inside down pattern?
Given the bearish reversal indicated by the three inside down pattern, traders should consider potential short-selling opportunities. The trading setup will look like this:
- Entry: Enter a short position at the candle’s opening (C4) that forms after the three inside down pattern.
- Confirmation: The three inside down pattern is more reliable if the third red candle (C3) closes near its low, indicating strong bearish momentum.
- Stop Loss: Place a stop loss above the high of C1 (the first green candle) to limit potential losses if the trade moves against you.
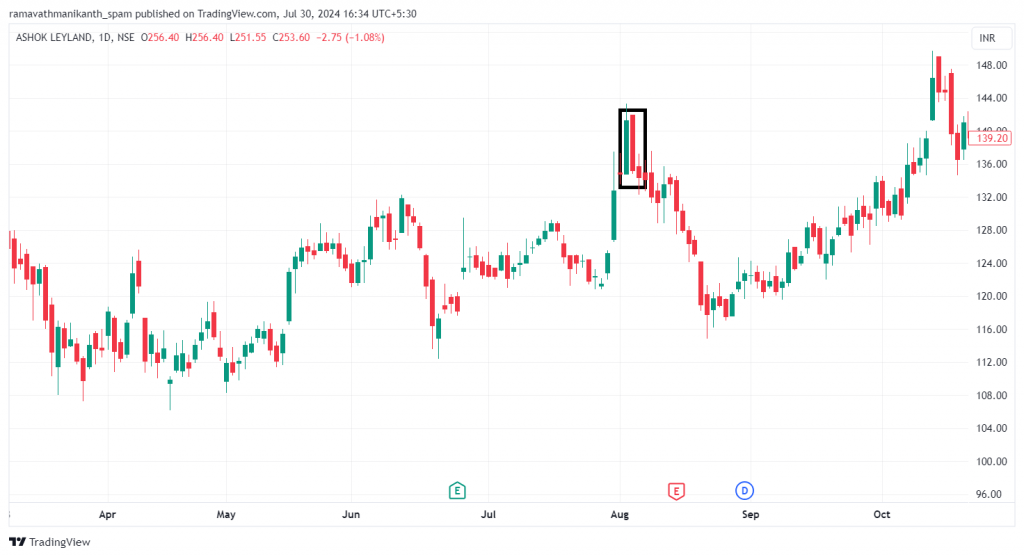
As you can see from the above chart, the second candle, C2, is closing more than 50% of the first candle, C1, indicating strong selling momentum. Hence, we should look out for shorting opportunities.
Now, let’s look at the rising three methods & falling three methods candlestick patterns.
Rising Three Methods
How is the rising three methods pattern formed?
We have seen many reversal candlestick patterns up until now. However, the rising three methods pattern is a bullish continuation pattern. This means the current uptrend is likely to continue in the near future. Consisting of five candlesticks, this pattern supports the ongoing trend instead of signaling a reversal.
The pre-requisites for formation are:
- The pattern is typically found in the middle of an uptrend.
- The first candle (C1) is bullish, with a strong upward move.
- The second, third, and fourth candles (C2, C3, and C4) are small bearish candles, staying within the range of C1.
- The fifth candle (C5) is bullish again, closing above the high of C1, confirming the continuation of the uptrend.
Here is a pictorial representation of the rising three methods pattern. This pattern contains five candlesticks, as you can see below:
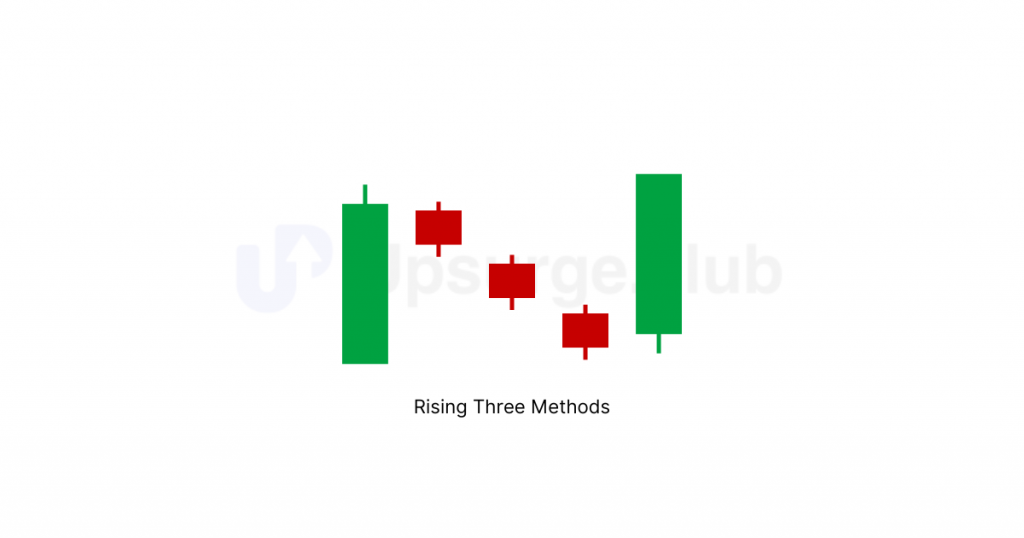
The mindset that creates the rising three methods:
- The market is in an uptrend, with the bulls in control and successive new highs.
- On day 1 (C1), the market forms a long green candle, signaling strong bullish sentiment.
- On day 2 (C2), a small bearish candle forms, opening within C1’s body and closing lower, indicating a temporary pause in the uptrend.
- On day 3 (C3), another small bearish candle forms, opening within C2’s body and closing lower, maintaining the pause in bullish momentum.
- On day 4 (C4), a third small bearish candle forms, opening within C3’s body and closing lower, continuing the pause.
The bullishness suggested by the rising three methods pattern is likely to continue. The small candlesticks between the two long bullish candlesticks are typically indecision candles, indicating a temporary pause in the uptrend before it resumes. All the small candles don’t need to be bearish; what matters is that they have small bodies and close below the previous candle’s close.
Let’s look at how we can trade the rising three methods pattern.
How to trade the rising three methods pattern?
We should focus on buying opportunities with the rising three methods being a bullish continuation pattern. The trade setup will look like this:
- Entry: Enter a long position at the candle’s opening (C6) that forms after the rising three methods pattern.
- Confirmation: The rising three methods pattern is more reliable if the fifth green candle (C5) closes near its high, indicating strong bullish momentum.
- Stop Loss: Place a stop loss below the low of C2 (the second small bearish candle) to limit potential losses if the trade moves against you.
Look at how the uptrend has continued after the formation of the rising three methods pattern on the chart of Tata Power:
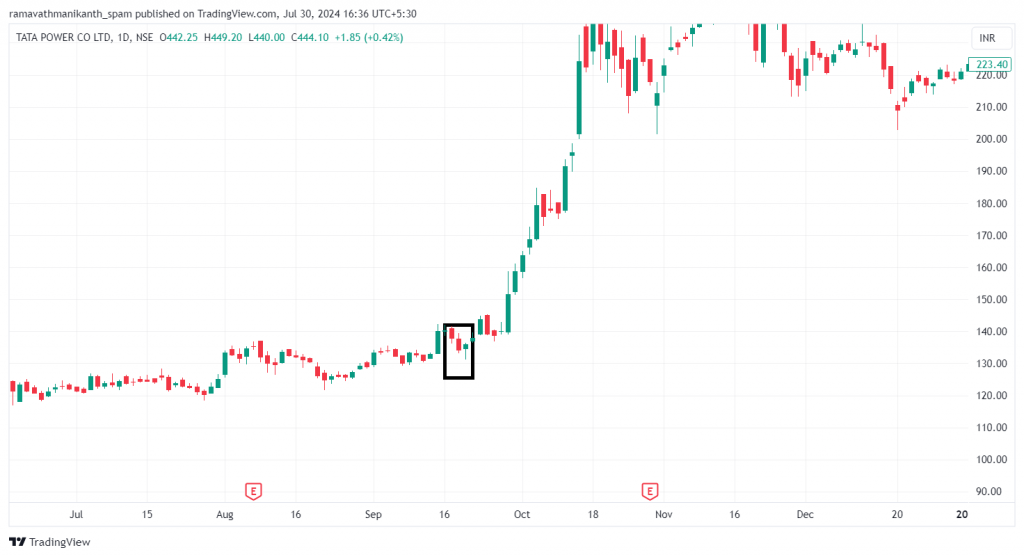
Falling Three Methods
How is the falling three methods pattern formed?
The falling three methods pattern shows a bearish trend. Bulls briefly interrupt with three short bullish candles, causing a pause. However, the bears quickly regain control, and a long bearish candle at the end closes below the first candle, completing the pattern.
The pre-requisites for formation are:
- The pattern occurs within a bearish trend.
- The first candle (C1) is a long red candle, showing strong selling pressure.
- The next three candles (C2, C3, C4) are small green candles confined within the range of C1, indicating a brief pause.
- The fifth candle (C5) is a long red candle that closes below the low of the first candle (C1), confirming the continuation of the bearish trend.
Here’s a pictorial representation:
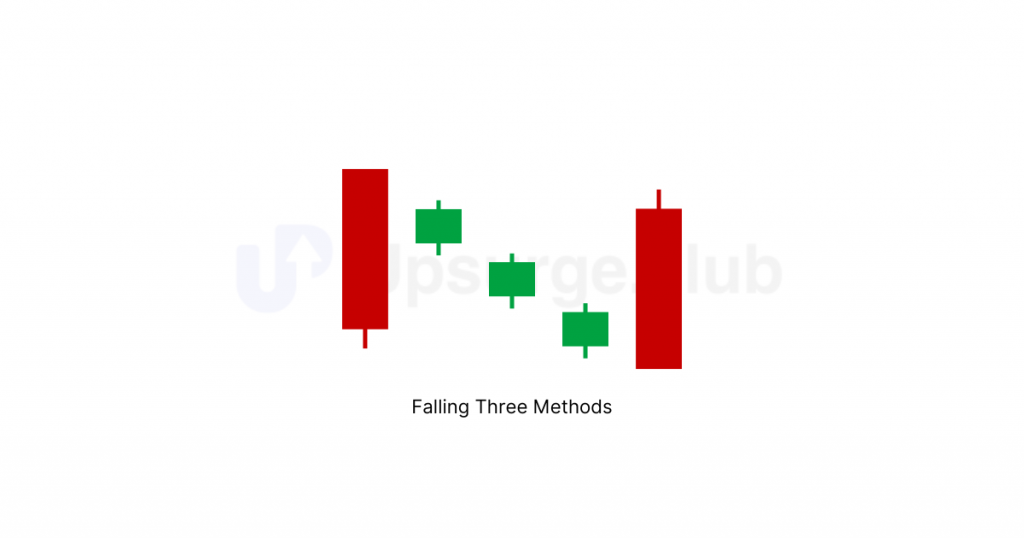
The psychology behind the formation of the falling three-methods pattern works like this: The pattern starts with a strong red candle showing bearish control. Three small green candles follow, representing a brief attempt by bulls to push prices up. However, a final strong red candle indicates the bears have regained control, continuing the downtrend.
How to trade the falling three methods pattern?
A trade using the falling three methods can be taken as follows:
- Entry: Enter a short position at the candle’s opening (C6) that forms after the falling three methods pattern.
- Confirmation: The falling three methods pattern is more reliable if the fifth red candle (C5) closes near its low, indicating strong bearish momentum.
- Stop Loss: Place a stop loss above the high of C2 (the second small green candle) to limit potential losses if the trade moves against you.
Summary
- The morning star is a bullish reversal pattern at the bottom of a downtrend. It consists of a bearish candle, a doji, and a bullish candle.
- The evening star is a bearish reversal pattern at the peak of an uptrend. It has a bullish candle, a doji, and a bearish candle.
- The three black crows pattern has three consecutive bearish candles, indicating a strong bearish reversal after an uptrend.
- The three white soldiers pattern has three consecutive bullish candles, indicating a strong bullish reversal after a downtrend.
- The three inside-up patterns at the bottom of a downtrend involve a bearish candle, followed by a bullish candle closing above its midpoint, and another bullish candle.
- The three inside down patterns at the top of an uptrend involve a bullish candle, followed by a bearish candle closing below its midpoint, and another bearish candle.
- The rising three methods pattern, a bullish continuation pattern, has a long bullish candle, three small bearish candles within its range, and a final bullish candle closing above the first candle’s high.
- The falling three methods pattern, a bearish continuation pattern, has a long bearish candle, three small bullish candles within its range, and a final bearish candle closing below the first candle’s low.
Chapter 7: Support, Resistance, and Dow Theory
Demand and supply are the most essential things in the stock market that drive prices. The fundamentals are that stock prices increase as demand increases and decrease as stock supply increases. How do you identify these levels for any particular stock price?
Concepts of support and resistance are useful here. This chapter will teach us about support and resistance, which will also help set targets and control losses.
We’ll also explore the Dow theory, an old but valuable method of technical analysis used before candlestick charts became popular. Even today, many traders combine ideas from both Dow theory and candlesticks to boost their trading success.
The support zone
As the name suggests, a support zone is a level at which the price stops falling further. Market participants believe that the support zone is the price level at which demand is strong enough to prevent the price from declining further.
The logic behind using a support zone is that as the price declines towards this level and becomes cheaper, participants believe that the stock does not command a lower price. Buyers are more likely to buy, while sellers are less likely to sell. By the time the price reaches the support level, demand is believed to be strong enough to overcome supply, preventing the price from falling further.
Here is an image of a horizontal line acting as a support level for Tata Power, from where the price has bounced back multiple times.
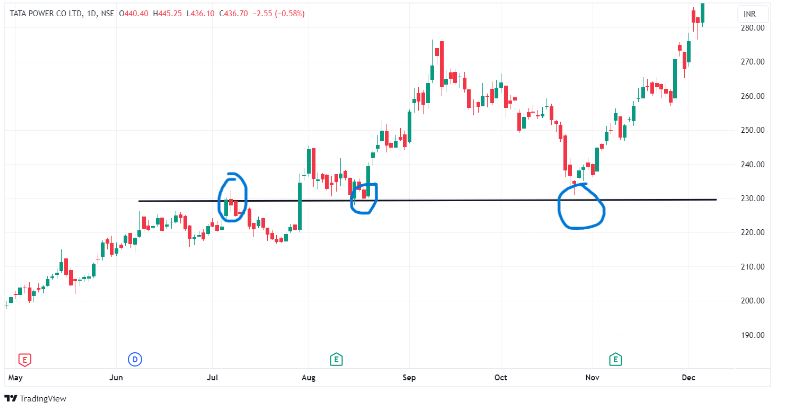
Types Of Support Levels
There are different types of support levels in technical analysis, but the most important are the horizontal support and the trendline support.
A horizontal support is formed by drawing a straight line horizontally that connects several low points on the chart, which hover along the same price. The more times the price touches and rebounds from this level without breaking it, the stronger the support is considered.
Here is an example of horizontal support in the HDFC Bank price chart:
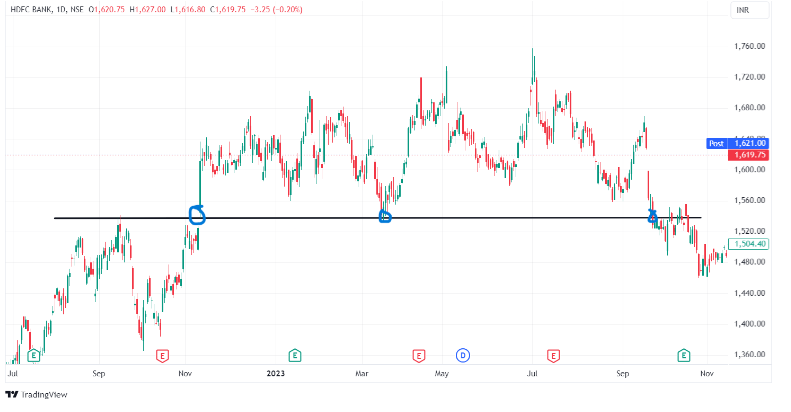
A trendline support is a level where the price stops falling and bounces back up along a diagonal line. It is marked by drawing a straight line that connects several higher lows or lower lows on the chart. This line helps identify the general trend and provides support as long as the price stays above it.
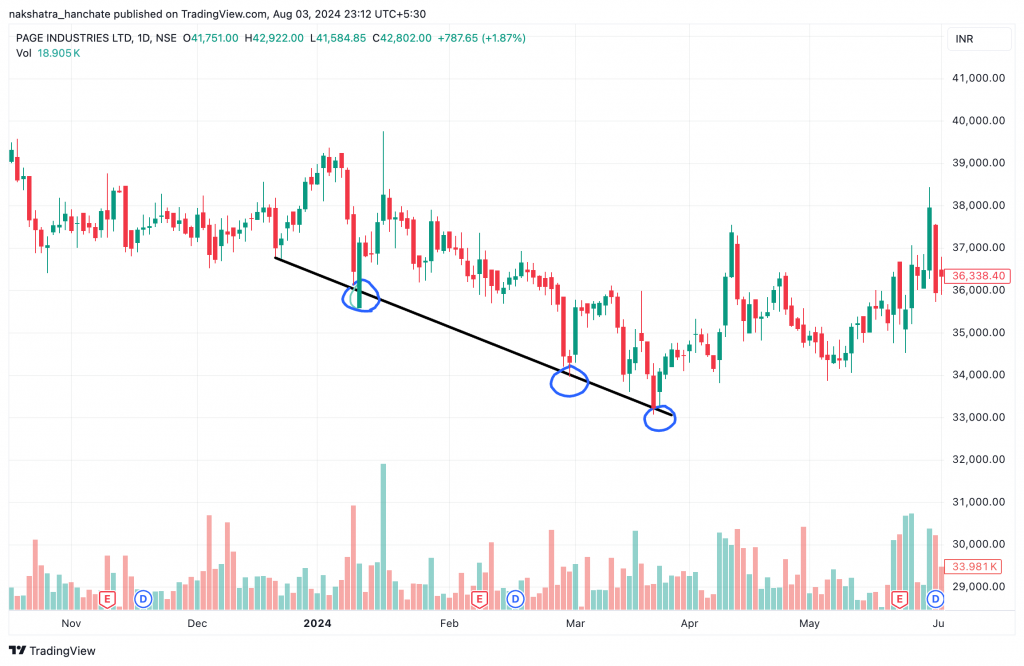
The resistance zone
The resistance zone works conversely to the support zone. It is a level that stops the price from rising further. Market participants believe that the resistance zone is the price level where the supply is strong enough to prevent the price from rising further.
The logic of a resistance zone is that as the price rises and gets more expensive, more sellers are willing to sell, and fewer buyers want to buy. Here is the daily chart of Wipro Ltd. for better understanding:
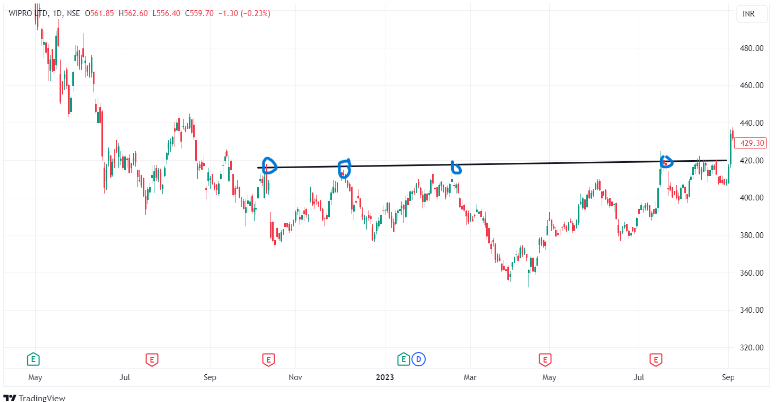
Types Of Resistance Levels
Just like the support levels, there exist two variants: horizontal resistance and trendline resistance.
Horizontal resistance is a level at which the price tends to stop rising and drop back down. It is marked by drawing a straight line horizontally connecting several high points on the chart. The more times the price touches and falls from this level without breaking it, the stronger the resistance is considered.
The above chart of Wipro is an example of horizontal resistance.
A trendline resistance is where the price tends to stop rising and pull back down along a diagonal line. It is marked by drawing a straight line connecting several declining high points (or lower highs) on the chart. This line helps identify the general downward trend and acts as resistance as long as the price stays below it. Here’s an example:
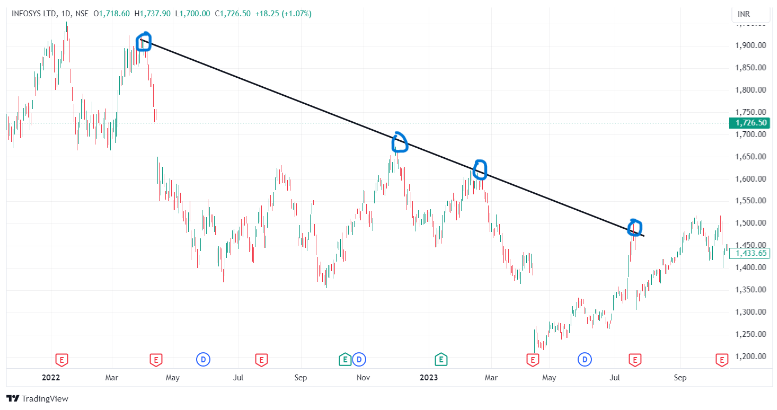
This indicates intense selling pressure, with sellers consistently preventing the price from rising above the resistance level.
Now that you understand support and resistance levels, let’s learn to draw them.
How do you draw support and resistance levels in a chart?
Step 1: Selecting your timeframe
Selecting a timeframe depends on your trading style. For example, day traders often use 15-minute charts, swing traders use hourly, daily, or weekly charts, and positional traders use monthly charts. Choosing a suitable timeframe is crucial for aligning your analysis with your trading strategy.
Zoom out the chart after selecting a particular time frame until a trend can be deciphered, something like this:
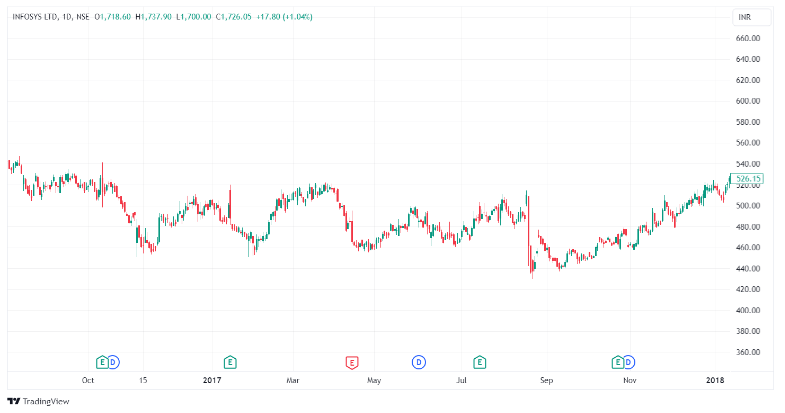
Step 2: Connecting the highs and lows
After loading the price charts according to your timeframe, as mentioned in Step 1, mark the high and low price points. Once you can spot them, draw a trendline connecting the highs and another connecting the lows.
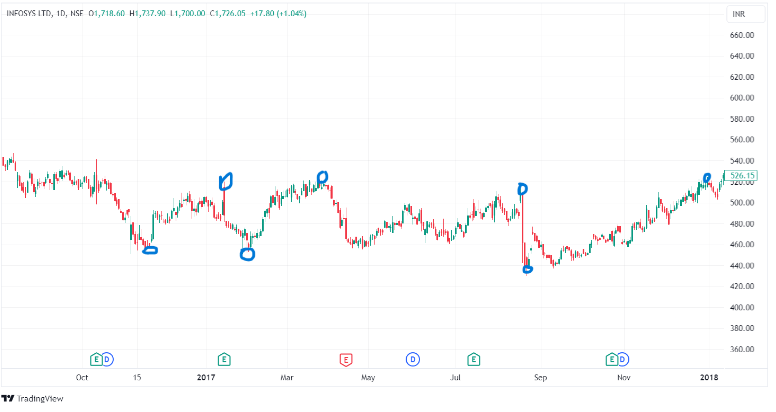
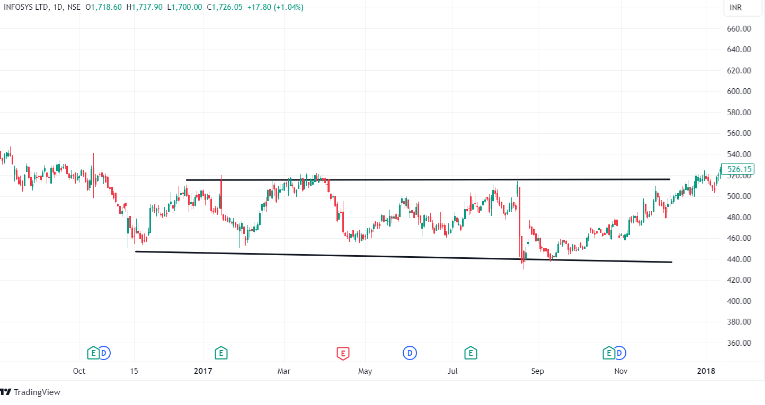
How To Use Support and Resistance Levels
Support and resistance are areas with potential for reversals. We can mainly use them to set entry and exit points in our trading strategy. Let’s demonstrate with a simple example.
First, we aim to mark the highs and lows in the daily chart of Asian Paints Ltd.

Now, we draw a trendline connecting those highs and lows, respectively.
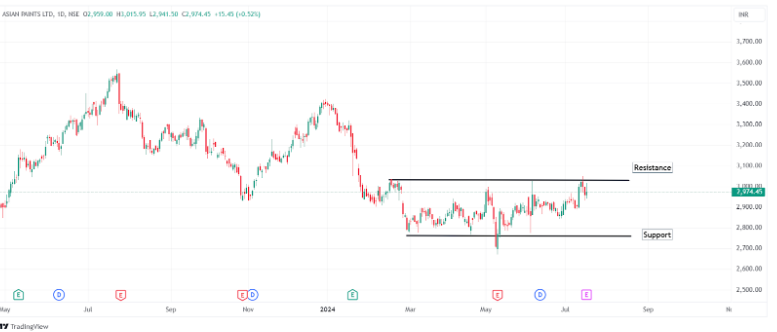
The chart shows that the current price of Asian Paints is testing its resistance level. If the resistance breaks with a candlestick confirmation, such as a bullish engulfing pattern, we can confirm the uptrend and build a long position. However, if the price gets rejected by the resistance, our potential entry point for a long position would be at the support level.
The Dow theory
The Dow theory is a fundamental principle in trading that helps identify the overall market trend. Even today, traders use the Dow theory along with candlestick patterns to make better trading decisions.
Charles H. Dow created the Dow theory in the late 19th century. Dow, who co-founded Dow Jones & Company and the Wall Street Journal, developed this theory from his writings between 1884 and 1902. Dow theory helps traders understand market trends by analyzing price movements, and it is a vital part of modern technical analysis.
Principles of Dow Theory
The Dow theory is built on a few core beliefs called tenets. Over the years, through market observation, nine tenets have been identified. Here are the nine tenets, backed by examples:
1. The market discounts everything.
The stock market reflects all available information in stock prices, including earnings reports, economic conditions, and political developments. Market movements are the cumulative result of all known factors. For example, when Reliance Industries announces its earnings, the stock price quickly reflects this news. Good earnings make the price rise; bad earnings make it go down. Essentially, Reliance’s stock price includes all available information.
2. Three trends form the market
Dow identified three types of trends: primary, secondary, and minor.
3. The primary trend
These are significant market movements that last several months to years. They are characterized by a sustained movement in one direction, either upward or downward. The trend reflects the overall market sentiment, indicating either an upward (bull market) or downward (bear market) direction.
4. The secondary trend
These are short-term fluctuations within the primary trends, lasting from several weeks to several months. They move opposite the primary trend and represent a counter-trend movement, like a pullback or correction. While long-term investors focus on primary trends, swing and day traders pay attention to all trends.
5. The minor trend
These are daily market fluctuations, often called market noise. Minor trends last from a few days to a few weeks and move in the same direction as the primary trend. Short-term changes in supply and demand cause them.
6. Indices must confirm
Other significant indices should also confirm a trend to be valid. For example, in the Indian market, the Nifty 50 and the Nifty Bank index must show the same trend direction. If one index is rising while the other is falling, it may signal a trend reversal or weakening.
7. Volume confirms trends
The volume should also support the ongoing primary trend. In a bull market, volume should rise as prices increase and fall during corrections. In a bear market, volume should increase during declines and decrease during rallies. Low volume during a trend may indicate that the trend is weak and may not be sustained. You can learn about volume here.
Volume
In the stock market, volume refers to the number of shares bought and sold during a specific period, usually within a day.
8. Sideways markets can substitute secondary markets
Markets can sometimes move sideways, trading within a specific range for an extended period. For example, Tata Motors traded between ₹300 and ₹350 for several months. These sideways markets, where prices fluctuate within a range without significant upward or downward movement, can often substitute for a secondary trend.
9. Closing price and signal confirmation
In Dow theory, signals are based on closing prices rather than intraday movements. For example, if the Bank Nifty index shows a strong upward movement during the day but closes lower, it doesn’t confirm an uptrend. We wait for the closing price to avoid false signals from intraday volatility. If Bank Nifty consistently closes higher over several days, it confirms an uptrend. Similarly, for a downtrend, we look for consistent lower closing prices.
Bank Nifty
Bank Nifty is a stock market index in India that represents the performance of the banking sector.
The Three Phases of Major Trends
According to the Dow theory, markets go through three repeating phases: the accumulation phase, the markup phase, and the distribution phase. Let’s discuss each one:
The accumulation phase is the first phase of a primary trend. During this phase, informed investors, known as “smart money,” start buying stocks. These investors have a deeper understanding of the market. Smart money generally refers to institutional investors who think in long-term perspectives. After a steep sell-off, they buy many shares over an extended period. This defines the accumulation phase. During this time, sellers can easily find buyers, preventing prices from falling further. Therefore, the accumulation phase usually marks the bottom of the market and creates significant support levels for any stock.
Once these institutional investors have bought a significant amount of stocks, short-term traders start to support the market. This begins the markup phase, also known as the public participation phase. This phase is marked by increased investor activity, significant price movements, and rising trading volumes. The markup phase is relatively quick and coincides with improved business sentiment. As people see the impressive returns, everyone wants to join in and participate in the rally.
When stocks finally hit all-time highs, everyone becomes very optimistic about the stock market. News reports turn positive, the business environment seems vibrant, and the public is eager to invest. A large number of people want to put their money into the market. This is when the distribution phase occurs.
At this time, smart money, or institutional investors, will start selling off their investments. Since prices have already peaked, no further appreciation has been seen. This selloff leaves the public frustrated as prices begin to fall. Institutional players then wait for a market reversal to start the cycle again.
When the circle is completed, the selloff phase follows a fresh round of the accumulation phase, and the whole cycle repeats. The entire cycle from the accumulation phase to the selloff is believed to span over a few years.
Now that we’ve grasped the principles of Dow theory, let’s examine how we can effectively trade using them.
Dow theory trading strategy
This trading strategy is rooted in the principles of Dow theory, emphasizing the importance of analyzing stock trends to make informed investment decisions. Here are the critical steps involved in using Dow theory in your trading approach:
Step 1: Identify the primary trend
The first step of this strategy is to identify the primary trend from a long-term perspective. This is done by analyzing the market’s price movements over several months to years. If the stock is forming continuous higher highs and higher lows, it is said to be in an uptrend. Conversely, it is in a downtrend if it consistently forms lower lows and lower highs.
Step 2: Confirm the trend
After identifying the primary trend, the next step is to confirm it, as confirmation is crucial before entering a trade. To verify the trend, examine the trading volumes. It is a good sign if the trading volume increases as the market moves toward the trend.
We have yet to discuss volume but think of volume as the number of shares being traded.
Step 3: Identify secondary trends
As we discussed, secondary trends within the primary trend can provide opportunities for traders to enter or exit the market. These are short-term movements lasting several weeks to a few months. Swing traders make the best use of these secondary trends.
Step 4: Look for trend reversals
One fundamental principle of the Dow theory is that trends will continue until there are clear signs of a reversal. Traders using this strategy look for indications of the trend weakening or changing direction, such as a shift in trading volume or a break in crucial support or resistance levels.
Step 5: Use technical analysis
Technical analysis plays a vital role in the Dow theory trading strategy. Traders use charts to identify critical support and resistance levels, trend lines, and other patterns to decide a trade’s entry and exit points.
We will now finally look at the pros and cons of Dow theory.
Pros and cons of the Dow theory
Some advantages of Charles Dow’s theory are as follows:
- Long-term perspective: Dow theory is based on long-term market trends, providing investors and traders with a big-picture view of market movements. It helps investors avoid knee-jerk reactions to short-term market fluctuations and focus on long-term growth potential.
- Easy to understand: Dow theory is based on simple principles and provides clear guidelines for identifying market trends. It can be a valuable tool for investors who want to better understand market behavior.
- Follows market trends: The Dow process is based on the idea that the market is always right. And it helps investors follow the current trend. By identifying the trend, investors can make better decisions about when to buy and sell securities.
Some disadvantages of Dow’s theory are as follows:
- Not consistently accurate: While the Dow theory helps analyze market trends, it is only sometimes correct when predicting future movements. Various external factors, such as political and economic events, can influence market behavior and make it difficult to rely solely on the Dow theory.
- Ignores other important factors: The Dow theory focuses mainly on market trends and does not consider other important factors, such as company fundamentals, macroeconomic indicators, and industry trends.
Summary
- Understanding demand and supply is essential for identifying stock price movements through support and resistance levels.
- Support is a price level where demand prevents further declines in stop prices. It is useful in deciding entry prices and stop loss levels for long positions.
- Resistance is a price level at which supply prevents a stock price from rising further. It is useful in deciding target prices and stop-loss levels for short positions.
- Select your timeframe to draw support and resistance levels, mark highs and lows, and connect them with trendlines.
- Use support and resistance levels to set entry and exit points in your trading strategy.
- Dow theory helps identify market trends through principles like primary, secondary, and minor trends.
- Primary trends are long-term market movements lasting months to years, indicating overall market sentiment.
- Secondary trends are short-term movements within primary trends, lasting weeks to months and offering trading opportunities.
- Minor trends are daily market fluctuations caused by short-term supply and demand changes, often seen as market noise.
- The Dow theory includes market phases: the accumulation phase (informed investors buy after a decline), the markup phase (increased investor activity and rising prices), and the distribution phase (institutional investors sell at market highs), followed by a potential market reversal.
Chapter 8: Trading Chart Patterns
In this chapter, we will explore different chart patterns that visually represent the battle between buyers and sellers. These patterns help determine if a market is trending higher, lower, or sideways.
Chart patterns can be divided into two broad categories: reversal patterns and continuation patterns. Reversal patterns indicate a trend change, whereas continuation patterns indicate that the price trend will continue after a brief consolidation.
Continuation Patterns
Continuation chart patterns indicate that the current trend will likely continue, up or down. They form during a pause in the market and suggest that after a brief consolidation, the price would resume its previous direction. Understanding these patterns helps traders take advantage of ongoing market movements and manage their trades better.
Now, we will discuss the first continuation pattern, the triangles.
Triangles
The triangle chart pattern is named because it looks like a triangle. There are three types of triangles: ascending, descending, and symmetrical. These patterns form when the price is in a consolidation, and the price direction before the consolidation can give clues about future market movements.
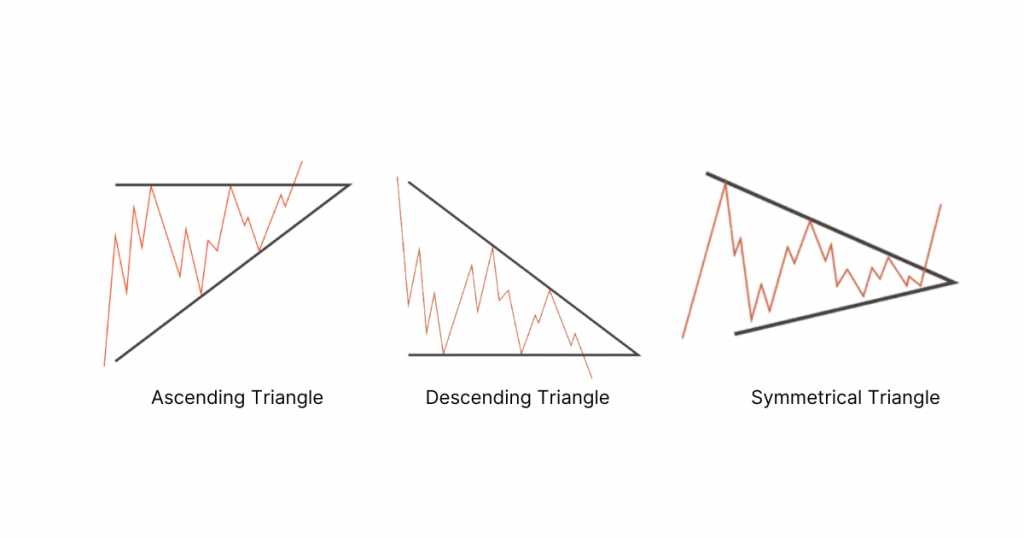
Symmetrical Triangle
This continuation chart pattern sometimes called a coil, contains at least two lower highs and two higher lows. When these points are connected with lines, they converge as they extend, forming a symmetrical triangle.
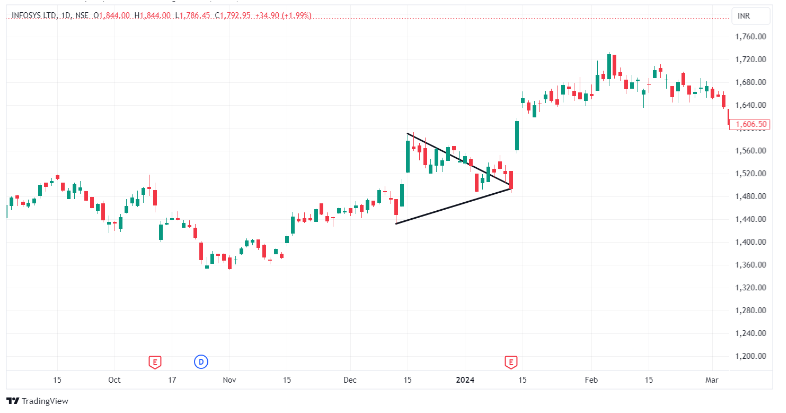
As you can see, a symmetrical triangle is formed by connecting lower highs and higher lows. Here is the formation process of a symmetrical triangle:
- The market is in either an uptrend or a downtrend before the symmetrical triangle starts to form.
- Prices start to make lower highs and higher lows, creating two converging trendlines that form a symmetrical triangle. As the pattern develops, trading volume typically decreases, indicating a consolidation phase.
- The two trendlines converge towards an apex, where the price movement becomes more constricted.
- The pattern is confirmed when the price breaks out of the triangle, either upward or downward, typically accompanied by an increase in volume. This breakout signals the direction of the following significant price move.
How to trade a symmetrical triangle?
- Entry: Enter a trade at the opening of the next candle after the price breaks out of the symmetrical triangle.
- Confirmation: The symmetrical triangle is confirmed when the price breaks out of the triangle with higher trading volume, showing the new trend’s direction.
- Stop Loss: Place a stop loss just below the lower trendline (for an upward breakout) or just above the upper trendline (for a downward breakout) to limit potential losses if the trade moves against you.
Ascending Triangle
An ascending triangle appears when two or more nearly identical highs form a horizontal resistance line while higher lows create an ascending support line. This pattern suggests increasing buying strength and looks like a right triangle. It often signals that a breakout above the resistance line may occur, indicating a possible upward trend continuation.
Here’s how it can be plotted on a price chart:
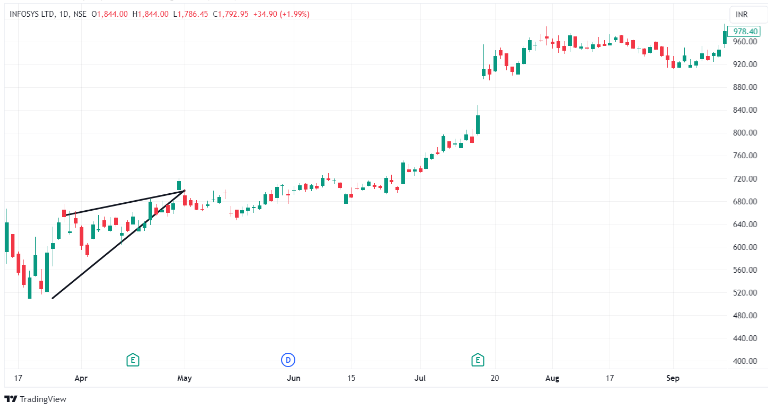
The formation process of an ascending triangle:
- Prices start to make higher lows while facing resistance at a consistently high level, creating a horizontal upper trendline and an upward-sloping lower trendline that forms the ascending triangle.
- As the pattern develops, trading volume typically decreases, indicating a consolidation phase.
- The two trendlines converge towards an apex, where the price movement becomes more constricted.
- The pattern is confirmed when the price breaks out above the horizontal resistance line, typically accompanied by an increase in volume. This breakout signals a continuation of the previous uptrend.
How to trade an ascending triangle?
- Entry: Enter the trade at the opening of the next candle after the price breaks above the horizontal resistance line of the ascending triangle.
- Confirmation: The ascending triangle is confirmed when the price breaks out above the resistance line with a bullish candle and higher trading volume, indicating the new trend’s direction.
- Stop Loss: Place a stop loss just below the upward-sloping trendline to limit potential losses if the trade moves against you.
Descending Triangle
This pattern also looks like a right-angle triangle. Two or more similar lows create a horizontal line at the bottom. Two or more lower highs create a descending trend line above that meets the horizontal line as it goes down. Here’s a descending triangle plotted on a price chart:
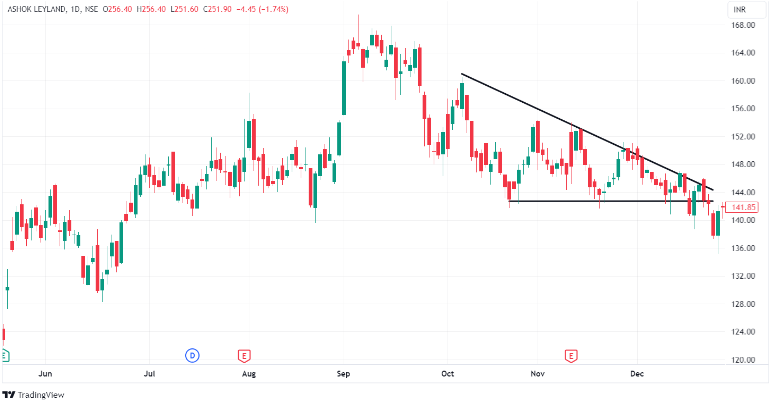
The market psychology behind a descending triangle is as follows:
- The market usually has a downtrend before the descending triangle starts to form.
- Prices make lower highs while the lows stay consistently low, creating a flat bottom line and a sloping top line that forms the descending triangle.
- As the pattern develops, trading volume usually decreases, showing a period of consolidation.
- The two lines converge towards a point where the price movement becomes tighter.
- The pattern is confirmed when the price breaks below the flat bottom line, usually with higher volume. This breakout signals that the downtrend will likely continue.
How to trade a descending triangle?
- Entry: Enter the trade at the opening of the next candle after the price breaks out below the horizontal support line of the descending triangle.
- Confirmation: The descending triangle is confirmed when the price breaks out below the support line with a bearish candle and higher trading volume, indicating the new trend’s direction.
- Stop Loss: Place a stop loss just above the downward-sloping trendline to limit potential losses if the trade moves against you.
Flags
Now, we’ll explore another interesting chart pattern – the flag.
Flags are chart patterns made up of two parts – a steep rise or decline in prices, followed by a short period of consolidation. They are of two types – bullish and bearish. Here’s how they look:
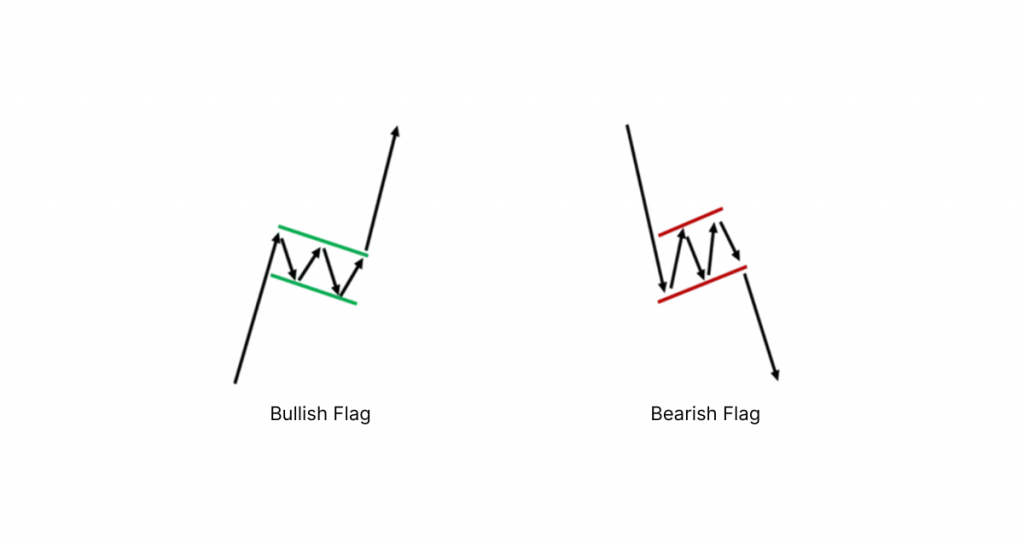
Bullish Flag
This pattern forms when a stock’s price rises sharply. Flag patterns start with a big move-up and a short correction period. This correction happens between two parallel lines, making a shape like a flag on a pole.
The psychology for bullish flag formation is as follows:
- The stock experiences a sharp, steep rise in prices.
- After this big move-up, prices enter a short correction phase.
- This correction happens between two parallel lines, forming a flag shape.
- The pattern is confirmed when prices break out of the flag, usually continuing in the direction of the initial steep rise, indicating a potential trend continuation.
How can we trade a bullish flag?
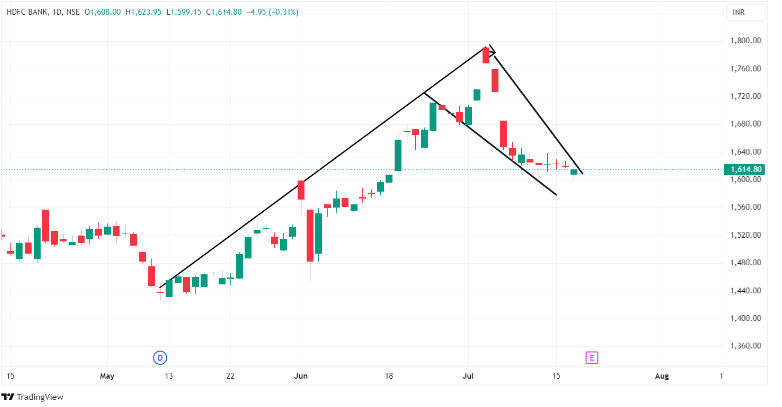
The trade setup is as follows:
- Entry: Enter the trade at the breakout above the upper parallel line, which is at ₹1,650 in the case of the above chart.
- Stop Loss: Set the stop loss below the lower parallel line, which is at ₹1,600 here.
- Target: Aim for a target by adding the flagpole height (approximately 340 points) to the breakout point (1,650), giving a target of around ₹1,990.
Bullish Penants
Similar to a bullish flag, there is also a bullish pennant pattern. Both start with a steep move but differ in structure in that the bullish pennant forms a triangle rather than a flag shape. Here’s an example to help illustrate this pattern.
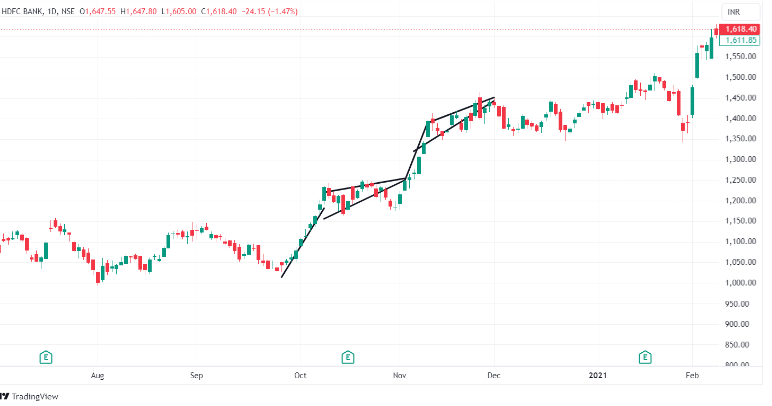
In the above image, you can see the continuous formation of a bullish pennant flag.
Trading a bullish pennant is very similar to trading a bullish flag. To trade a bullish pennant, go long on the stock when the price breaks above the converging trendline. The target is set based on the height of the flagpole, and the stop-loss is placed just below the lower trendline of the pennant.
Bearish Flag
This pattern forms when a stock experiences a sharp, steep rise in price. Bullish flag patterns start with a big up-move, followed by a short period of consolidation. This consolidation happens between two parallel lines, forming a shape like a flag on a pole.
The psychology for bearish flag formation is as follows:
- The stock experiences a sharp, steep drop in prices.
- After this big move down, prices enter a short correction phase.
- This correction happens between two parallel lines, forming a flag shape.
- The pattern is confirmed when prices break out of the flag, usually continuing in the direction of the initial steep drop, indicating a potential trend continuation.
Here is the pictorial representation of it
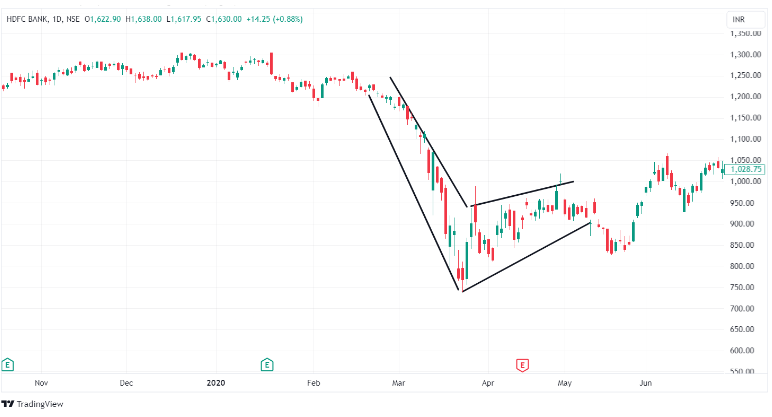
How can we trade bearish flag?
- Entry: Enter the trade at the breakout below the lower parallel line.
- Stop Loss: Set the stop loss just above the upper parallel line.
- Target: Aim for a target by subtracting the height of the flagpole from the breakout point.
Bearish Penants
The bearish pennant is converse to the bullish penant. Similar to bearish flags, pennants form a small symmetrical triangle shape where two converging trendlines meet, indicating a period of consolidation before the previous bearish trend resumes.
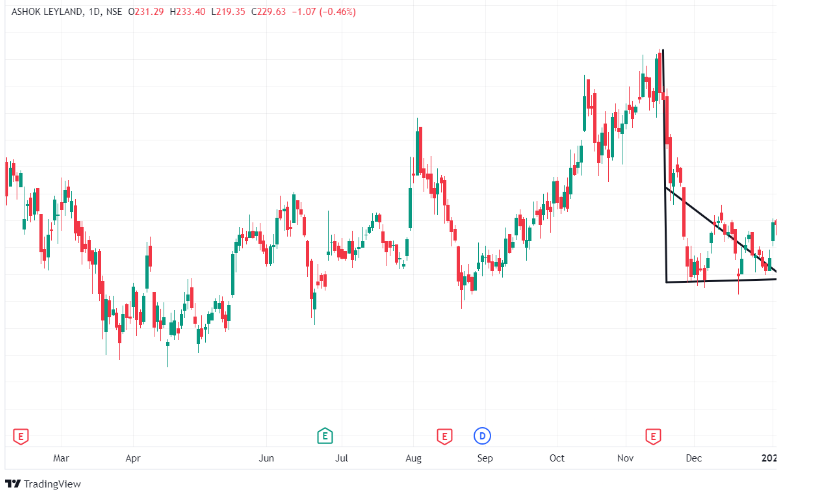
Trading a bearish pennant involves taking a short position when the price breaks below the converging trendlines. The target price is determined by the distance of the initial sharp decline, and the stop loss should be set just above the upper trendline of the pennant. As the downward trend continues, this approach helps manage risk while aiming for potential profit.
Reversal Chart Patterns
Reversal chart patterns appear on price charts and tell us that a price trend might change direction. After a long rise or fall in prices, these patterns suggest the trend could end and move the opposite way. Traders look for these patterns to decide when to buy or sell, expecting a change in market direction.
Let’s look at the first reversal chart pattern: the head and shoulder pattern.
Head and Shoulders
The head and shoulders pattern looks like a person’s head and shoulders on a price chart. It has three peaks, with the middle one being the farthest.
There are two types of head and shoulders: head and shoulders sometimes, also referred to as head and shoulders top. Another is inverse head and shoulders, or head and shoulders bottom.
Here’s a pictorial representation:
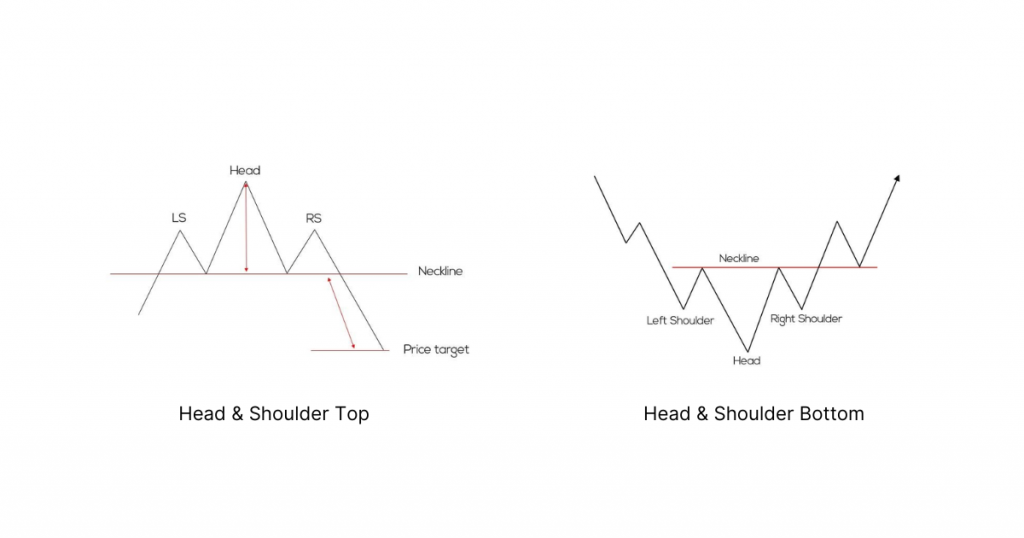
Head and shoulders top
A head and shoulders top reversal pattern forms after an uptrend and signals a potential trend reversal upon completion. The pattern consists of three successive peaks: the middle peak, known as the head, is the highest, while the two outside peaks, called the shoulders, are lower and roughly equal in height.
The formation process behind the head and shoulders top:
- The market is in an uptrend, and prices rise to a new high, forming the first peak (left shoulder) before pulling back slightly.
- After the pullback, prices rise again to form a higher peak (head), but then declines again, hitting the previous support level.
- Prices rise once more but fail to reach the height of the head, forming the third peak (right shoulder). The pattern is confirmed when prices fall below the neckline, drawn by connecting the lows after each peak, signaling a potential trend reversal from bullish to bearish.
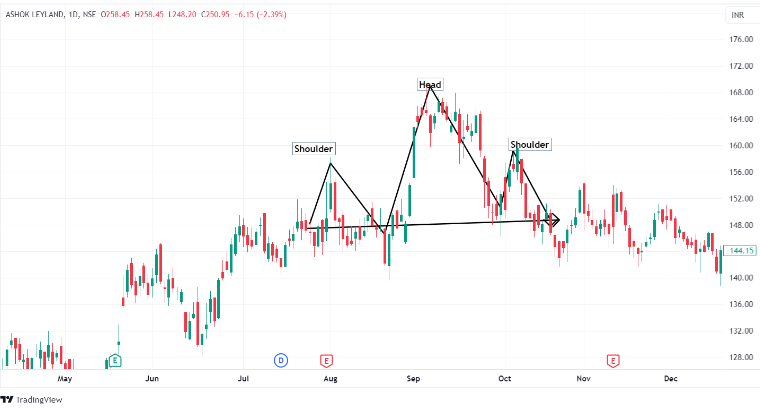
How to trade head and shoulders top?
- Entry: Enter a short trade when the price breaks below the neckline with increased volume.
- Target: Set the target price by subtracting the height from the head to the neckline from the breakout point below the neckline.
- Stop Loss: Place the stop loss above the right shoulder to limit potential losses if the breakout fails.
Head and shoulders bottom
The opposite of the head and shoulders top is the head and shoulders bottom. It is also known as the inverse head and shoulders pattern. Here, the formation occurs after a downtrend, indicating a potential reversal to an uptrend. As it completes, the pattern shifts market sentiment from bearish to bullish, signaling a possible upward movement in prices.
The formation process of the head and shoulder bottom is as follows:
- The market is in a downtrend, and prices fall to a new low, forming the first trough (left shoulder) before rebounding slightly.
- After the rebound, prices fall again to form a lower trough (head) but then rise, hitting the previous resistance level.
- Prices fall once more but do not reach the depth of the head, forming the third trough (right shoulder). The pattern is confirmed when prices rise above the neckline, drawn by connecting the highs after each trough, signaling a potential trend reversal from bearish to bullish.
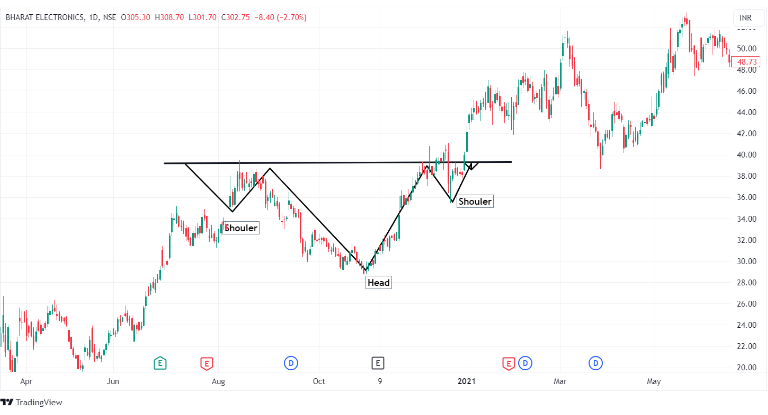
How to trade head and shoulders bottom?
- Entry: Enter a long trade when the price breaks above the neckline with increased volume.
- Target: Set the target price by adding the height from the head to the neckline to the breakout point above the neckline.
- Stop Loss: Place the stop loss below the right shoulder to limit potential losses if the breakout fails.
Double Bottom And Double Top Patterns
A double bottom and double top are potential trend reversal patterns. They occur when a stock moves in a pattern resembling the letter “W” (double bottom) or the letter “M” (double top), something like this:
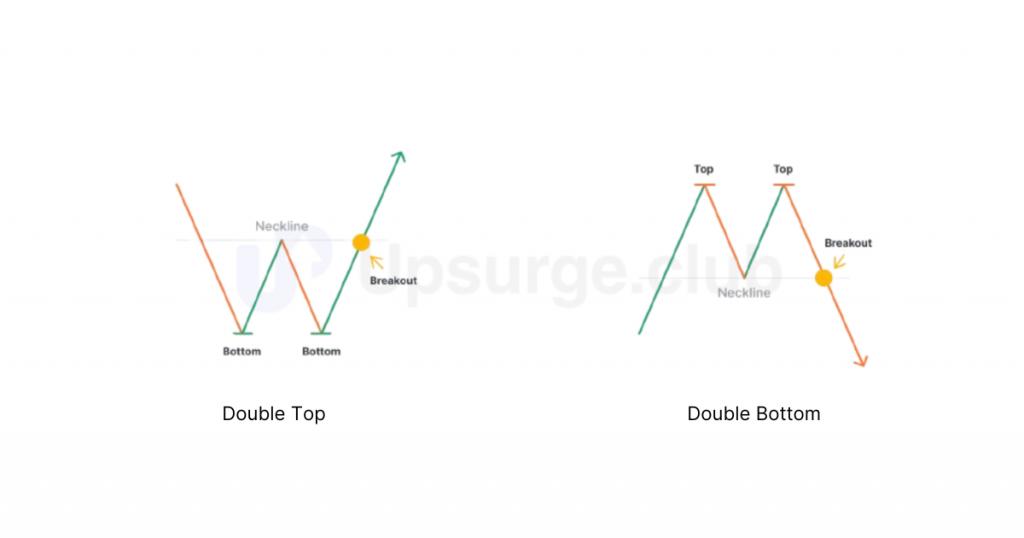
Double Bottom
A double bottom is a bullish reversal pattern. The stock first drops to a low point and then rises to a resistance level. It drops to the low point again forming a support before finally moving up from the downtrend.
Here is a pictorial representation of a double-bottom pattern.

The formation process of double bottom is
- The market is in a downtrend, and prices fall to a new low before finding support and rebounding slightly.
- After the initial rebound, prices rise but hit resistance and pull back, forming a peak between the two low points.
- Prices decline again, but the selling pressure weakens, and the market forms a second low around the same level as the first low point.
- The pattern is confirmed when prices rise above the peak formed between the two highs, signaling a potential trend reversal from bearish to bullish.
A tribple bottom occurs when the price touches the support three times before breaking the resistance. Here’s how it looks on a chart:
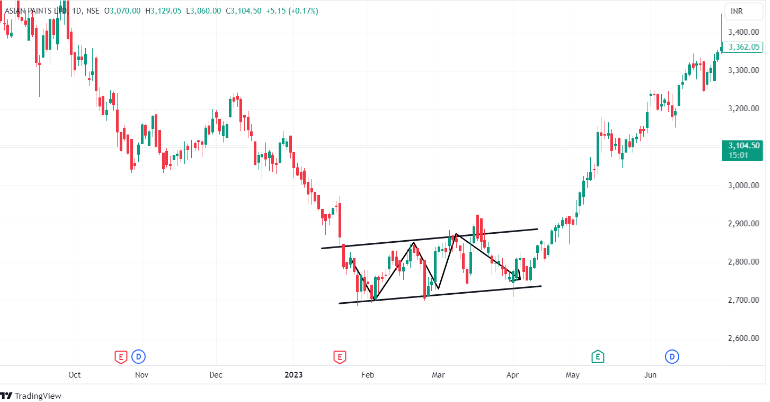
In fact, the price breaking out after a triple bottom gives a stronger rally than the one after a double bottom.
Now, we will look at the opposite of the double bottom, which is the double top.
Double Top
A double top is a bearish reversal pattern. The stock first rises to a high point and then falls to a support level. It rises to a high point again before finally moving down from the uptrend.
Here is a pictorial representation of a double-top pattern.
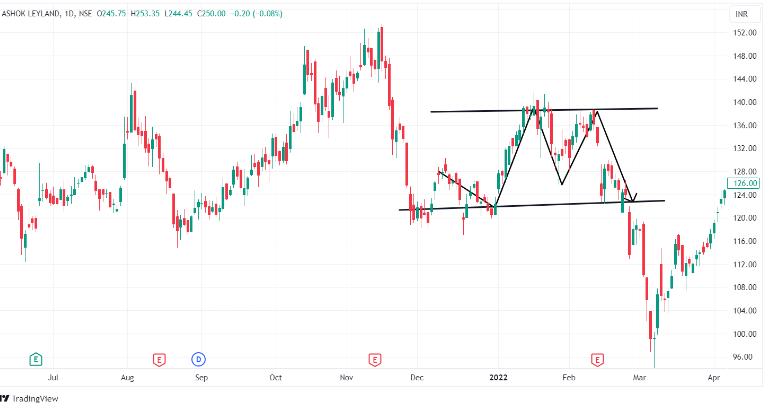
The process of forming a double bottom is as follows:
- The market is in an uptrend, and prices rise to a new high before hitting resistance and pulling back slightly.
- After the pullback, prices fall but find support, forming a low point between the two highs.
- Prices rise again, but the buying pressure weakens, and the market forms a second high at about the same level as the first high.
- The pattern is confirmed when prices fall below the low point between the two highs, signaling a potential trend reversal from bullish to bearish.
How to trade the double bottom and double top patterns?
Double bottom and double top patterns can be handy in trading when identified correctly. For a double top, measure the distance from the top of the “M” to the neckline to set a target and place a stop loss above the neckline. Enter a short trade when the neckline breaks.
For a double bottom, place a stop loss below the neckline and enter a long trade when the neckline breaks upward. These patterns work well, but careful and patient analysis is needed to avoid mistakes.
Let’s demonstrate with an example.
Here is a chart of HDFC bank formation of a double-bottom pattern:
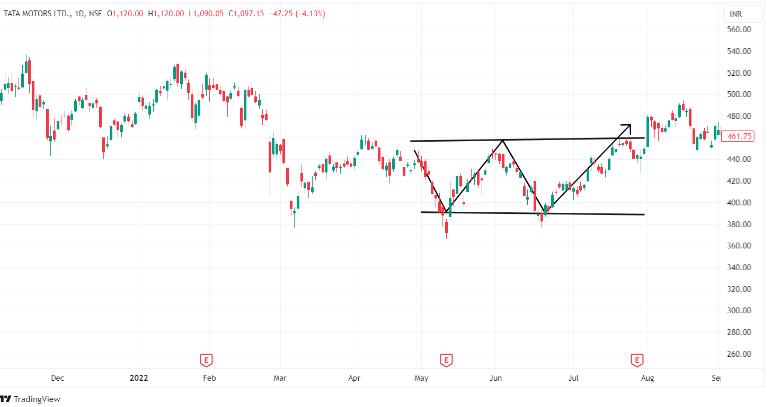
For the above chart, we can enter a long trade, as the double bottom indicates a potential bullish reversal pattern. We can set our stop loss at the preceding support level and target a price move by measuring the distance between the neckline and the support level.
Conversely, here’s a possible trade after a triple top pattern is formed. For a triple top, place a stop loss above the neckline and enter a short trade when the neckline breaks downward.
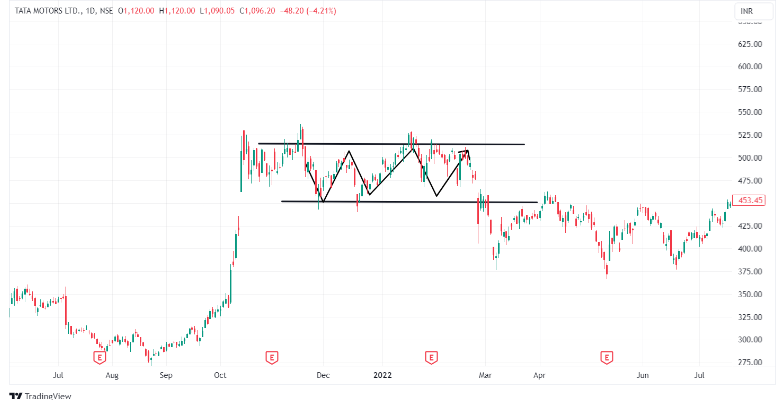
Chapter 9: Indicators - Part 1
Now that we’ve covered chart patterns, let’s discuss indicators.
Indicators are tools developed by successful traders as independent trading systems. They are based on a preset logic and help traders enhance their technical analysis, including candlesticks, volume, support, and resistance levels. Indicators assist in making trading decisions by helping with buying, selling, confirming trends, and sometimes predicting future trends.
There are two main types of indicators: lagging and leading. A leading indicator predicts future price movements, often signaling a reversal or a new trend before it happens. However, they are only sometimes accurate, and knowing how to use them effectively requires experience and practice. Lagging indicators, on the other hand, are used to confirm trends. They usually generate a signal after a trend begins but have a better accuracy rate than leading indicators.
In this chapter, we will discuss one famous lagging indicator, the moving average, and how to trade using it. Let’s go!
The moving average
The moving average indicator is very similar to the ‘average’ we learned in school: the sum of observations divided by the total number of observations. Let’s recall with a simple example—let’s calculate the average weight of five men.
Man | Weight (in kg) |
Ravi | 71 |
Kishore | 75 |
Bhuvan | 55 |
Vignu | 55 |
Manohar | 65 |
The average of the above observation = (71 + 75 + 55 + 55 + 65) / 5 = 64.20 kg.
Similarly, if we calculate the average of the closing prices of a particular stock over a specific period, it’s called the stock’s simple moving average (SMA). Let’s calculate a stock’s 5-day moving average based on its closing prices of the past 5 days.
Day | Closing Price |
Day-1 | 414 |
Day-2 | 416 |
Day-3 | 419 |
Day-4 | 423 |
Day-5 | 444 |
Average | 423.20 |
The average closing price is the sum of all closing prices over a certain number of days divided by the number of days. When this average is plotted over time, it results in a simple moving average. Hence, the simple moving average is nothing but the changing average of the stock price on a particular day. It can be represented by a line whose movement can be compared with the stock’s price.
Its lookback period can be changed as per a trader’s requirement. In the above example, the five-day moving average for the share price is 423.32. A moving average smooths out price data to give a clearer view of the stock’s trend over time.
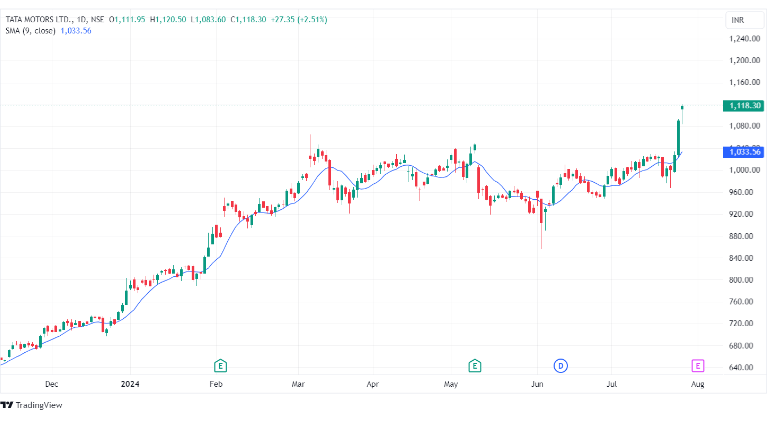
As seen in the chart, the blue line above the candlesticks is the simple moving average, showing the stock’s overall trend.
Another type of moving average is the exponential moving average (EMA), which reacts heavily to recent price changes. Let’s learn about it in more detail.
The exponential moving average
An exponential moving average (EMA) is a type of moving average that gives more weight to recent prices. The EMA is often used in technical analysis to spot trends and potential reversals.
Here is the calculation of a 5-period EMA based on closing prices:
Day | Closing Price |
Day-1 | 100 |
Day-2 | 102 |
Day-3 | 104 |
Day-4 | 106 |
Day-5 | 108 |
Step 1: Calculate the Simple Moving Average (SMA) for the first five days
SMA = (100 + 102 + 104 + 106 + 108) / 5 = 104
This SMA serves as the starting point for the EMA.
Step 2: Calculate the multiplier for weighting the EMA
Multiplier = 2 / (5 + 1) = 0.3333
Step 3: Calculate the EMA for Day 6 using a hypothetical price
Let’s say the closing price for Day 6 is 110.
EMA = (Closing price – Previous EMA) * Multiplier + Previous EMA
For Day 6:
EMA = (110 – 104) * 0.3333 + 104 = 2 + 104 = 106
So, the EMA for Day 6 is 106.
When this calculation for each day is plotted over time, it results in an exponential moving average. It can be represented by a line whose movement can be compared with the stock’s price.
Here too, the lookback period can be changed as per a trader’s requirement. An exponential moving average gives a weighted average of the stock price to give a clearer view of the stock’s trend over time and also signals potential reversals.
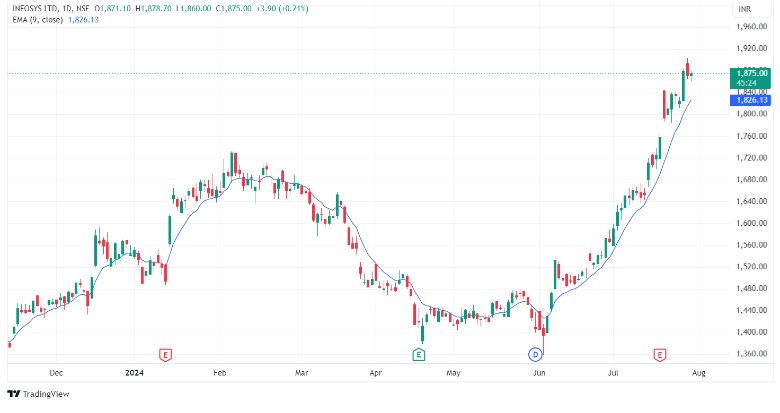
How to trade moving averages
A simple moving average (SMA) smooths out price data to help identify longer-term trends, though it needs to catch up and capture quick changes. To better capture these changes and make more timely trading decisions, traders often use the exponential moving average (EMA), which gives more weight to recent prices.
The exponential moving average is a lagging indicator it is used in several ways:
Identifying trends
Imagine you’re trading a stock, and the 50-day EMA is rising. This suggests an upward trend, so you might consider buying the stock or holding your existing position.
Here is an example of a 9-period exponential moving average. As the 9-day EMA rises, the stock’s upward trend continues.
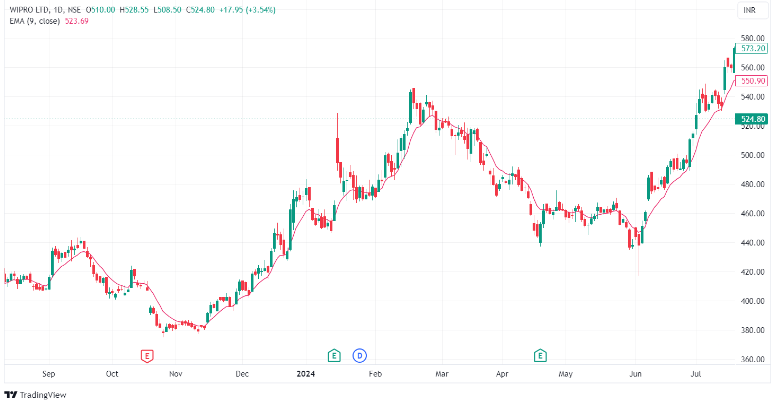
Identifying support and resistance levels
Sometimes, stock prices may frequently bounce off their 20-day EMA, which acts as a support level. The price falling below the EMA might signal a selling opportunity.
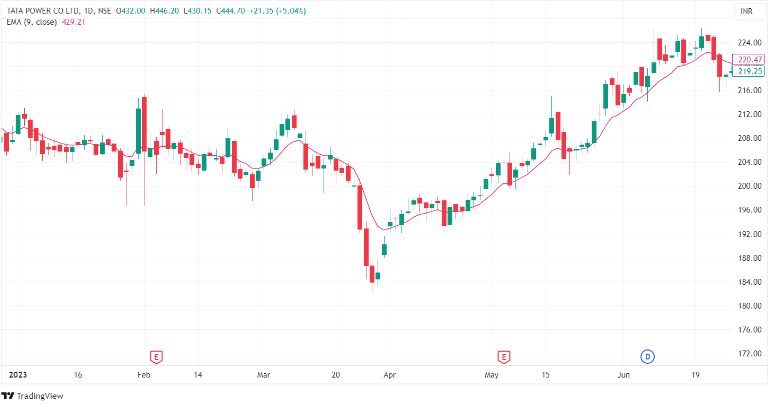
We can see that the 9-day EMA first acted as a resistance and later as a support, similar to what happened with Tata Power.
Using moving average crossovers
Combining two EMAs can be used as a trend reversal signal in trading, especially with moving average crossovers.
A moving average crossover occurs when one moving average crosses over another moving average, each having different lookback periods. Bullish and bearish trading signals can be developed depending on the direction of the two average lines.
Let’s look at the most famous crossovers.
- Golden Crossover: This occurs when a short-term EMA, like the 50-day EMA, crosses above a long-term EMA, such as the 200-day EMA. It signals a potential bullish trend reversal.
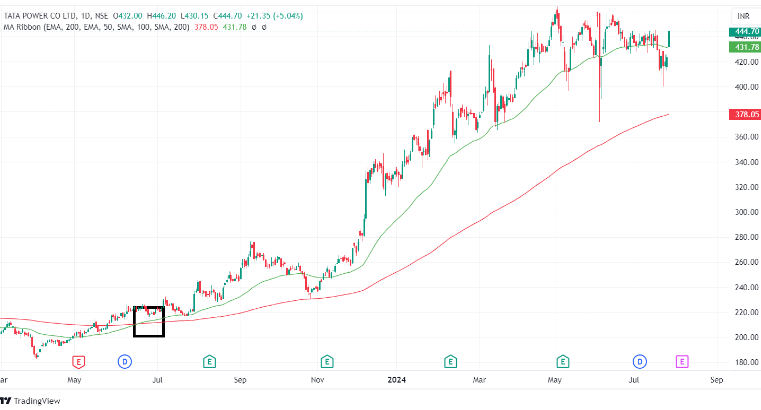
As we can see, after the golden crossover happened, there was a bullish trend for an extended period.
- Death Crossover: This happens when a short-term EMA crosses below a long-term EMA. It suggests a potential bearish trend reversal.
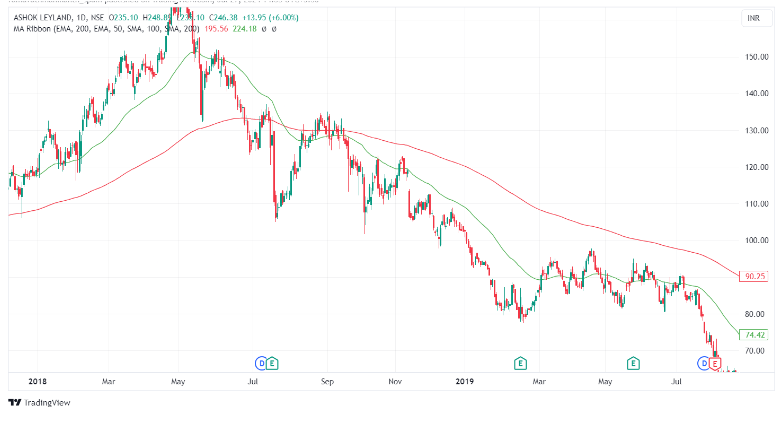
As we can see, after the death crossover, there was an extended bearish trend.
Not all moving average signals should be relied on…
- In sideways markets, moving averages can give many buy and sell signals, often leading to small gains or losses.
- It’s hard to know which trade will be the big winner, so it’s best to take all the trades suggested by the moving average system. One big winning trade can cover all the losses and provide good profits.
Summary
- Indicators help traders understand market trends, gauge strength, and find entry/exit points using market data like price and volume.
- There are two main types of indicators: lagging, like moving averages, and leading, which predicts future movements.
- A moving average (MA) smooths out price data to show trends over time; simple moving averages (SMA) use equal weighting, while exponential moving averages (EMA) give more weight to recent prices.
- SMAs are useful for identifying long-term trends but may miss quick changes; EMAs react faster and help make timely trading decisions.
- A golden crossover occurs when a short-term EMA crosses above a long-term EMA, indicating a potential bullish trend. A death crossover happens when a short-term EMA crosses below a long-term EMA, signaling a potential bearish trend.
- In sideways markets, moving averages can produce many signals with small gains or losses; following all signals can maximize potential gains.
Chapter 10: Indicators - Part 2
In the previous chapter, we explored the moving average, a well-known indicator for identifying trends and reversals in stocks. We’ll delve into other essential indicators like the RSI, MACD, Bollinger Bands, and Supertrend. Traders widely use these tools, which are crucial for gaining a deeper understanding of market dynamics.
For a quick recap, leading indicators give signals before the trend changes or continues, helping to predict future movements. In contrast, lagging indicators follow the price movement and are usually used to confirm trends rather than predict them.
RSI - Relative Strength Index
The relative strength index (RSI) is a leading momentum indicator developed by J. Welles Wilder. Its primary use is to identify overbought and oversold signals, meaning it helps spot potential trend reversals. The RSI oscillates between 0 and 100, and based on the latest indicator reading, the expectations for the markets are set.
The relative strength index (RSI) is a highly effective tool, especially when stocks are trading within sideways or non-trending ranges. This is because markets often move sideways, making it crucial to identify potential turning points.
The formula for calculating the RSI:
RSI = 100 – [100 / (1+RS)]
Where RS = Average Gain / Average Loss
Let’s calculate the RSI of the following dataset.
Sr. No. | Closing Price | Points Gained | Points Lost |
1 | 120 | 0 | 0 |
2 | 123 | 3 | 0 |
3 | 119 | 0 | 4 |
4 | 122 | 3 | 0 |
5 | 121 | 0 | 1 |
6 | 124 | 3 | 0 |
7 | 122 | 0 | 2 |
8 | 125 | 3 | 0 |
9 | 128 | 3 | 0 |
10 | 127 | 0 | 1 |
11 | 126 | 0 | 1 |
12 | 130 | 4 | 0 |
13 | 132 | 2 | 0 |
14 | 135 | 3 | 0 |
In the above table, points gained/lost denote the number of points gained/lost concerning the previous day’s close. For example, if today’s close is 104 and yesterday’s close was 100, points earned would be 4, and points lost would be 0. Similarly, if today’s close was 104 and the previous day’s close was 107, the points gained would be 0, and the points lost would be 3. Please note that the losses are computed as positive values (in absolute terms).
We used 14 data points for the calculation, which is the default period setting for the RSI indicator in most trading softwares. This is also called the ‘look-back period.’ If you are analyzing hourly charts, the default period is 14 hours; if you are analyzing daily charts, the default period is 14 days.
The first step is to calculate ‘RS,’. As you can see in the formula, RS is the ratio of average points gained by the average points lost.
Average points gained = 24 / 14
Average points loss = 10 / 14
Relative strength (RS) = 1.714 / 0.643 = 2.667
Plugging in the value of RS into the RSI formula:
RSI = 100 – 100 / (1+2.667)
RSI = 100 – 100 / 3.67
RSI = 100 – 27.7273
RSI = 72.73
The overbought region occurs when the RSI shows significant buying pressure compared to recent trends, often signaled by the RSI rising above 70. This typically indicates that the upward momentum may soon slow down. Conversely, the oversold region, marked by the RSI falling below 30, indicates intense selling pressure, suggesting that the downward trend might end.
How to trade relative strength index?
Trading with the relative strength index (RSI) is straightforward. The RSI ranges from 0 to 100, and technical analysts typically use the 30 and 70 levels as thresholds for generating buy and sell signals.
- Buy signal: Look for long opportunities when the RSI is in the oversold range (below 30) or moving out of it.
- Sell signal: Look for short opportunities when the RSI is in the overbought range (above 70) or moving out of it.
On a trading terminal, the RSI indicator will look like this:
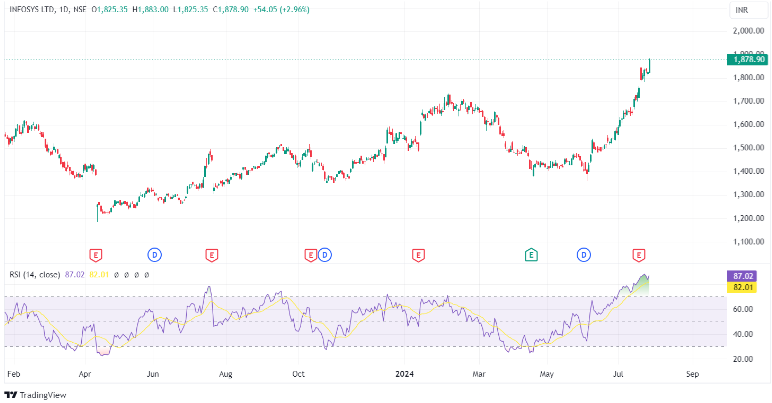
The RSI is just an indication of a stock being overbought or oversold. It is not a guarantee for price reversal. Different types of traders use RSI differently. We suggest you apply other technical analysis concepts like candlesticks, moving averages, the Dow theory, etc. to identify and take a trade, with RSI being one of the parameters for doing so.
MACD - Moving Average Convergence Divergence
The MACD is a lagging indicator, a momentum oscillator primarily used to trade trends, unlike the RSI, which identifies overbought and oversold zones. The MACD helps investors spot price trends, gauge trend momentum, and find market entry points for buying or selling.
It is constructed using two different exponential moving averages, one of which is a moving average of the other. This combination helps highlight changes in trend direction and momentum.
Here is an example of MACD on the daily chart of Infosys Ltd.:
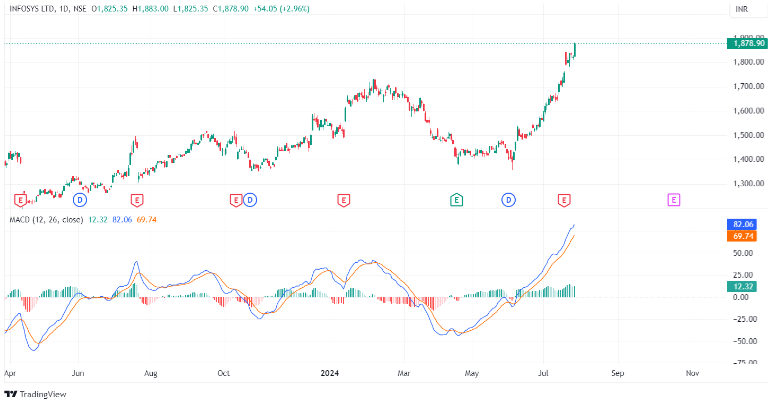
As you can see, the graph displays two moving averages. Here, one is the MACD line, calculated by subtracting the 26-period EMA from the 12-period EMA. The other line, called the signal line, is the 9-day EMA of the MACD line. In the above chart, the blue line represents the MACD line and the red line represents the signal line.
Below these lines, a histogram represents the difference between the MACD line and the signal line. The histogram is positive when the MACD line is above the signal line, indicating bullish momentum, and negative when it’s below, indicating bearish momentum. The positive histogram, above the zero line and green in color, indicates bullish momentum. Conversely, when the histogram is below the zero line and red, it signals bearish momentum. Here is another MACD example showing periods of bullish and bearish momentum:
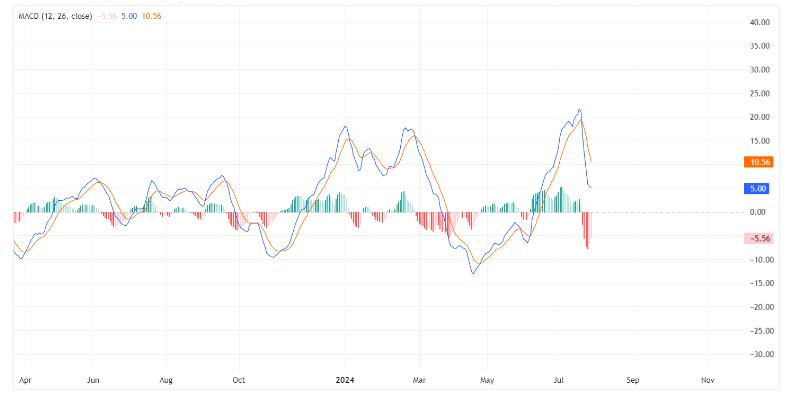
How to trade the MACD?
Trading with the moving average convergence divergence (MACD) indicator is also straightforward.
- Buy signal: Go long when the MACD line crosses above the signal line. This indicates that bullish momentum is gaining strength.
- Sell signal: Go short when the MACD line crosses below the signal line. This suggests that bearish momentum is increasing.
Supertrend
The Supertrend is a technical analysis indicator that helps traders identify market trends. This indicator combines the average true range (ATR) with a multiplier to calculate its value. Here’s how:
- ATR, or the Average True Range, measures an asset’s average price movement over time, indicating its volatility. It helps the Supertrend enhance its sensitivity and accuracy in detecting trends. The formula for its calculation is ATR = [(Prior ATR x 13) + Current TR] / 14
- The multiplier is a constant value that traders and investors employ to make the indicator more or less sensitive to price movements.
The formula for calculating the Supertrend:
Supertrend = [(High + Low) / 2 + (Multiplier) ∗ (ATR)
The ATR length affects its sensitivity and signal frequency. Short periods increase sensitivity and signals; longer periods provide fewer but more reliable signals. In most trading platforms, the default ATR period is set to 10, and the multiplier is set to 3.
Here’s how the indicator appears when applied to a chart:
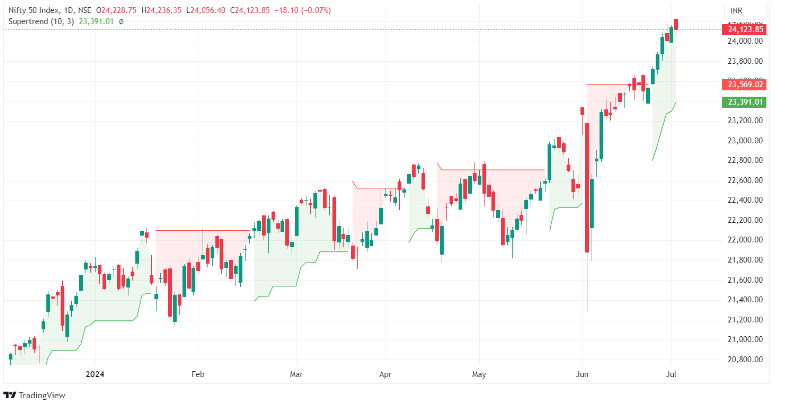
How to use the Supertrend indicator?
The line and shadows with changing green and red colors represent the Supertend indicator. It is interpreted as follows:
- When the Supertrend goes below the closing price, it turns, indicating a bullish trend.
- When the Supertrend goes above the closing price, it turns red, indicating a bearish trend.
Use the Supertrend indicator during solid uptrends or downtrends to effectively identify market trends. However, the Supertrend indicator is unsuitable for sideways markets because the price trades in a narrow range and can generate false signals or “whipsaws” in sideways or choppy markets, leading to potential losses.
It makes a superb choice for swing trading because it offers reliable entry and exit signals over a medium-term timeframe of several days or weeks. The indicator helps identify the prevailing market trend, making it easier to decide when to enter or exit a trade, maximizing potential gains from sustained price movements.
Long trade
- When the Supertrend indicator turns green, buy the stock at its closing price of that particular day.
- Keep the line of the Supertrend as the stop loss. As the price moves, the Supertrend line adjusts accordingly.
- If the Supertrend line turns from green to red, it may be considered a signal to exit the extended position.
Short trade
- When the Supertrend indicator turns red, sell the stock at the opening price of that particular day.
- Set the stop loss at the Supertrend line, and as the price moves, the Supertrend line will adjust accordingly.
- If the Supertrend line turns from red to green, it may be considered a signal to exit the extended position.
Bollinger Bands
Firstly, let’s talk about why volatility matters when we’re trading stocks. Imagine we’re fishermen living by the seaside.
We head out to sea with other fishermen every day to catch fish. But here’s the thing: we might face problems if we don’t pay attention to the weather, like high waves or fog. It’s like driving in heavy rain without knowing what’s coming – risky!
Think of fishing as trading stocks. Just like we need to know the ocean conditions for fishing, we need to understand market volatility for trading. Volatility means how much prices are going up and down. If we ignore this, we might lose money, like fishing on a stormy day.
Knowing about volatility can help us decide when to buy or sell stocks.
The Bollinger Bands are a great way to understand the volatility of a stock or index, it is made of three components:
- The middle line, which is the 20-day simple moving average of the closing prices.
- An upper band – this is the +2 standard deviation of the middle line.
- A lower band – this is the -2 standard deviation of the middle line.
Standard deviation is a statistical concept that measures how much a particular variable deviates from its average. In finance, the standard deviation of a stock’s price represents its volatility. For example, if a stock has a standard deviation of 12%, it means the stock’s price typically fluctuates by 12% from its average price.
Here is a pictorial representation of the Bollinger Bands indicator on the daily price chart of Wipro:
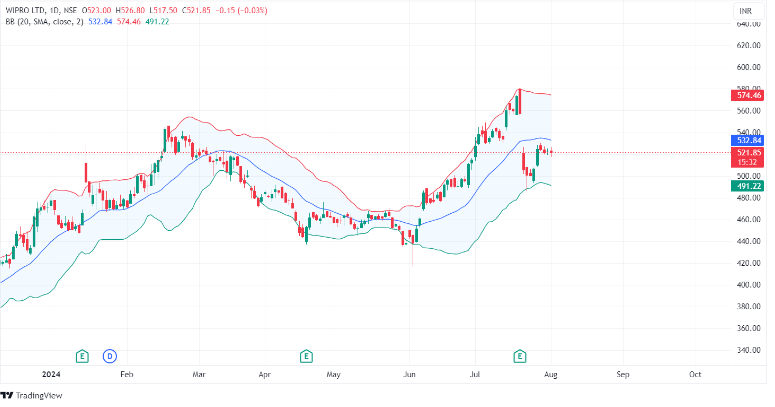
In the above chart, the three values of Bollinger bands as of August 1, 2024 are:
Current Market Price: 521.85
Upper Bollinger Band: 574.46
Middle Bollinger Band: 532.84
Lower Bollinger Band: 491.22
How to trade using Bollinger Bands?
- Long trade: Consider going long when the price touches or moves below the lower Bollinger Band. This may indicate that the asset is oversold, and a potential upward reversal could be expected.
- Short trade: Consider going short when the price touches or moves above the upper Bollinger Band. This may suggest that the asset is overbought, and a potential downward reversal could occur.
Summary
- Indicators like the RSI, MACD, Bollinger Bands, and Supertrend help traders understand market trends, momentum, and entry/exit points.
- RSI (Relative Strength Index) is a momentum indicator that identifies overbought and oversold conditions, helping spot potential reversals.
- MACD (Moving Average Convergence Divergence) identifies trends and momentum by comparing two moving averages.
- Supertrend helps identify the market trend based on the average true range (ATR) and a multiplier.
- Bollinger Bands consist of a middle SMA and two standard deviation lines, helping differentiate between volatile and non-volatile market periods.
- Indicators like these can generate buy and sell signals, identify trends, and provide insights into market volatility, aiding traders in making informed decisions.
- The effectiveness of these indicators can vary depending on market conditions; they are often more reliable in trending markets and may produce false or less accurate signals in sideways markets.
Chapter 11: Indicators - Part 3
In this chapter, we’ll explore additional indicators such as ADX, CPR, ATR, and VWAP. These tools are valuable for assessing market strength, identifying key price levels, and making informed trading decisions.
Average Directional Index
The average directional index (ADX), created by the legendary Welles Wilder in 1978, is a popular technical indicator for identifying strength. Understanding the strength of trends is essential in trading and investing, and the ADX provides valuable insights into these aspects. This is why it has become one of the most widely used technical indicators in trading.
ADX quantifies the strength of a trend. The calculations are based on a moving average of price range expansion over a specific period, typically set to 14 bars by default, though other periods can be used.
Calculation of the ADX will be as follows:
Calculate +DM (Positive Directional Movement) and -DM (Negative Directional Movement):
- +DM = Current High – Previous High (if positive and more significant than -DM)
- -DM = Previous Low – Current Low (if positive and more significant than +DM)
- Use +DM if the difference between the current high and the previous high is greater than the difference between the last low and the current low.
- Use -DM if the difference between the prior low and the current low is greater than between the current high and the previous high.
Calculate True Range (TR):
TR is the greatest of the following three:
- Current High – Current Low
- The absolute value of Current High – Previous Close
- The absolute value of Current Low – Previous Close
Smooth the 14-period averages of +DM, -DM, and TR; it is nothing but a calculation of previous averages.
First, calculate the sum (smoothing) of the first 14 readings of TR, +DM, and -DM. This gives the initial smoothed values.
To find the next smoothed value, use this formula:
- Next 14th day TR = Previous 14TR – (Previous 14TR / 14) + Current TR
- Apply the same formula to +DM and -DM.
Calculate +DI and -DI:
- +DI = (Smoothed +DM / Smoothed TR) * 100
- -DI = (Smoothed -DM / Smoothed TR) * 100
Calculate Directional Movement Index (DMI):
DMI = [|(+DI) – (-DI)|] / (+DI + -DI) * 100
Calculate ADX:
First, average the DMI values over 14 periods to get the initial ADX value. To continue, use the formula:
ADX = ((Previous ADX * 13) + Current DMI) / 14
Knowing the exact formula of a technical indicator is optional, as most trading software has this built-in. The main focus is on the signals it provides. Now, let’s explore how the ADX can help generate trading signals.
How to trade with the ADX indicator?
The ADX is a momentum-based indicator. When the ADX value rises, it indicates the trend strengthening, whether bullish or bearish. Conversely, if the ADX value decreases, it suggests that the trend’s strength is weakening.
ADX has a value ranging from 0 to 100. Here is a table summarizing the values:
ADX Value | Trend Strength |
0-25 | Non-trending market or range-bound market |
25-50 | Strong trend |
50-75 | Powerful trend |
75-100 | Solid trend (rarely happens and can be considered unsustainable) |
Based on the ADX value, we can determine whether the trend’s strength is bullish or bearish. When plotted on a chart, the ADX indicator will look something like this:
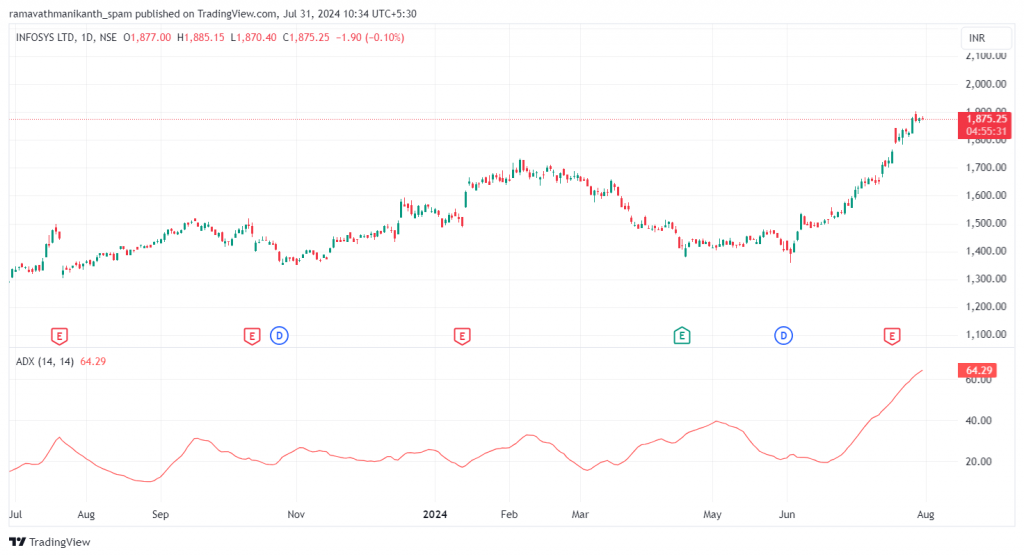
In the chart above, an ADX value of 65 indicates a strong trend, suggesting that Infosys has experienced a significant up-move, and the rally is likely to continue.
Central Pivot Range
Also known as the CPR, this technical indicator is handy for intraday trading, as it helps identify key price points for setting up trades. It’s built on the concepts of support and resistance, which we have learnt in earlier chapters.
It has three components:
1. Pivot
2. Bottom Central Pivot (BC)
3. Top Central Pivot (TC)
These are relatively easy to calculate:
Pivot = (High + Low + Close) / 3
Bottom CPR = (High + Low) / 2
Top CPR = (Pivot – BC) + Pivot
CPR (Central Pivot Range) offers notable advantages by providing traders with precise entry and exit points. It helps set up stop-loss levels and determine key price points. The upper and lower ranges derived from the central pivot point allow for the placement of stop-loss orders at predetermined levels, which enhances risk management and helps traders make informed decisions.
Here are how the CPR lines look when plotted on a price chart:
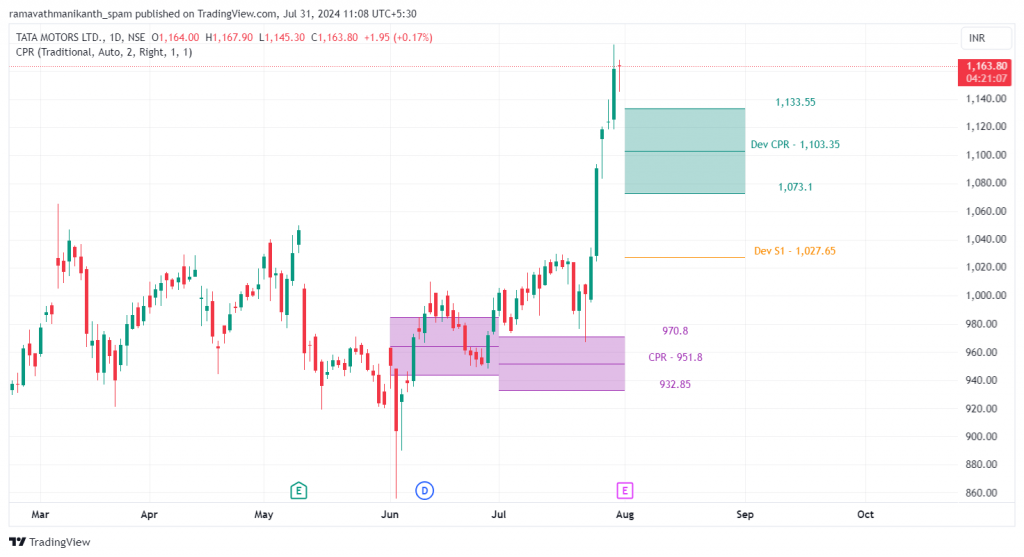
How to trade using the CPR indicator?
As we know, CPR (Central Pivot Range) consists of three levels: TC (Top Central), BC (Bottom Central), and Pivot.
If the current market price is above the top central line, it indicates a buying opportunity, like the chart above.
Another scenario occurs when the current market price is trading below the bottom central line. This situation suggests a shorting opportunity.
Now, let’s move on to another indicator, the ATR (Average True Range).
Average True Range
The ATR (Average True Range) is a technical indicator used to measure market volatility. It is typically calculated over 14 periods, which can be intraday, daily, weekly, or monthly, depending on the time frame you’re looking at.
ATR is very useful for setting stop-loss levels and targets, as it signals changes in market volatility. The calculation typically uses 14 periods as the lookback.
The formula for the ATR is
ATR = (Previous ATR * (n – 1) + True Range) / n
Where “n” is the number of periods (usually 14).
Step 1: Calculate the True Range (TR) for each day:
True Range is the greatest of the following:
- Current High – Current Low
- The absolute value of Current High – Previous Close
- The absolute value of Current Low – Previous Close
For Day2:
Current High – Current Low = 104 – 99 = 5
|Current High – Previous Close| = |104 – 100| = 4
|Current Low – Previous Close| = |99 – 100| = 1
TR = max(5, 4, 1) = 5
For Day-3:
Current High – Current Low = 105 – 101 = 4
|Current High – Previous Close| = |105 – 103| = 2
|Current Low – Previous Close| = |101 – 103| = 2
TR = max(4, 2, 2) = 4
Continue this for each day until you have the TR values of all 14 days.
Step 2: Calculate the initial ATR using the first 14 days
ATR is the average of the True Ranges over a set number of days, typically 14 days.
Initial ATR = (Sum of first 14 TR values) / 14
Step 3: Calculate subsequent ATR values
Once the initial ATR is calculated, use the following formula for subsequent days:
ATR = [(Previous ATR * (n – 1)) + Current TR] / n
where n is the number of periods
Example Calculation:
Let’s say the first 14 TR values sum to 70, giving an initial ATR of 5. For Day-15:
TR (Day-15) = 6 (hypothetical value)
ATR = [(5 * (14 – 1)) + 6] / 14
ATR = [(5 * 13) + 6] / 14
ATR = (65 + 6) / 14
ATR = 71 / 14
ATR = 5.07
This ATR value of 5.07 represents the average true range over the past 14 days, indicating the market’s volatility.
The higher the ATR, the higher the volatility, and the lower the ATR, the lower the volatility.
How to trade using the Average True Range?
Check the ATR value to understand the stock’s volatility.
Setting Stop-Losses
- Long Position: If you’re buying a stock, you can use the ATR to set the stop-loss at a level below the entry price. A standard method is to use 2 x ATR. For example, if the ATR is 2 and you enter a trade at ₹100, set the stop-loss at ₹96 [100 – (2 x 2)].
- Short Position: If you’re selling a stock (shorting), you can use the ATR to set the stop-loss above the entry price. If you enter at ₹100 with an ATR of 2, place the stop-loss at ₹104 [100 + (2 x 2)].
Let’s understand with an example.
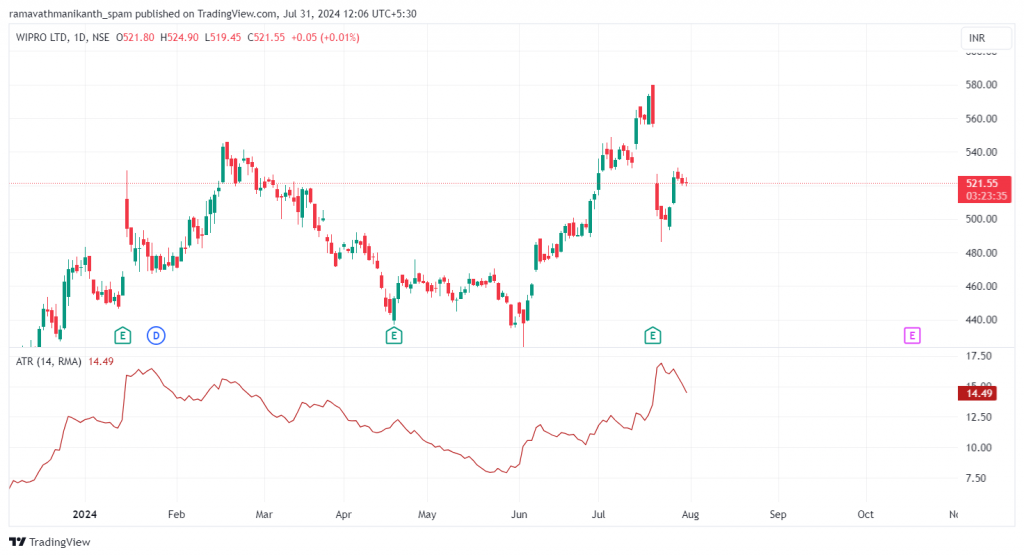
Based on the chart provided, the current ATR (Average True Range) value for Wipro Ltd. is approximately 14.49. Here’s how you can use this ATR for a long trade in the stock:
- Entry Point: Suppose you enter a long trade at the current price of Rs. 521.55.
- Stop Loss: Use the ATR to set your stop-loss level. A standard method is to place the stop-loss at 2 x ATR below the entry price.
ATR = 14.49
Stop Loss = Entry Price – (2 x ATR)
Stop Loss = 521.55 – (2 x 14.49)
Stop Loss = 521.55 – 28.98 = ₹492.57
Using the ATR, we can similarly calculate the stop loss for a short position. However, it’s crucial to take positions based on overall market sentiment. You can combine your knowledge of candlestick patterns and other technical indicators to do this effectively.
Volume Weighted Average Price
As you gain experience trading, you’ll realize how crucial volume is in confirming trends. This technical indicator, the volume-weighted average price (VWAP), combines volume with price. It represents the average price of a stock, weighted by the trading volume.
Similar to the moving average, the VWAP calculation experiences a lag because it relies on historical data. This characteristic makes it more suitable for intraday trading.
The formula for VWAP is
VWAP = ∑ (Volume x Price) / ∑Volume
Where:
– Price is the typical price for the period, calculated as (High+Low+Close)/3
– Volume indicates the number of shares traded during that period
ATR = (Previous ATR * (n – 1) + True Range) / n
Where “n” is the number of periods (usually 14).
Let’s assume we have the following data for a stock:
Period | High | Low | Close | Volume |
1 | 105 | 100 | 102 | 200 |
2 | 107 | 101 | 104 | 150 |
3 | 110 | 103 | 109 | 250 |
Step 1: Calculate TP (Typical Price) for each period:
- TP (1) = (105 + 100 + 102) / 3 = 102.33
- TP (2) = (107 + 101 + 104) / 3 = 104.00
- TP (3) = (110 + 103 + 109) / 3 = 107.33
Step 2: Calculate TPV (Typical Price x Volume) for each period:
- TPV (1) = 102.33 x 200 = 20466
- TPV (2) = 104 x 150 = 15600
- TPV (3) = 107.33 x 250 = 26832.5
Step 3: Calculate cumulative TPV and cumulative Volume:
- Cumulative TPV = 20466 + 15600 + 26832.5 = 62898.5
- Cumulative Volume = 200 + 150 + 250 = 600
Step 4: Calculate VWAP:
- VWAP = Cumulative TPV / Cumulative Volume
- VWAP = 62898.5 / 600 = 104.831
The VWAP for these three periods is 104.83. This value gives the average price the stock has traded, weighted by the trading volume
How to trade the VWAP?
VWAP is commonly used to identify the trend direction. Simply put, if the current price is above the VWAP line, it indicates a bullish trend, suggesting buying opportunities. Conversely, if the current price is below the VWAP line, it indicates a bearish trend, suggesting selling or shorting opportunities.
Entry and Exit Points:
Buying (Long Position)
- Entry: Consider buying when the price crosses above the VWAP line. This suggests the stock is gaining strength.
- Stop Loss: Place the stop loss slightly below the VWAP line to protect against downside risk if the price drops back below the VWAP.
Selling (Short Position)
- Entry: Consider selling or shorting when the price crosses below the VWAP line. This indicates that the stock may be weakening.
- Stop Loss: Place the stop loss slightly above the VWAP line to protect against the risk of the price rising back above the VWAP.
Let’s look at an example by analysing the chart of Infosys with the VWAP indicator.
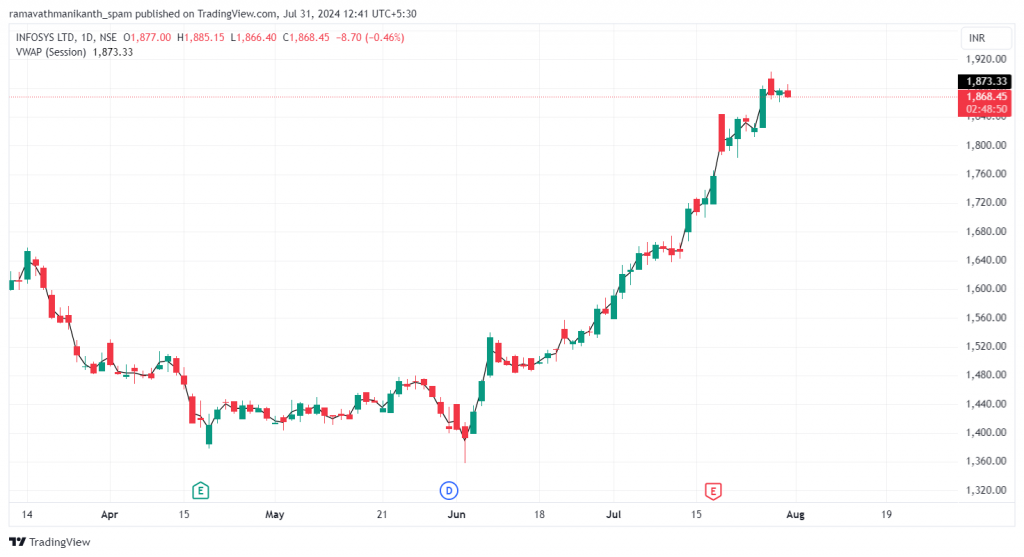
Current Price: ₹1,868.45
VWAP: ₹1,873.33
Analysis based on VWAP
Since the current price is above the current VWAP, a long position should be considered. A stop loss should be set slightly below the VWAP level to protect against a downside move, for example, at ₹1,870.
Summary
- ADX (Average Directional Index) measures trend strength. Ranging from 0-100, a rising ADX indicates a strong trend, while a falling ADX signals a weakening trend.
- CPR (Central Pivot Range) helps identify key price levels and set stop losses. It includes Pivot, Top Central (TC), and Bottom Central (BC) lines. A price above TC is suggestive of buying opportunities, while a price below BC is suggestive of selling opportunities.
- ATR (Average True Range) measures market volatility. It is helpful for setting stop loss levels and entry points, with higher ATR levels indicating higher volatility.
- VWAP (Volume Weighted Average Price) combines price and volume to determine the average trading price. A price greater than the VWAP is considered bullish and a price lesser than the VWAP is considered bearish.
Chapter 12: Entering & Exiting a Trade
In this final chapter, we’ll outline a simple process for utilizing technical analysis in trading. Whether new to the markets or experienced, structuring your trade correctly can improve your trading decisions. We’ll also discuss choosing the right timeframe based on your objectives.
We aim to provide a step-by-step guide on integrating the learned concepts into your trading strategy. You’ll navigate the markets more effectively by learning when to enter or exit trades, setting stop-loss levels, and identifying market trends. We’ll also cover risk management.
Defining your objective & selecting the right time frame
Three factors that significantly shape our trading objectives are:
- Financial objectives
- Time commitment
- Risk tolerance
Financial objectives
Are you viewing the stock market as a long-term investment or aiming to achieve a certain income level through trading? Your financial objectives influence your trading strategies and risk management selection, helping you set realistic, achievable goals. Whether you seek steady, long-term growth or quick, short-term returns, your goals will define your approach to the market.
Time commitment
Only some people can sit in front of a screen from the market open until 3:30 PM; we all have different schedules and responsibilities. This factor will largely determine your trading style—intraday, swing, or long-term investing. Understanding your available time will help you choose a trading approach that aligns with your lifestyle and daily commitments.
Risk tolerance
Lastly, your risk tolerance plays a significant role in shaping your objectives. If you have low-risk tolerance, then safer, long-term investments focusing on capital preservation is a good option. On the other hand, if you are comfortable with higher risk, pursuing an aggressive trading strategy aiming for higher returns would be more suitable. Understanding your risk tolerance will ensure your trading style aligns with your comfort level and financial stability.
Choosing the appropriate time frame becomes relatively straightforward if you decide on an objective in trading because they are closely linked. For instance, if someone aims to make quick profits, they prefer shorter time frames, such as intraday or swing trading. This involves frequent trading within minutes, hours, or days, requiring a more active and immediate approach. On the other hand, if the goal is steady growth and capital preservation, a longer time frame, such as positional trading or long-term investing, might be more suitable. This approach involves holding positions for weeks, months, or even years, focusing on fundamental analysis and broader market trends.
Here is a summary of all the timeframes and how much time should be ideally dedicated to them:
Trading Time Frame | Description | Ideal Time Dedication |
Scalping | Very short-term trading, holding positions for seconds to minutes. Focus on small price movements. | Full-time, constant monitoring is required throughout the trading session. |
Intraday Trading | Trading within a single trading day. Positions are closed before the market closes. | Several hours daily; requires monitoring throughout the day, especially during market opening and closing. |
Swing Trading | Holding positions for several days to a few weeks. Capitalizes on short- to medium-term trends. | Moderate; typically, 1-2 hours per day for market analysis and monitoring open positions. |
Position Trading | Holding positions for weeks to months. Based on longer-term trends and fundamental analysis. | Limited daily monitoring; more intensive analysis during weekends or after market hours, around 2-3 hours per week. |
Long-Term Investing | Holding positions for years. Focus on fundamental analysis and long-term growth. | Minimal daily attention; mainly requires a few hours per month for portfolio review and rebalancing, plus regular updates on financial news and company performance. |
As a thumb rule, the higher the timeframe, the more reliable the trading signal is. For example, a bullish engulfing pattern in a 15-minute timeframe is far more trustworthy than a bullish engulfing pattern in a 5-minute timeframe. Keeping this in perspective, one has to choose a timeframe based on the intended length of the trade.
Lookback Period
As a beginner, it can be unclear how many candles to consider for trading. The lookback period is the number of candles you review before trading. For instance, a lookback period of two weeks means you analyze today’s candle within the context of the past two weeks of data. This helps you understand today’s price action with respect to past market movements, giving you insight into shorter-term trends and potential price patterns.
For swing trading opportunities, an ideal lookback period is between 6 months to 1 year. This timeframe provides a comprehensive view of market trends and potential setups, helping you make well-informed trading decisions. In contrast, for scalping, focusing on the last five days of data is more effective, as it allows you to capture the most recent price movements and respond quickly to market changes.
|
Trading Style |
Lookback Period |
Purpose |
|
Scalping |
Last 5 days |
Capture the most recent price movements for quick response. |
|
Intraday Trading |
1-3 weeks |
Identify short-term trends and key levels within the trading day. |
|
Swing Trading |
6 months – 1 year |
Comprehensive view of market trends and potential setups. |
|
Position Trading |
1-2 years |
Analyze longer-term trends and major support/resistance levels. |
|
Long-Term Investing |
3-5 years |
Focus on long-term trends and major support/resistance zones. |
When plotting support and resistance levels, extending the lookback period to at least two years is essential. This longer timeframe helps identify significant historical levels that could influence current price action, ensuring a more accurate analysis of potential market behavior.
Trading Universe
There are ~5,000 stocks listed on the Bombay Stock Exchange (BSE) and ~2,600 on the National Stock Exchange (NSE). It’s well known that scanning for opportunities across thousands of stocks daily can be overwhelming. Over time, narrowing down on a set of stocks you feel comfortable trading in is essential. This set of stocks becomes your “Trading Universe.” By focusing on this specific universe, you can more effectively scan for and identify potential trading opportunities daily, making the process more manageable and focused.
Here are some key pointers to keep in mind while defining a trading universe:
1. Make sure the stock you’re trading in is liquid. You need someone to sell when you’re buying and buy when you’re selling.
- One way to ensure this is to gauge the bid-ask spread; the less spread, the more liquid the stock is.
- Another way would be to check the volume, i.e., the number of shares traded. Many traders set minimum criteria of considering only those stocks with a daily volume of at least 50,000.
2. Ensure the stock is in the ‘EQ’, i.e., equity segment, which allows for day trading. Stocks that are part of the F&O segment are subject to getting banned for intraday trading. While day trading isn’t recommended for beginners, sometimes you may start a trade intending to hold it longer but find that your target is reached on the same day. In such cases, closing the position within the day is okay, which is possible with ‘EQ’ segment stocks.
3. Try avoiding operator-driven stocks. Unfortunately, there is no quantifiable method for identifying operator-driven stocks. Staying updated with the latest news can help you avoid such stocks.
It is recommended that you start with the Nifty 500 as your opportunity universe, especially for swing and positional trading, as most stocks in this index comply with the above 3 criteria.
Nifty 500 is a stock market index in India that showcases the top 500 companies listed on the National Stock Exchange (NSE). These companies are chosen based on their market capitalization, which measures a company’s value in the stock market. To calculate market capitalization, you multiply the company’s current share price by the total number of its outstanding shares.
Nifty 500 has various stocks from all the sectors IT, financial services etc.,
Trading process
Let’s discuss how to select stocks for trading, similar to applying filters while finding your favourite product on an online marketplace.
Assuming we are swing traders, let’s recap defining our objectives, shortlisting a stock, and taking a trade. This means that:
- Our objective is to make quick returns over a few days or weeks
- We would have to give 1-2 hours per day for market analysis
- We can tolerate moderate risk
- Our trading universe would be the Nifty 50
- Our lookback would be between 6 months to 1 year. We would be looking at the past 1-2 years while plotting the support and resistance level
Here’s a good process you can follow:
- First, create a watchlist from the Nifty 500 universe. Recall that we need liquid stocks not part of the ‘F&O’ segment. We can add more conditions to trim our watchlist further. We feel confident trading on a positive day, so we will add another criterion of the stock being bullish on the current day. You can use other filters as well. Some examples are choosing stocks trading with above-average volumes on that day, looking at stocks from a specific sector, or using indicators, like only shortlisting stocks whose RSI is above 70.Many stock scanning tools will help you filter stocks based on your criteria. We created the following scanner to shortlist stocks as per the criteria we mentioned: https://chartink.com/screener/nifty-500-swing-trading-beginner.
- Next, look at the stocks’ charts that the scanner shortlists. As of this writing, our scanner has shortlisted 43 stocks.
- While looking at the stock charts, try plotting the support and resistance levels. Remember, a lookback period of 1-2 years is deal for this.
- Next, look at the latest 15-20 candles. Is the stock forming higher highs or lower lows, or is the trend looking like it’s changing direction? Once we know the stock’s momentum, notice the latest 3-4 candles. Is there a candlestick or chart pattern being formed?
- If you find any recognizable pattern, shortlist this stock for further investigation.
The final step is to analyze all the shortlisted stocks from our trading universe that exhibit recognizable patterns. Once we identify such patterns, we will delve deeper into each stock, trying to decode the pattern and understand it better. Here’s an example:
- We have to see how reliable the pattern is. For instance, if we spot a head and shoulders pattern, we will examine the symmetry and proportion of the shoulders and head to determine the pattern’s reliability.
- The prior trend is crucial for any pattern. For a bullish pattern to be valid, the preceding trend should be downward. Conversely, for a bearish pattern to hold, the preceding trend should be upward.
- If all these are in place, we can analyze the chart further.
- Another critical factor to look at is the volume. It should be at least higher than the 10-day average. This confirms that the stock or index has strong momentum. Realize that for large caps, it is unusual to spot a stock trading at 2X of its average on a good trading day, whereas it is common for mid-caps and small caps to trade at even 3X to 5X of their average volumes on good trading days.
- If both the candlestick pattern and volume confirm the trade, we then check the support level for a long trade and the resistance level for a short trade.
- These levels should align as closely as possible with the stop-loss defined by the candlestick pattern. If the support or resistance level is more than 5% away from the stop-loss, we would be hesitant to continue evaluating that chart and rather move on to the next one.
- If steps 1 to 6 are satisfactory, we will calculate the risk-to-reward ratio (RRR). To calculate the RRR, we would first establish the target by plotting the support/resistance level or by defining the target depending on the candlestick or chart pattern we decided to trade on. The minimum risk-to-reward ratio should be at least 1.5.
- Finally, we look at some indicators to get a confirmation for the trade. It is good to look at moving averages and the RSI indicator.
Sometimes, we may not find any stocks that pass our checklist. In such cases, avoiding trading on those days is the best course of action. Remember, not making a loss is also a form of profit.
After placing a trade, you should wait until the target is reached or the stop-loss is triggered. It’s an excellent practice to trail our stop-loss as the trade progresses. We should avoid making changes if the trade meets all our checklist criteria. Trusting the well-planned trade increases the likelihood of success, so it’s essential to remain patient and confident.
Managing your trades
After successfully entering a trade, the next crucial step is to manage our trades while holding our positions effectively. This involves three key components: risk management, capital deployment, and trailing our stop loss. Let’s delve into these aspects to ensure a well-rounded trading strategy.
Risk management
Firstly, we must decide how much capital we will risk per trade. This depends on our risk tolerance. A good way to quantify the risk tolerance is by deciding the total amount we will lose per trade. Assuming our risk tolerance is 1%-2%, if we are trading with a capital of ₹1,00,000, we should be comfortable losing ₹1,000 to ₹2,000 in a single trade. Setting up the stop loss is crucial, and we should use our technical analysis concepts. We can determine the stop loss using support and resistance levels, the Central Pivot Range (CPR), or any method that suits us best.
Secondly, let’s look at position sizing, i.e., how much capital should be deployed for each trade. This helps to identify the number of shares or contracts to buy or sell so that you can manage risk and maximize potential returns.
Here’s a good formula:
Position Size = (Account Equity * Risk Percentage) / (Entry Price – Stop Loss Price)
where,
– Account Equity: The total amount of money you have in your trading account
– Risk Percentage: The small portion of your money you are willing to lose on one trade (usually 1-2%)
– Entry Price: The price at which you buy the stock
– Stop Loss Price: The price at which you will sell the stock to prevent further losses
Here is a simple example.
Assume we decide to buy shares of Reliance Industries. The current price (Entry Price) is ₹2,000 per share, and based on technical analysis, we set our stop loss at ₹1,950 (Stop Loss Price) to limit our potential loss to ₹50 per share.
Using the position sizing formula:
Position Size= (AccountEquity * Risk Percentage) / (Entry Price − Stop Loss Price)
Position size = (1,00,000 * 0.02) / (2,000−1,950)
Position size = 1,00,000 * 0.02) / (2,000 – 1,950)
Position size= 2,000 / 50
Position size= 40
So, we should buy 40 shares of Reliance Industries. If the stock hits our stop loss price of ₹1,950, we will lose only ₹2,000, which is within our risk tolerance.
Thirdly, we need to set a target based on the risk-to-reward ratio. A common practice is to ensure a ratio of at least 1.5:1. For every Rs 1 we risk, there should be a potential reward of 1.5.
Capital deployment
The next step is to focus on capital deployment. Proper capital deployment is essential to avoid putting too much money into one trade. Let’s look at how to use our capital effectively to make the most profit while keeping risks low.
Recall the famous saying by stock market king Warren Buffett,
In quote box – “Don’t put all your eggs in one basket.”
When we are trading, it is very important to keep focus on a manageable number of trades.
Imagine you’re a juggler. If you juggle too many balls, you’ll likely drop some. The same goes for trading. The key is to find a balance between having enough trades to diversify but not so many that you can’t keep up.
Start with just 1-2 trades at a time. As they become manageable, you can expand to 3-4 stocks. This will allow you to stay updated on each stock’s movements without feeling overwhelmed.
By focusing on fewer stocks, you can closely monitor news, earnings reports, and price movements. This allows you to make quick decisions because you know your stocks well. Additionally, tracking fewer stocks reduces stress and minimizes the chances of making mistakes.
In the morning, check pre-market news and identify any major events that might affect your stocks. During the day, monitor price movements and trading volumes. In the evening, review the day’s performance, update your trading journal, and adjust your strategy if needed.
Another effective way to manage our capital is by deploying it in phases rather than simultaneously entering a trade with the entire set capital.
For example, if trading with a capital of ₹1,00,000, we might initially deploy ₹75,000. If the trade continues to go our way, we can add another ₹10,000 and another ₹15,000, incrementally increasing our position based on our risk tolerance and trade confidence. This approach allows us to manage risk more effectively than going all-in with a single trade.
Although the profit on our total capital deployed in the trade may be lower, we are ensuring that capital is not making a loss, at the least.
Trailing stop losses
You must be familiar with the stop loss concept, which helps limit our losses if the stock price goes down. However, sometimes, a trade goes in our favor for a while before reversing and hitting our stop loss. To avoid this, it is better to use a trailing stop loss. This means adjusting our stop loss level upward as the stock price rises. We can’t do that randomly though. Strategically, here are five ways of how it can be done:
- A standard method is to set a trailing stop loss at a certain percentage below the highest price reached (for long trades) or above the lowest price reached (for short trades). For example, if you had set a 5% stop loss rule when you entered at ₹100, the stop loss would be at ₹95. If the price goes to ₹105, the new stop loss would be 5% below ₹105, which is at ₹99.75.
- You can also effectively implement trailing stop losses using the Average True Range (ATR). The ATR helps measure market volatility, and you can set a trailing stop at a multiple of the ATR value from the current price. A quick recap on using the ATR indicator might help.
- Another method is to use moving averages as a dynamic stop loss level. By trailing the stop loss at the 20-day moving average, for example, you can follow the stock’s trend while allowing for normal price fluctuations. Both methods provide a systematic approach to protecting your profits and managing risk as the trade moves in your favor.
- You can also move your stop loss to crucial support or resistance levels as the trade progresses. For instance, the Central Pivot Range (CPR) can help identify significant price levels where the stock may find support or resistance.
- Fibonacci levels are also helpful in setting trailing stop losses, as they indicate potential reversal points based on the stock’s recent price movements. By adjusting your stop loss to these critical levels, you can better protect your profits and allow the trade to develop within the market’s natural fluctuations.
Fibonacci levels
These are key price points on a stock chart that indicate where the price might reverse or pause. These levels are based on a mathematical sequence and are used to identify potential support and resistance areas.
Nifty 500 has various stocks from all the sectors IT, financial services etc.,
Summary
- Determine your trading style based on time commitment and financial goals, choosing time frames that align with your objectives.
- For swing trading, use a lookback period of 6 months to 1 year; for scalping, focus on the last five days; and for drawing support and resistance levels, use at least two years.
- Focus on a manageable set of stocks, ensuring they are liquid and in the ‘EQ’ segment; stick to Nifty 500 for simplicity and reliability.
- Risk 1% to 2% of capital per trade and ensure a Risk-to-Reward Ratio (RRR) of at least 1.5:1.
- Diversify across multiple stocks, use a phased entry style to manage risk effectively, and avoid putting all capital into a single trade.
- Adjust the stop loss upwards as the stock price rises using ATR or moving averages to dynamically trail the stop loss. Set stop losses at critical support or resistance levels to protect profits.
- Look for recognizable patterns and confirm with volume. Ensure that patterns align with prior trends. Check support and resistance levels relative to the stop loss. Calculate and confirm RRR before entering the trade.
- Place trades based on the checklist criteria, avoid making changes once the trade is placed and remain patient and confident in your well-planned trades.
- If no stocks pass the checklist, avoid trading that day and recognize that preventing losses is also a form of profit.
Fundamental Analysis Guide
Learn to analyze companies, read financial statements, and invest for the long term with our comprehensive guide on fundamental analysis.
Chapter 1: Introduction to Fundamental Analysis
How can you tell if a stock is worth its price? In this chapter, we will uncover how investors look beyond the stock price at its value to generate wealth in the long term. We will touch upon the concept of fundamental analysis and how to approach it.
"Price is what you pay, and value is what you get."
- Famed value investor Warren Buffett
The search for value makes a housewife, a businessman, a student, and a secretary an investor. Deep inside, everyone wants to convert ₹50,000 into ₹1 crore. But it requires time, patience, and an optimistic outlook.
Benjamin Graham, the father of value investing, said, “A stock is not just a ticker symbol or an electronic blip; it is an ownership interest in an actual business, with an underlying value that does not depend on its share price.”
Investors use what is known as fundamental analysis to identify this “underlying value,” i.e., to look at a stock beyond its price at its business and management quality.
What is Fundamental Analysis?
By definition, being “fundamental” means being the basic constituent of a system, a foundation without which the entire system will collapse. For a human being, water, air, and food are the “fundamentals” of life.
Similarly, cash inflows (through revenue, investment, capital) and cash outflows (expenses, debt, investing in the business) are the fundamentals of any business. When the cash flows in and out smoothly, the fundamentals of a business stay strong. Driving this cash flow is the business model of a company. A business model defines how a company makes money, which products or services it will sell, to whom, and how (marketing, branding, and distribution). The model also defines the expenses and how the company will raise money to cover these expenses.
Fundamental analysis is understanding the fundamentals or vitals of a business: mapping their historical trend and comparing them with peers, analyzing the factors affecting these vitals, and determining what management is doing to keep them healthy.
What are the fundamentals of a business?
Let’s start with the question at the core of all business activities: What is the main objective of doing business? The answer is quite straightforward: to make profits by offering some form of value. To do this, you need to focus on the three basic fundamentals of any business:
- Revenue, i.e., how a business makes money
- Net profit, i.e., how much money is it able to keep
- Cash flow, i.e., how much of this money is real
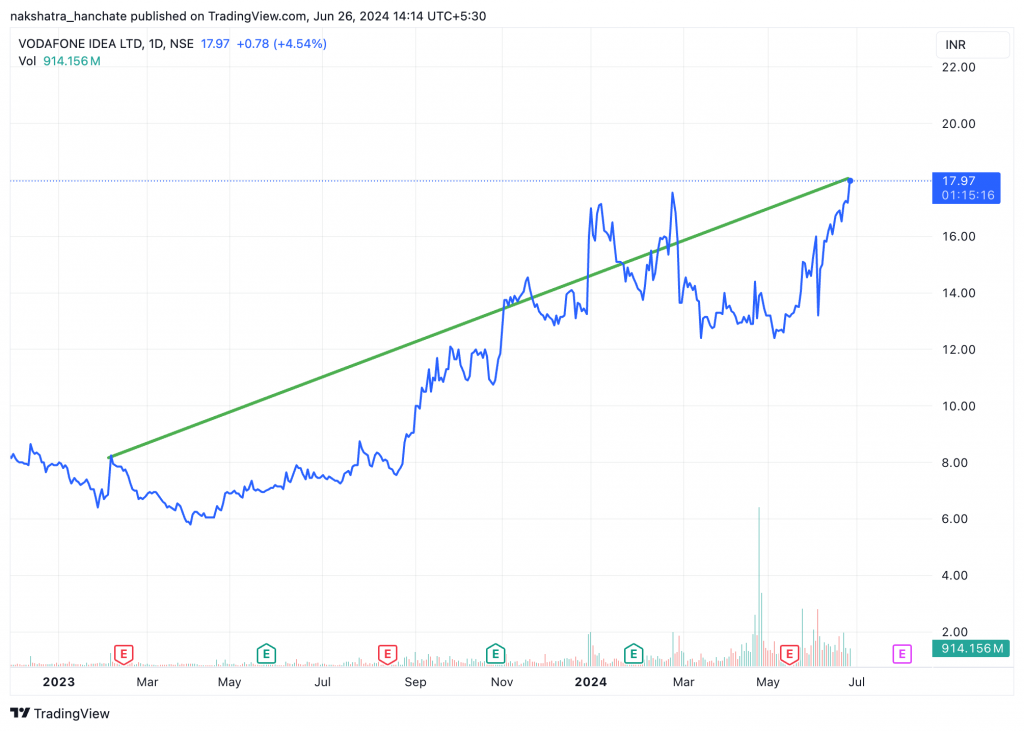
Any problems in these three fundamentals can shake the foundation of a company.
One of the biggest examples of this is the 2024 Paytm crisis, when the RBI stopped all new deposits into the Paytm Payments Bank on March 15, 2024. This restriction directly impacted Paytm’s revenue, sending the shares down, whereas rivals PhonePe and Airtel Payments Bank’s revenues surged as they poached Paytm’s customers.
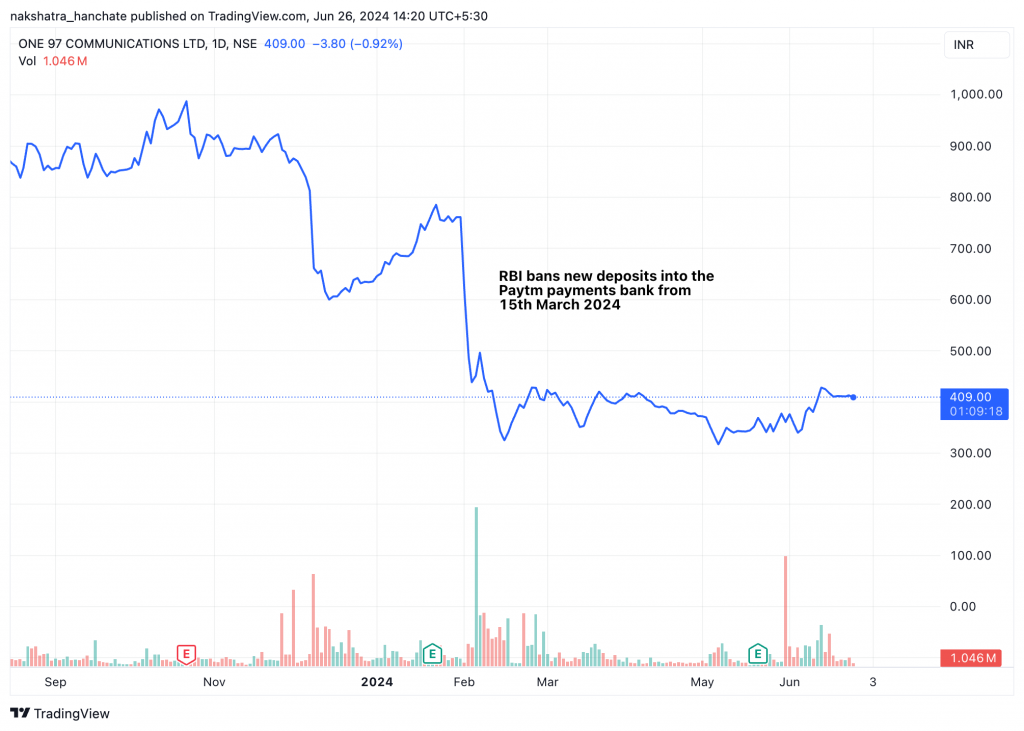
Intrinsic Value
Intrinsic value is the underlying value of a stock that investors calculate based on what they perceive about the company’s future cash flow potential. When you determine the intrinsic value of a stock, you can compare it with the current stock price to determine if the stock is overvalued or undervalued by the market.
You can use these core fundamentals to arrive at an intrinsic value that you believe justifies the company’s worth. The intrinsic value is determined using fundamental analysis to forecast the company’s future cash flows.
Why does one need fundamental analysis?
Let’s take the example of Eicher Motors, the maker of the famous Royal Enfield bikes. Today, you would have a rugged bike if you had invested ₹55,000 in a Royal Enfield in 2004. But if you had invested the same amount in Eicher Motors shares instead, today you would have ₹1.5 crores – enough to buy 37 of the Super Meteor 650 bikes, Royal Enfield’s most expensive model in India!
What happened in 2004 that fundamental investors saw, but the market didn’t?
30-year-old Siddhartha Lal took over as COO of Eicher Motors when the stock was trading at ₹17.5 a share and made a difficult choice: to prune its 15 businesses, where it was a mediocre player, into just two businesses where it had the potential to be the market leader. At ₹17.5, the stock was actually trading at double the price it was trading two years ago (₹8.4 in January 2002).
This ₹17.5 is the price you would have paid in 2004 to get one-share ownership in a company that went from selling 50,000 bikes in 2009 to 835,000 in 2024.
Focus on business growth; stock price appreciation will follow
Siddhartha Lal’s vision was to be the master of one instead of a jack of all trades. He put the company’s focus and resources on improving the Enfield bikes. A passionate biker, he knew what the customer wanted and ensured his team knew it. Riding the Enfield with his team for hundreds of kilometers, he identified places for improvement and soon perfected the bike.
Royal Enfield offered neither in a market obsessed with mileage and fuel efficiency. What it did offer was a stature and legacy, and that too at a premium price. The company capitalized on this legacy. It took four years for the company to pick up sales momentum. The company’s fundamentals improved as production costs reduced and sales volumes surged.
It was only in 2009 that Eicher Motors’ stock began taking a vertical jump from ₹20.84 to over ₹3,000 in 2018—ten straight years of the rally! While the stock saw a rough patch between 2018 and 2020, its fundamentals remained strong, and it rallied to ₹4,700.
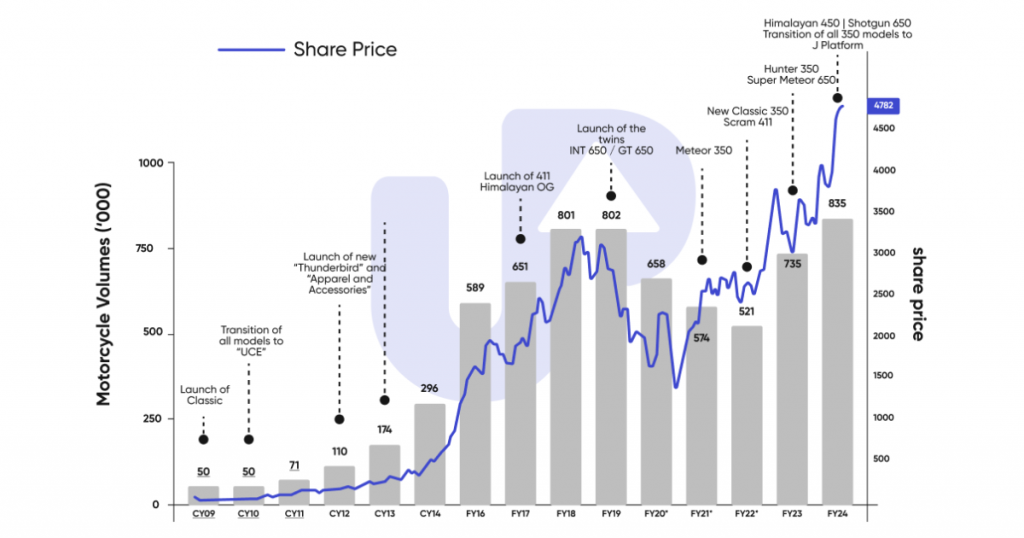
Siddharth Lal spent four years refining the product and manufacturing, enhancing the company’s value by focusing on its strengths. The ₹17.5 price might have looked high in 2004. However, a fundamental investor looked beyond the stock price at the business and the management, who were focused on long-term growth and generating shareholder value. Even today (2024), the company is focused on Royal Enfield and VE commercial vehicles, a partnership with Volvo to make trucks.
This doesn’t mean only premium brands generate high returns. It also depends on their business strategy and focus and whether the potential growth estimate seems achievable.
This is one of the many examples of how fundamental analysis can create wealth for those who remain invested.
Fundamental analysis is all about knowing the ‘Why?’: Why do you want to invest in this sector or this stock? Why do you think your thesis will play out?
Technical Analysis vs Fundamental Analysis:
In the stock market, there are two types of people: Traders and Investors.
Traders use technical analysis to make a trade. They enter the market to buy low and sell high to make quick profits. They are on top of all the updates and deeply understand every asset class – gold, equity, currency, commodity – and the market dynamics.
They use a combination of technical analysis, number crunching, analyzing huge amounts of data sets, identifying chart patterns, and implementing market strategies. In technical analysis, a stock is just a ticker trading on the stock exchange, having price momentum and chart patterns. Traders need behavioral qualities like risk-taking, analytical thinking, and number-based decision-making to make a sound trade.
Then, some investors are in the market to generate wealth over the long term. They take time to find the stocks they feel confident about and stay invested for several years. News and events do not affect them as long as the company has what it takes to grow.
Traders and investors react to a situation differently. Take the Union Budget, which was announced by the government on February 1 every year, for instance.
Ashok is a trader and believes the Budget will focus more on defense. Hence, he buys defense stocks a week ahead of the budget and sells them after the budget is announced. Similarly, he buys space stocks before the Chandrayaan-3 launch and sells them after a successful launch. Here, Ashok’s objective is to generate returns in the short term. Technical analysis can help you time the market and grab opportunities to make quick returns on some events.
If your objective is to convert ₹50,000 into ₹1 crore, technical analysis alone won’t suffice. You also need to make long-term investments. Let your money spend time in the market. Long-term refers to a period of 5 years and above. A lot can happen in these 5 years. Hence, you need fundamental analysis to ensure the company stays relevant and grows long-term.
The Mindset of a Fundamental Investor
Anyone with basic business knowledge can become a fundamental investor. Warren Buffett’s 2023 letter to shareholders defines a fundamental investor in the most basic form. He gave the example of his sister Bertie, who isn’t an economic expert, an accountant, or even an MBA in Finance. But she is a person with common sense who understands many accounting terms, reads the newspaper daily, and observes human behavior. She can tell who is selling and who she can trust – all necessary traits for fundamental analysis.
There is a misconception that fundamental analysis needs data and high-level mathematical skills. A true fundamental analyst needs a business mindset. They need to think of a stock as their own company and understand what’s best for its growth. The math in the analysis is simple addition, subtraction, multiplication, and division. All you have to do is identify whether you are making a profit.
Though we will dive deeper into the concepts of fundamental analysis in further chapters, here’s how great investors do it:
- Know how the company earns money – can it continue to earn money 10 years later?
- Know how to read books of account – to build practical expectations of its future earnings and review the books to compare actual numbers with your expectations.
- Willing to read and study – they are willing to understand the terms, logic, subjects, and skills. They read things beyond finance and never stop learning.
- Can differentiate between ‘information’ and ‘influence’ – Fundamental investors have their own thoughts and opinions and aren’t easily influenced by what others say.
- Are open to change – The future is unpredictable. Facts can change and one should change with them and adjust their investments accordingly.
The ‘funda’ of Fundamental Analysis:
In a nutshell, fundamental analysis is all about identifying and giving preference to a company’s business over the stock price. An investment decision based on sound and informed fundamental analysis can give you confidence to stay invested over the long term and generate wealth.
In this guide, we will learn how to do fundamental analysis from scratch, from studying the business and how it earns money to analyzing a company’s qualitative and quantitative aspects.
In Summary:
- A stock is not just a ticker symbol or an electronic blip but an ownership interest in an actual business.
- Fundamental analysis is understanding these three fundamentals: Revenue, Net Profit, and Cash Flow.
- To perform fundamental analysis, you should know about the company, stay informed about its happenings, and make sense of the fundamental figures.
- Traders use technical analysis to make short-term gains based on news and events. Investors use fundamental analysis to understand the company and invest to generate wealth in the long term.
- Fundamental analysis doesn’t need you to know advanced maths or be a CA. You should be able to read and interpret a company’s financial statements and other qualitative aspects to understand if it can sustain and grow in the long term.
Chapter 2: It’s Your Business!
The first step in fundamental analysis is understanding the company’s business in which you want to invest. Business is a very broad term. In this chapter, we will understand how to research a company from an investor’s perspective. What aspects does an investor need to look for in a company’s business to make sense of its financial statements? Let’s understand…
The very beginning of fundamental analysis is knowing the business you are getting into. If you are looking to invest in a company (i.e., buy shares of that company), it is all about your business to know how the company makes money.
What exactly is “business” in the first place?
Richard Branson, co-founder of Virgin Group, said,
"A business is simply an idea to make other people’s lives better"
Making money in the process isn’t a bad thing, either. The business idea involves finding a need or a want in the market and testing whether people are willing to pay to fulfill this want or need.
Why should you understand a business?
As discussed in the previous chapter, a fundamental investor needs to think of a stock as their own company and understand what’s best for its growth.
When you know what the business does and how it makes money, you can make sense of the financial figures such as revenue and profits. You can build your understanding of the company’s potential to grow and sustain in a dynamic business environment.
To understand the business of a company you want to invest in, you need to understand:
- The business model
- The business growth cycle
- The business environment a company operates in
- Macroeconomic aspects that affect participants in the economy
The business model
A business model is a detailed plan of how the company intends to profit from the business idea. Some of the craziest business ideas that nobody thought would ever succeed include selling packaged drinking water (Bisleri) when it was freely available at public water coolers, creating a movie ticket booking app when one could easily book a ticket (Bookmyshow) at the counter, and using a prepaid wallet (PhonePe) when one could pay in cash or through net banking. However, their business models converted these ideas into profitable business ventures, and in a great way indeed. A business model tells you about:
The offering: The business model describes the product or service that the company offers, what need/want the offering aims to fulfill, how the offering is priced, packaged, and sold (marketing), who the target customer is and other details.
The business structure: The business model describes how the company plans to manufacture or source the materials, distribute and market the product or service, the cost incurred, how much investment the company needs, and where it will use it.
The growth potential: The business model also outlines the road to growth and expansion, stating how it plans to scale its operations.
There are various types of business models. The most common is a manufacturing model, where businesses produce and sell an item to the customer. Automotive companies, fast-moving consumer goods companies, and even mobile phone companies follow this traditional business model. Here’s a summary of the most common types of models:
Model | Examples | About the business model |
Retailer model | Reliance Retail, DMart | The business buys finished goods from manufacturers or distributors and sells them directly to customers. |
Subscription model | Netflix, Economic Times | The business offers products or services with recurring payments to lure them into long-term, loyal customers. |
Freemium model | LinkedIn, Spotify | The business attracts customers by offering basic products (sample packs) or services for free to convert them into premium customers and unlock advanced features. |
Marketplace model | Amazon and Flipkart | The business offers a marketplace, digital or physical (malls) that attracts customer footfall. It charges businesses for displaying their products/services on the marketplace platform. |
Franchise model | Pizza Hut and McDonald’s | The business replicates a tried-and-tested business model in different locations. In return for a percentage of earnings, it provides incoming franchisees with a brand name, finance, promotion, and operating guidelines. |
The company’s management can start with one business model and keep adding, innovating, and evolving its model with time, depending on its target audience’s changing needs and wants.
To give you a practical example of a successful business model that evolved with time and remained relevant, let’s talk about Apple.
Apple started out with the traditional manufacturing model, developing the brand and product (iPhone, Mac, Apple watch) and selling them to anyone looking for a secure computing experience and aesthetic value. Its business structure was to outsource its manufacturing and assembly to China to reduce production costs. There was a huge market to tap through geographic expansion, technology upgrades, and new product launches. This model helped Apple become the first stock to reach a $1 trillion market capitalization.
Market capitalization
A company’s share price is multiplied by the number of shares trading on the stock exchange. So if X Co. has 100 shares trading on the stock exchange at Rs. 5 per share, its market cap is Rs. 500. The total market value of all outstanding shares is Rs 500. The market cap determines a company’s size (large-cap, mid-cap, small-cap) and compares its performance with other companies of different sizes.
Where to find a company’s business model?
No set format or document exists where a company details its business model. It is at the company’s discretion how much it wants to reveal. However, a company’s Annual Report is the best place to begin. Apart from that, you can do your research by reading newsletters, analysts’ reports, CEO interviews, and detailed videos and podcasts to build your understanding of the company’s business model.
Fundamental research requires using multiple reference materials, annual reports, trustworthy news sources, and past news stories in business newspapers/magazines to build your understanding of the business.
The key skill of a fundamental investor is having their thought process and opinions formed on the foundation of the data and information they collect. They do their research rather than getting influenced by rumors.
How to analyze a business model?
Two companies can have the same business model and yet deliver different outcomes. This is because a business’s success or failure depends on how its management executes the business idea through the business model. For multiple reasons, one company could perform better than another with the same business model.
This is where the second step of understanding the business life cycle emerges.
Life-cycle of business
Imagine Amar and Ajay driving the same car, but Amar driving at 60km per hour and Ajay at 120 km per hour. Their performance (risk and reward) will differ in the short and long term. The same goes for a business cycle. Understanding the speed at which revenue and profit are growing can help you determine which phase of the business lifecycle the company is in.
A business’s lifecycle defines its progression in stages. Typically, there are five stages of a business lifecycle.
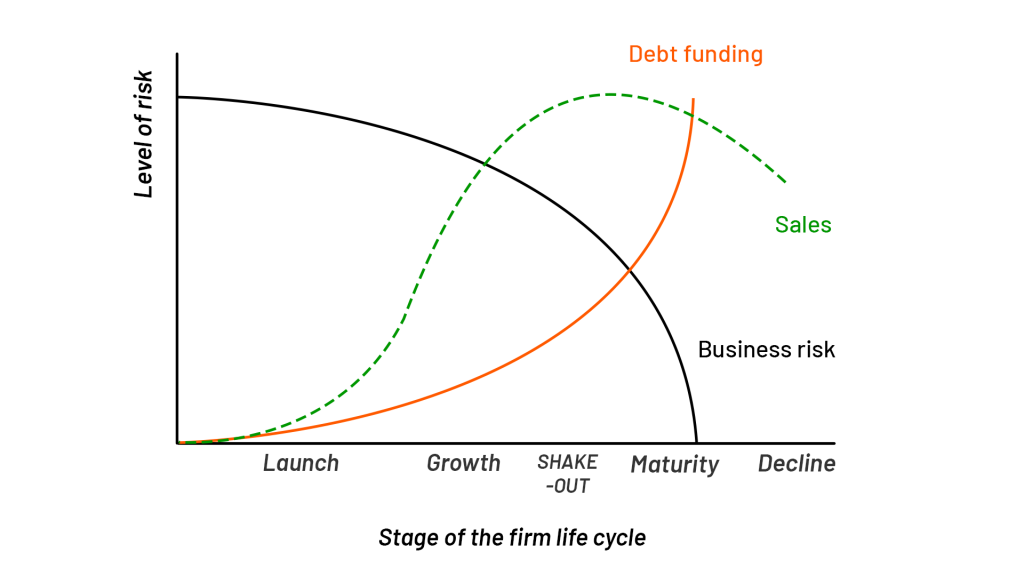
1. Launch stage
This is where the company is a startup trying and testing its business model. Its main objective is to attract customers through a value proposition and deliver the product/service. A company in this stage has low sales and high advertising and market expenses. It may also have low to no debt, as banks are skeptical of giving loans to startups whose business models have not yet proven to generate results.
Companies at this stage need more historical data to help analyze the company. Here, you have to rely more on qualitative analysis that focuses on the company’s owner(s), who are the whole and soul of the company. Startups generally get seed funding from relatives, friends, angel investors, and their own money.
2. Growth stage
Once the company has secured its existence and built a decent customer base and revenue stream, the owner focuses on survival. This is the stage where you know the business model is working, and now it has to survive in the business community. Hence, the focus extends to recovering costs and breaking even while growing revenue. The growth phase is the longest and most lucrative time for both the company and its investors.
Think of it like your school and college days. Just like you learned multiple subjects, developed hobbies, identified your strengths and weaknesses, and polished your skills, a business does the same in the growth stage.
This could be a crucial stage as many unforeseen events, ineffective management, new product failures, or risky decisions could strike and pull the company back into the survival stage. Many examples of growing companies were pulled back while they were at the peak of their growth.
Consider Yes Bank, a fundamentally strong bank run by the balanced combination of Rana Kapoor (the aggressive) and his brother-in-law Ashok Kapur (the conservative). After Ashok Kapur’s demise in 2008, the scales tilted heavily towards risky decisions as the bank started lending to companies under financial stress, including the Anil Ambani Group, Dewan Housing Finance Corporation, and the Zee Group. While these decisions resulted in significant growth in the short term, they also increased the risk of Yes Bank.
A 2015 UBS report found that such loans exceeded Yes Bank’s net worth. While the bank was growing aggressively, the business risk increased significantly, and it was only a matter of time before these stressed loans hit the fundamentals. Since RBI closely regulates banks, the regulator intervened in August 2018 and refused to extend Rana Kapoor’s tenure as the CEO, which was coming to an end in January 2019. A new CEO was instituted. From there began a series of unfortunate events that led to depositors withdrawing cash and a falling stock price, among other things.
3. Shake-out stage
This is the stage where a company moves towards its peak. It is growing revenue but at a slower rate. The company begins to see market saturation or new competitors taking over market share. This is where the cash flows grow faster than profits. Since many companies see money in the business, competition intensifies as too many players spring up to grab a slice of the profit pie.
Not many companies have reached this stage. Sometimes it is the nature of the business/industry and sometimes it is the constant fire-fighting within the company. But a business that reaches the shake-out stage has relatively lower business risk than those in the growth stage.
4. Maturity stage
This is the stage where a company has reached its peak. It is a market leader, and competition no longer affects it. IT giants like Infosys, TCS, and Wipro have achieved this stage. They have a strong history and high cash flows. However, sales stagnate and decline gradually at this stage unless a new category is entered.
The company has already implemented the growth plans mentioned in the business model. The challenge is to find the next growth factor. They are resourceful, have plenty of cash, a brand name, a loyal customer base, and the skill and talent to pursue the next growth expedition. Active management may revisit, review, and redesign the business model to adapt to change and find a new value proposition to extend its lifecycle.
5. Decline stage
Many companies, like Apple, stay in the maturity stage for a long time. However, some need help keeping up with the changing business environment and technological advancements, which pushes them into the decline stage. The company’s sales, profits, and cash flows fall faster as it loses its competitive edge. Then comes the point where the company exits the market.
However, a complete restructuring can turn a business from near bankruptcy to profitability. A turnaround can be made through a management reshuffle, a new business model, and a new beginning from the survival phase because a declining stock is as risky as a startup.
No guidebook can tell you which company is at which business lifecycle stage. You have to observe the qualitative (growth strategy, offerings) and quantitative (revenue and profit growth rate) fundamentals to identify the phase in which the business is operating.
Going back to our earlier example of Apple…
Apple rose to glory in 2007 on the back of its flagship iPhone. After 9 years of capturing the market, it reported its first decline in iPhone sales in August 2016 as the mobile phone market had reached a saturation point. People needed more time to be ready for a $1,000 price tag for a mobile phone. Moreover, the company needed to catch up on technology, making adding new features to the phone difficult.
Apple was at the maturity stage. It went back to the drawing board and adopted a service-based model. It used its existing iOS ecosystem to sell various subscriptions and services, such as Apple TV, iTunes, etc. and extended its lifecycle. This boosted its sales and revenue, bringing the stock to the $1 trillion market valuation.
In the meantime, it kept innovating new products. Apple Watch and Airpod extended its lifecycle and found the next $1 trillion valuation in August 2020. With the market fast saturating, Apple is continuously developing new products to find its next growth cycle. The company has a loyal customer base despite competition.
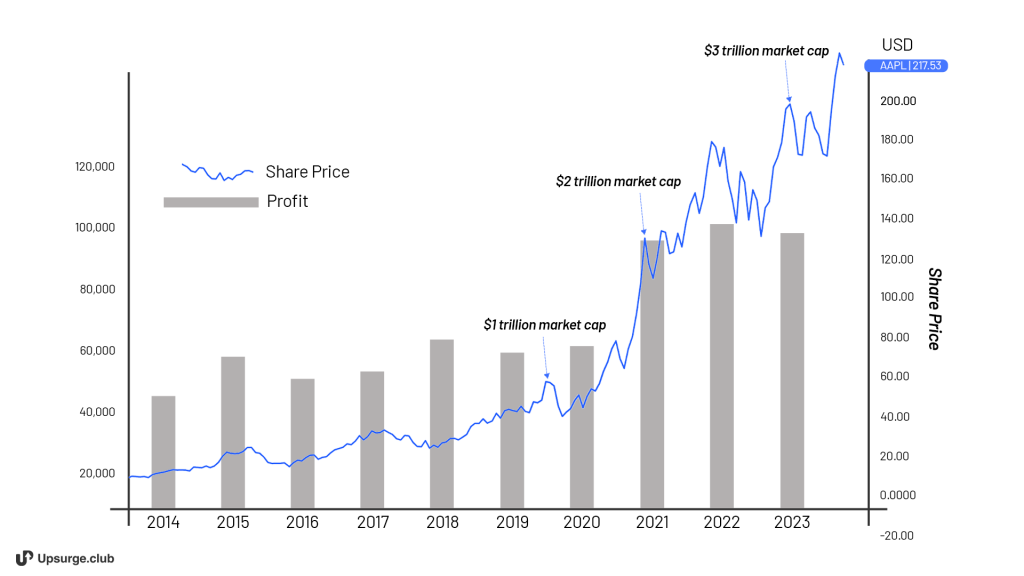
Understanding the business environmen
So far, we have focused on what goes on inside the business. However, a company operates in an economy where several players are present. The business interacts with these players directly or indirectly and maintains its momentum. While understanding the business, you also need to understand the industry the company operates in and how macroeconomic factors impact its growth and sustainability.
One of the most commonly used analysis frameworks is Porter’s 5 Forces. Michael Porter introduced this strategic analysis model in a 1979 article published in the Harvard Business Review. It is used to understand an industry’s competitive landscape.
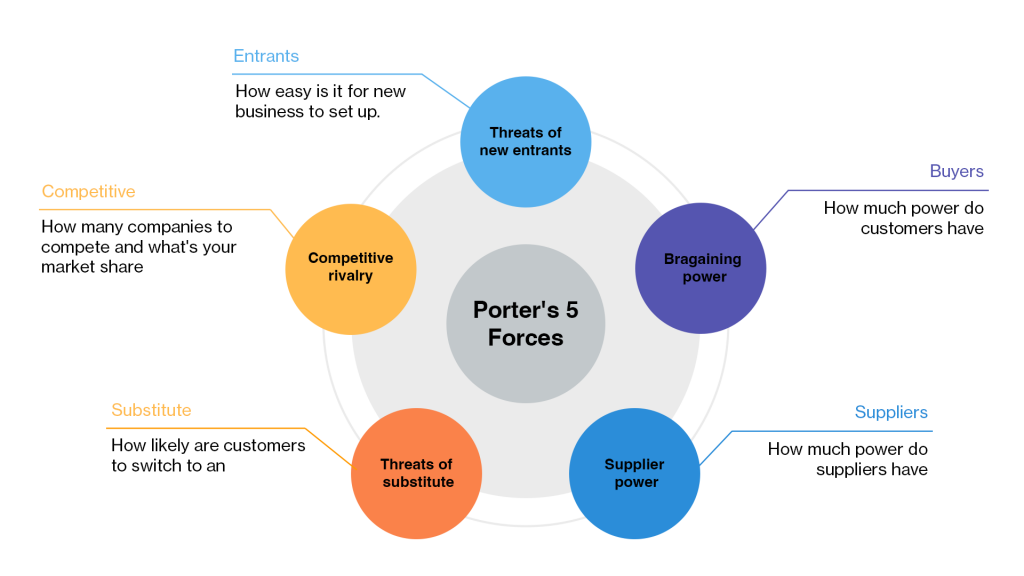
Let’s look at each one.
1. Competitive rivalry: Here, you look at the intensity of the competition and where your company stands in comparison. Is it a market player or a new entrant? How many strong contenders are there for the market share?
Intense competition caused by price wars affects a company’s ability to charge a premium, increasing marketing costs to poach each other’s customers. Some good examples are Coca-Cola vs. Pepsi, McDonald’s vs. Burger King, and Airtel vs. Jio. Mild competition gives the company an edge to charge a premium and reduces customer retention stress. The focus shifts to supply and operations.
2. Potential for new entrants: Here, you look at how difficult it is to enter this business. Are there any barriers to entry, such as initial capital requirements and regulatory approvals? For instance, banks and hospitals are highly regulated, whereas telecom and airlines need huge initial capital, creating a barrier for new entrants. On the other hand, the restaurant industry has low entry barriers, making it highly competitive.
3. Threat of substitutes: A substitute, though not a directly competitive product, could reduce the overall demand for the product/service. For instance, mobile phones substituted landline phones, OTT platforms substituted Cable TV, and digital cameras substituted reel cameras. A substitute shifts the demand and reduces the overall market for the business. Sometimes, it can also cause an existential crisis for an industry. If the threat of substitution is high, you should examine the company’s strategy to innovate and grow with the trend. Kodak’s management’s inability to incorporate digital photography into its business model led to its downfall.
4. Bargaining power of supplier: The power to bargain comes when supply is abundant. If the supplier offers a niche product that is highly technical or has limited availability, the company could face higher inventory costs or a disruption in its operations due to a lack of supply.
Pratt & Whitney supplies jet engines to airlines worldwide and has strong bargaining power. A technical issue in its engines grounded several aircraft, costing airlines massive losses as they could not fly those planes despite high demand. Go First Airlines even filed for bankruptcy because of the engine issue. On the other hand, when supply is abundant, suppliers tend to lose, and the company benefits as they can buy at a huge discount.
5. Bargaining power of customer: A customer’s bargaining power defines how competitive the market is and how easy it is to switch. When customers have high bargaining power, as in the case of mobile phone services (Jio, Airtel, Vodafone Idea), there are price wars that affect companies’ profits. On the other hand, when customers have low bargaining power, such as petrol and electricity, the company’s profits are stable.
Tip
Studying a company is like preparing a presentation. The above three concepts—business model, business lifecycle, and business environment—can help you create a framework for your research. It tells you how to analyze the company’s business. As Charlie Munger beautifully puts it, “Understanding how to be a good investor makes you a better business manager and vice versa.” The initial understanding of the company will help you build a strong foundation for your analysis. It’s essential to stay updated on the current happenings in the business world. You can subscribe to business newspapers, set news alerts, and spend 30 minutes daily reading the news.
How a fundamental investor studies a business?
To be a fundamental investor, you need to think like the captain of a cricket team. First you need to observe and analyse all the players, their strengths and weaknesses, before selecting your final team (business model). But having selected the best possible team isn’t enough. What kind of a pitch are you playing on, are the weather conditions in your favour, is the outfield slow or fast – every last detail matters (business environment) as it affects your overall game.
Similarly, just zeroing in on a stock or company with a successful business model isn’t enough. You need to be aware and updated on the macroeconomic environment (consumer spending, government policies), competitors and business environment, and the core strengths of your company. Only when you have the complete picture can you design a game-winning strategy.
And even a sound, solid strategy can only help you make a good start. Once the game begins, its all about the score. As a batsman, you will have to face a volley of googlies, short balls and bouncers. You need to be sharp in analysing the bowler’s stride and length to tackle the ball coming your way – and you need to do all this as you stand at the crease (Business lifecycle).
Fortunately, for investors, there is a way of accessing and analysing a company’s scores before and after investing in a stock.
With the help of financial statements, which we will cover in the next chapter.
Summary
- A business is an idea to fulfill a demand/need and make money in the process. A fundamental investor should know the business of the company they are investing in to make sense of the financial figures.
- To understand a business, you need to do research about the company’s business model, business lifecycle and the business environment the company operates in.
- To study a business model, look at the company’s product/service offerings, business structure, and growth plans. This information can be found in annual reports, business newspapers etc.
- Any business has 5 stages – launch, growth, shake out, maturity, and decline. You can identify which stage the company is in by observing its sales, net profit and cash flow. The business stage can help determine the company’s business risk.
- To study the business environment, you can start with Porter’s 5 forces: Competitive rivalry, Threat of new entrants, Threat of substitutes, Bargaining power of supplier, Bargaining power of customer.
- A fundamental investor is like a team captain who studies the business model of the company to know its strengths, understands the business enviornment, and prepares his game plan. This preparation helps him invest with confidence across all stages of the business.
Chapter 3: Know Your Financial Statements
Once you know the game, it is time to understand your players, their performance, strengths, and weaknesses. This chapter will briefly introduce the financial statements and annual reports relevant to fundamental investors, explain their structure, and tell you where to find them.
We all love a good biopic, right? It’s the story of a person’s life condensed into two riveting hours. Exciting stories of interesting people are sometimes inspiring, sometimes emotional, but always enlightening.
What would you say if we told you that every company in the world, no matter how big or small, has produced its biopic? It is not just a vague, generic story but a detailed narration of all it has been through, achieved, or lost on its way to becoming the institution it is today. Don’t believe us? We’ve got proof!
Annual reports are a company’s biopic. Each company’s annual report is different from another because each company has other ambitions, ways of working, and targets. However, they all use a standard corporate production style, making them easier to review and compare.
Components of an annual report
- Introduction to the company’s business: Just like how every character is introduced and their importance is established at the movie’s start, the annual report presents the company, its values, business segments, and its contribution.
- Financial highlights: It’s like the movie trailer, where the company highlights the leading financial figures, key performance indicators, and ratios to give an investor a snapshot of the year it was. This data is presented in a visually appealing manner through colorful charts and graphs.
- The Management Statement: It is a statement from the company’s top management (chairman) addressing the shareholders about the company’s achievements, focus, and outlook. If you read carefully, you will understand the involvement of the top management and how realistic the outlook is—whether the top management’s vision for the company is in sync with the strategy and numbers.
FYI: The 400-page annual report has an index for easy navigation. So you better check that out first.
- Management Discussion & Analysis: These are like Behind-the-scenes interviews with the film director. Here, the company’s management (CEO, CFO) talks about the overall economic scenario, industry environment, challenges and outcomes, particular strategies, and how they performed in this environment as a company and as specific segments. They might even back their story with particular numbers and explain their importance.
- Financial Statements: The main characters make the final entry in the form of tables and data in the standard format that complies with the Indian Accounting Standards (IAS). These reports are standardized so you can compare the numbers with those of competitors to understand the performance better. Unless the parameters are the same for all players, you can’t identify who is ahead and behind at the corporate box office.
Every company’s annual reports have three financial statements:
- The Profit & Loss Statement – It’s your ‘common man’ protagonist telling you about a typical day in the life of a company: how much it sold, how much it spent during the period, and what was left at the end of the quarter/financial year.
- The Cash Flow Statement – It’s the ‘money-minded’ protagonist who only talks cash and removes anything non-cash. It tells you how much money came in and went out and what is left.
- The Balance Sheet – It is like a dated family photograph. The balance sheet tells you what the situation was like on that date. What the company owned and what it owed as of 31st March XXX.
In the later chapters, we will discuss our three protagonists in length and how they are intertwined to make a perfect business story.
6. 10-year Financial highlights: Once you have a clear idea of the company’s performance this year, the audit report provides a 10-year financial flashback to show a historical trend and how far it has come, followed by outlook or mid-term guidance.
Suppose you carefully skim through the annual report of any large-cap company, such as ITC, HDFC, or Reliance Industries. In that case, you will see a well-presented report telling the company’s story.
The Securities Exchange Board of India (SEBI) requires all companies listed on the stock exchange to follow Listing Obligations and Disclosure Requirements (LODR).
The SEBI requires companies to prepare and disclose financial statements in a prescribed format (Annexure - 1) every quarter of the financial year.
Here, we will pause and understand a few terms that will frequently appear throughout the module.
Financial year: For most Indian companies, the financial year is from April 1 to March 31. A financial year from April 1, 2023, to March 31, 2024, is written as FY 23-24 or FY24. However, some companies may have a different financial year. Until 2020, Nestle India followed the 1st January – 31st December financial year. However, it changed to the April-March FY format in 2024.
Quarter: A quarter is three months. A single FY has four quarters ending in June, September, December, and March.
Quarter | Months | Accompanying Financial figures |
Q1 | Apr-Jun | – |
Q2 | Jul-Sep | Half Yearly |
Q3 | Oct-Dec | Nine months |
Q4 | Jan-Mar | Full Year |
Financial Statements – break up of quarterly statements
The process of releasing financial statements
The company prepares the financial results and submits them to the Board, Chief Executive Officer, and Chief Financial Officer for approval. Their approval certifies that the financial results do not contain any false or misleading statements or figures and do not omit any material fact that may make the statements or figures contained therein misleading.
Company’s Board
The board of directors is the company’s governing body. Shareholders elect these directors to oversee the company’s management, participate in major business decisions, and protect the interests of shareholders.

In other words, the financial statement contains data coming directly from the source and is, therefore, the most authentic information compared to a news report, which may contain data entry errors.
(i) Audited / Unaudited
The company has to get its reports audited by an external auditor. However, the stock exchange allows companies to submit audited or unaudited quarterly financial statements within 45 days of the end of the quarter. If the statements are unaudited, they should be approved by the Board. Hence, you may see two “Q1 FY 23-24 reports” of the same company – Audited and Unaudited.
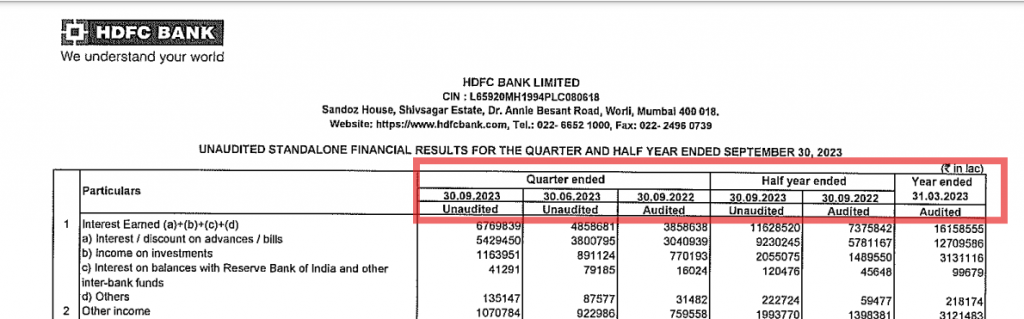
Audited reports are more accurate as the figures in them have passed through the keen eyes of the auditor. The company will state the audited figures in the next report if there is a major discrepancy between audited and unaudited reports. The company clearly states which figures are audited and which are not. It uses the audited figures in all future correspondences.
In the above example, HDFC has stated the unaudited figures of 2023 and compared it with the audited figures for 2022.
(ii) Consolidated / Standalone
You might also have encountered multiple financial statements that look the same with a slight tweak—the headline states “Consolidated statement” and “Standalone statement.”
For some companies, the figures are almost similar, and for some, there is a significant gap. Why so?
Standalone statements are the financial figures of the parent company, while a consolidated statement includes the consolidated financial figures of the parent and its subsidiaries. Standalone and consolidated statistics are similar for companies with no subsidiaries, like ITC and Zomato.
For instance, Company A has a subsidiary X. In FY23, Company A reported a loss of Rs 100 crores, but X reported a profit of Rs 40 crores. Here, the standalone loss of Company A will be Rs 100 crore, whereas the consolidated loss of Company A will be Rs 60 crore (as it includes the Rs 40 crore profit of subsidiary X).
Which is a better statement - consolidated or standalone?
A consolidated statement gives a comprehensive view of the overall business. For instance, Reliance Industries’ (RIL) standalone figures are for its oil and chemical business. Jio and Reliance Retail are subsidiaries or Group companies of RIL.
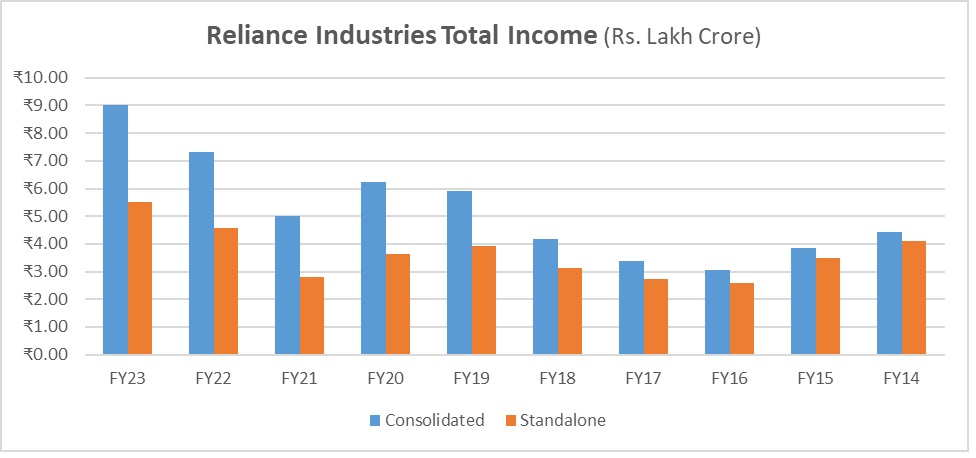
Reliance Industries’ FY23 standalone total income was Rs. 5.53 lakh crore, while its consolidated total income was Rs. 9.03 lakh crore. This gap in standalone and consolidated figures widened as the total income of its telecom and retail businesses increased.
In this case, RIL’s consolidated figures give you a better understanding of the company’s financial health. However, the company also releases standalone figures for Jio, Reliance Retail, and other significant businesses. This will help you compare the performance of Jio with its rivals Airtel and Vodafone Idea.
The most authentic financial statement of a company is the audited consolidated statement. For a fundamental investor, it is THE Statement he/she needs. (Psst! Warren Buffett, Ray Dalion, and Peter Lynch, all famous billionaire investors, spent most of their time reading the annual reports and financial statements of the companies they had invested in or were interested in.)
Returning to the process…
The stock exchange allows listed companies to file and publish unaudited/audited financial statements within 45 days from the end of the quarter. These statements are found on the stock exchange’s website and the company’s Investor Relations page.
After the earnings are released on the exchange, major companies hold an ‘Earnings Call’ during which management presents the earnings to the media and shareholders. The Investor Relations page contains the earnings call transcript and the slide presentation (if any) used by the management during the call.
Some companies also issue a media release that gives a synopsis of the overall financial performance. This will cover the main points of the earnings.
Tip: The stock market is generally volatile during the earnings season. You might see high momentum in stocks before and after the earnings release.
NSE’s website: https://www.nseindia.com/companies-listing/corporate-filings-financial-results
Now that you know the various characters in a company’s biopic and their role, it is time for the story to begin.
Summary
- The key to knowing your company is from its annual report and financial statements.
- The annual report is like a company’s autobiography that tells its story about the year it was. Every annual report has standard components: A business overview, management disclosure and analysis, financial statements, and 10-year financial highlights.
- Audited/Unaudited statements: The board, CEO, and CFO approve the unaudited statements, and the auditors review the audited ones for false or misleading statements and figures.
- Standalone/Consolidated statements. The standalone statements depict the financial figures of the parent company, while the consolidated statement includes the economic figures of the parent and the Group of companies.
- A company releases quarterly financial statements on the stock exchange and its Investor Relations segment within 45 days of the end of the quarter.
Chapter 4: How to Read a Profit and Loss Statement
In this chapter, we will examine hardcore fundamentals, reading the financial statement, determining where the figures came from, and making sense of each figure. When data speaks, a fundamental investor listens.
Now that we understand the general setting of our biopic, it’s time to get acquainted with each of the main characters and their individual stories.
First, the profit & loss statement.
Introducing the P&L statement
Some call it Statement of Income, some Statement of Earnings, and some Statement of Operations. They all end with a profit or a loss. This statement is the starting point of any company’s financials and can tell you a lot about its nature of operations, including how efficient or stressed the company is.
You can also make your P&L statement. It is similar to writing your household/daily expenses. It includes how you earn money and where you spend it. You prepare these records referring to the bank statements, credit card statements, receipts, bills, and invoices. Similarly, a company has a team of accountants and high-end software technology recording these transactions and accounting them in relevant categories.
Every business has one objective – to make profits. The P&L statement tells you how close or far the company is from achieving this objective.
To arrive at the profit, you need two things:
- Revenue, which tells you which product/service is selling and which is not, and which product is the real cash cow.
- Expenses tell you where you are spending more and how an increase in cost in a particular area could impact your business.
The process of deducting various expenses from the total revenue is reflected in the P&L statement.
Reading a P&L statement
To understand the story a P&L statement narrates, you must first understand how to read it.
So, put on your reading glasses, and let’s begin!
Here, we have taken an actual P&L statement for a large-cap company, ITC.

Headings
As discussed in the previous chapter, we will consider the consolidated statement. The headline specifies whether it is a standalone or consolidated statement and for which year. The left-hand column specifies the particular items, and their corresponding columns in the right state the total amount. The heading tells the period for which those figures are and their denomination.
The above case, the figures are in “Rs. crore” for FY22-23. These figures have been compared with the previous year’s figures.
Line items
Every row on the P&L Statement is called a line item. Most line items have “Financial Notes” or “Schedules,” which give the break-up of the financial figure. The P&L statement states the schedule/note number against the line item.
")
The first line item is Revenue from operations, also called the ‘top line.’ It tells you the value of sales the company made from its business. The second column, ‘Notes,’ reads 22A, 22B. You see the revenue breakdown when you go to “Notes to Consolidated financial statements” 22A, 22B.
In the above example, we will read the first line as follows:
ITC earned Rs. 76,518 crore in FY23 revenue, which is higher than last year’s Rs. 65,204 crore.
If you look at the notes, you will see that Cigarettes and Packaged Foods are two of its biggest revenue contributors.
You can read each line item on the P&L statement in the above format.
Why don’t you try reading the second line? Did you get it?
Now that we know how to read a line item, we will understand what each tells us about the company’s year.
Every P&L statement tells you something
Revenues
Revenue from operations: This is the revenue a company earns from its business operations, and it shows how well the business is doing sales-wise. The Notes will tell you which product is doing well and which is not.
If you look at the above example, ITC’s hotel business doubled its revenue, and all other segments reported good revenue growth except for other agri products. However, this segment forms a very small part of the company’s revenue. Hence, it had a minimal impact, and the company’s overall revenue surged.
Other Income: A company has other sources of income besides its business operations, such as interest/dividends on investments.
Expenses
This segment includes all types of expenses a company incurs to earn revenue from operations. It is divided into three segments: production cost, office cost, and finance cost.
Production cost: This cost will be high if your company is a manufacturing company. Some items included are:
- Cost of materials – the cost incurred to buy raw or finished goods to manufacture the goods/services.
- Stock-in-trade – the value of finished goods inventory a business holds for sale. For instance, a shopkeeper may hold 100 bags of sugar to sell in the market. The cost of those 100 bags of sugar is the stock-in-trade.
- Inventory – the goods that are already stored in the warehouse. Apart from new purchases, you also look at the inventory changes to help you determine the cost of goods sold.
Excise duty – the tax the company pays the government for certain goods for production, licensing, and sale.
In the airlines industry, they have aircraft fuel expenses instead of cost of materials.
Office cost: This will be high if your company is a service company. It includes:
- Employee benefits expense (salary, benefits, insurance, pension, etc.)
- Other expenses include utility bills, maintenance, repairs, advertising, legal charges, consulting fees, etc.
Employee cost is the highest in the IT industry.
Finance cost: It includes all costs a company incurs to raise debt or equity such as financial advisor charges, processing fees, interest paid, share-based payments to employees.
Other expenses
Depreciation and amortization expense: This is related to capital cost, which is a significant amount spent to buy an asset or a substantial amount of loan taken.
- Depreciation: Suppose company A buys a Rs. 10 lakh truck for business. The truck will keep working for 8-10 years (it is called the useful life of the truck). So how do you expense it? You cannot directly deduct Rs 10 lakh from your revenue as it will show a false picture of your operations. You will incur the Rs 10 lakh cost to buy the truck over its 10-year useful life. That deferring of the capital cost is called depreciation.
- Amortization: It is the principal amount you repay on the loans taken. Remember, the interest on the loan is recorded in the finance cost.
Exceptional Items: These are one-off expenses a company incurs beyond the ordinary course of business. For instance, a company received capital gains from selling one of its land or laid off 100 employees for which it incurred a one-time severance pay. If this is high, you might want to look into the cause. However, they will not affect daily operations.
Tax expenses: It is the corporate tax the company pays to the government on the profit earned.
Each of these line items is like the pixels of a photograph. They come together in a predetermined format to give you a clear picture of how profitable a company’s operations are.
Key elements of a P&L statement
Knowing about every line item is essential when doing a detailed study of a company. However, if you are doing a general health check of the company, you can directly jump to the 3 significant elements of the P&L statement.
- Revenue from operations
- Profit before tax
- Profit after tax
Revenue, as we discussed above, is the starting point of any business. It tells you how much demand your business has in the market. However, you should not look at the revenue figure in isolation. Compare it with historical data or with peers to identify trends.
The revenue trend can tell you much about its seasonality, cyclicality, or a one-off jump. For instance, electronics sales increase during the festive season (October – December). Hence, you might see a significant jump in sales due to a seasonal effect, which will vanish after January. Any one-off jumps or dips in revenue could be due to an incident or event, like a pandemic, boosted demand for sanitizers. And lastly, cyclicality occurs when there is an upgrade, like a PC upgrade cycle or consumer demand shift.
Profit or Loss is the outcome of the P&L statement. Hence, it is the most relevant part. Here, we have two types of profits:
Profit/Loss before tax (PBT) – It is the outcome after deducting all expenses except tax from the revenue. The tax expense is different for every company as it boils down to how tax-efficiently they process transactions. The PBT makes the company’s profits comparable with its peers.
Profit/Loss after tax (PAT) – This is also called net profit or bottom line of P&L. This is the after-tax amount left for shareholders after accounting for everything. When you divide this amount by the number of shares, you get earnings per share (EPS).
Every company strives to increase the above three metrics. All the strategies it undertakes, like expansion, new product launches, merger and acquisitions, etc., are designed to increase revenue sources and boost profits.
If you find anything out of place in the profitability picture, you can magnify the pixels and look more closely to identify what is causing the profit to rise or fall greater than anticipated.
Looking at the P&L statement through an investor’s lens
The P&L statement of every industry and company is different. Only after a thorough analysis of the P&L statement relative to peer companies and over time, will you be able to form a useful opinion on the same. Here is how a generic opinion might differ from a well-researched one:
General view | Fundamental lens |
An FMCG company will show a high cost of materials as it spends significantly on agricultural goods. | In 2023, when uneven monsoons increased the cost of most agricultural goods, FMCG stocks fell as their cost of materials increased significantly, affecting their profit before tax. |
An IT company will show high employee costs. | IT companies make major layoffs when their revenues are weak to reduce costs and maintain profitability. |
Profit or loss – the two words that matter most to both companies and investors. It’s what the entire business world revolves around. No wonder then that the main hero of our company biopic is the P&L statement.
However, other supporting characters in our movie play key roles, too. It’s time to meet the next one now.
Summary
- A profit & loss statement of a company tells you about the daily operations of a company. The end objective is to see what is left after deducting all expenses from the revenue.
- A P&L statement has various line items, which are either revenue or expenses. Most of these line items have a detailed bifurcation in the “Financial Notes” or “Schedules.” The P&L statement states the Notes no. too, which you can refer to to understand how the company arrived at that value.
- Revenue: This includes revenue from operations, which is the sales value generated by the business. It also includes other income, like interest and dividends earned from investments.
- Expenses: These are broadly classified into production costs (cost of materials, inventory, and excise duty to produce goods), office costs (employee costs, rent, maintenance, legal, advertising, and other charges), and finance costs (interest paid on loans and fees paid to raise loan and equity capital).
- Other expenses: These include depreciation and amortization, which are capital costs deferred over the life of the asset or loan to give a clear picture of daily operations. They also include exceptional items that are not part of daily operations and are just one-offs.
- The key elements of P&L are revenue, profit before tax, and profit after tax. Profit drives the business, and any unexpected change in profit attracts attention to a company’s expenses.
Chapter 5: Going With the Cash Flow
So far, we have seen how a company earns a profit. But how much of this profit converts into cash? In this chapter, we will understand the concept of accrual accounting and how a cash flow statement tells you about a company’s financial health.
As the saying goes, behind every hard-working profit & loss statement is a smart working cash flow statement.
The profit & loss statement shows you all the work the company did. What it doesn’t tell you is whether the company received cash for the work it did. Work completed and billed is what is called ‘accrued revenue.’ To put it in layman’s terms, you sure have earned it, but have you been paid for it? That is the question.
While the P&L plays the hero onscreen, it has a sidekick who works behind the scenes and makes the P&L happen smoothly – the cash flow statement.
Why do you need a cash flow statement? Why can’t P&L just account for sales for which you received cash?
Because you have to give credit to the customer many times, every customer won’t buy a car on a full down payment. Electricity and gas bills are calculated after you have used the service. In all these instances, the business accrues revenue, and the customer pays later.
Now, you may wonder, but why report accrued revenue in the first place? Why not just account for sales for which you received cash? Because business doesn’t work that way.
Why does one report accrued revenue and not cash revenue?
Remember, the objective of a P&L statement is to calculate the profit/loss earned from your business operations. If you run a lemonade stand, you should know whether selling lemonade earns you any money or you are just losing money.
Let’s take a hypothetical scenario.
You run a lemonade stand and sell one glass of lemonade for ₹10. The cost incurred to make one glass is ₹4. Your profit is ₹6. That’s what the P&L statement tells you. Now, Jay walks in and gives you the order to deliver ten lemonades every day for 30 days and collect the money (₹3,000 = ₹100 x 30 days) at the end of the month. Here, you accrue ₹100 every day in revenue as you bear the cost of the ingredients or raw materials used to make the lemonade, such as lemon sugar, water, ice, and spices.
Since you have accounted for the revenue but have not received the cash, it piles up into a separate heading called “Accounts Receivables.”
Pay close attention to this “Accounts Receivables” as it plays a major role in the climax. Many scams take place in this segment.
When Jay’s Accounts Receivable (AR) reaches ₹3,000, he pays you, and your account with Jay is settled. You will report this cash as accounts receivable in your cash flow statement.
If Jay doesn’t pay the amount for three months, your AR keeps growing. But your P&L shows a profit of ₹1,800 (₹6 x 10 glasses x 30 days) per month despite not getting paid for it. It means a company can be profitable and still be low on cash as its cash is stuck in transit. You can sustain for one month or two months. But if the credit keeps growing and Jay doesn’t pay, it will affect your operations because you are bearing the cost of ₹1,200 (₹4 x 10 glasses x 30 days) per month to make those 300 glasses of lemonade.
Do you see why P&L needs a cash flow (CF) statement? Because it gives you the real picture of how much cash you are getting.
The cash flow statement plays a very important role in maintaining the finances of a company. If P&L are the muscles, cash flow is the oxygen. Hence, when cash flow reduces, your business operations get affected.
Even a profitable company can be burning cash. And even a loss-making company can have bundles of cash. To do this, you need to read the cash flow statement thoroughly.
Bird’s eye view of the cash flow statement
To read this statement, we need to understand how cash flows into the business.
Going back to our lemonade example.
The P&L brother wants to buy a bike worth ₹1 lakh to deliver lemonades. In what ways can he fund his bike?
Take a loan from the bank or family – Cash Flow From Financing or CFF
Use the cash he earned from selling lemonades – Cash Flow From Operations or CFO
Invest the operating cash in fixed deposits, stocks, and mutual funds and use the accumulated money to buy a bike – Cash Flow from Investing or CFI
Each method involves costs and tells you something about the lemonade stand.
Assuming you take a loan to buy a bike. Your lemonade stand’s cash flow statement will look something like this.
Sr. no | Particulars | Amount (₹) | Notes |
1 | Cash Flow from Operations |
|
|
| Profit | 5400 | You start with the Profit |
| Accounts Receivables | (9000) | Since you did not receive the cash, it will be deducted from your cash balance until Jay clears his dues. |
| Net Cash from Operations | -3600 |
|
2 | Cash Flow from Investing |
|
|
| Purchase of Bike | (1,00,000) |
|
| Net Cash from Investing | (1,00,000) |
|
3 | Cash Flow from Financing |
|
|
| Loan | 1,00,000 |
|
| Interest and Processing Fees | (1000) |
|
| Net Cash from Financing | 99,000 |
|
The above table is just a framework of a cash flow statement. It has other elements like net cash balance, which we will study later in the chapter.
In an ideal scenario, you would want your lemonade sales to earn you enough cash to cover your expenses and pay for the bike. The bike is an investment as it will allow you to sell more and earn more revenue and profit.
That’s how money makes money.
So far, we have seen a scenario where you sell 300 glasses of lemonade a month. Now imagine this business in lakhs and crores, with lemonade selling in huge volumes nationally and internationally. Imagine what the gap between the P&L statement and cash flow statement would look like then!
On a larger scale, the cash flow statement becomes even more important as your operations have to earn you enough cash for the business to sustain. Let’s read the cash flow statement of a real bigwig like ITC and see what it tells you.
What does operating cash flow tell you?
We will not get into the nitty-gritty of calculating operating cash flow. Remember, we are here to only read the statement, not make it.
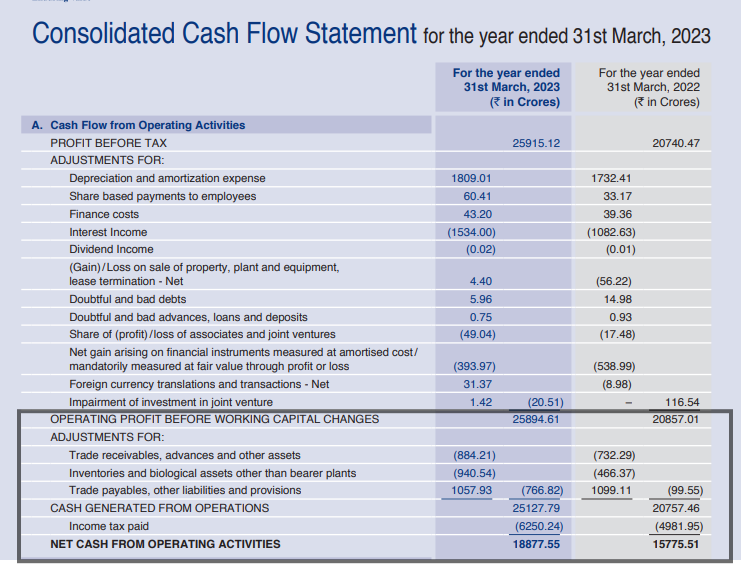
Between the line “Profit before tax” and the line “Operating profit before working capital changes,” the company has deducted all non-operating expenses (which we discussed in the previous chapter).
Note: “()” indicates that the cash has gone out of the business and is reducing your cash balance. When reading the cash flow statement, put yourself in the company’s shoes and follow the cash trail, whether it is coming in or going out.
Our cash flow from operations begins with “Operating profit before working capital changes.”
- ITC’s trade receivables increased to ₹884.21 crores in FY23 from ₹732.29 crores in FY22.
- Inventories are the amount ITC pays to store the supplies for business operations. Its inventory cost more than doubled to ₹940.54 crore.
- Trade payable is the amount ITC has yet to pay its suppliers. Since the cash has not left the business, this amount is positive. It is relatively flat compared to FY22.
In ITC’s case, it converted ₹25,894 crore profit into cash, which is much higher than its accounts receivables and inventories. It shows that the company’s operations are generating healthy positive cash flows to fund any credit sales and invest in the business.
What does investing cash flow tell you?
The word investing has to be taken in its literal sense. In our lemonade example, you purchased a bike as an investment to earn more money from deliveries. The purchase of any capital goods like property, equipment, and vehicles that will earn you income for a long time is considered an investment.
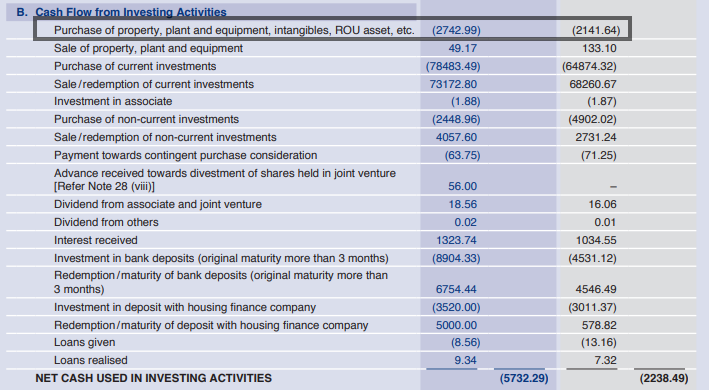
The above cash flow from investing activities is self-explanatory. Like you, even big companies invest surplus cash to earn dividends and interest.
However, the crux of this segment is to see how much the company is reinvesting in its business for expansion, acquisition, or any other activity that could help it earn more money because you are investing in ITC for the cash it earns from FMCG, hotel, agriculture, and paperboard business.
ITC spent ₹2,743 crore in the purchase of capital goods like plant, equipment, and property. This shows how the company is using its cash. If a company is acquiring another business, its investing cash flow will suddenly shoot up.
What does financing cash flow tell you?
The most crucial part of the cash flow statement for an investor is the financing cash flow. It shows you how much of the company’s cash is coming in or going out in debt and equity.
In our lemonade example, we saw that you funded the bike by taking a bank loan. When the loan passed, there was a significant cash inflow from financing activities as cash came into the business. However, the interest and principal paid on this loan will result in a cash outflow from financing activity.
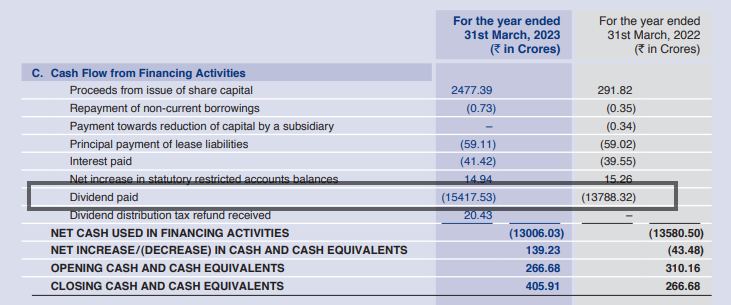
In ITC’s case, you can see that the company spent ₹15,417 crore in paying dividends to shareholders in FY23 compared to ₹13,788 crore last year. This will also be considered as a cash outflow.
What does the cash flow statement tell you about the company?
All three elements combine to tell you whether your overall business increased or decreased your cash balance. That is where you get a positive cash flow or negative cash flow.
Here is ITC’s FY23 cash flow snapshot:
Particulars | Amount (₹ crore) |
Net Cash from Operations | 18,877.55 |
Net Cash from Investing | -5,732.29 |
Net Cash from Financing | -13,006.03 |
Net Cash Increase/(Decrease) | 139.23 |
This means that in FY23, ITC increased its cash balance by ₹139.23 crore. The majority of its cash came from operations, which it used for investing and financing activities (majorly dividend payments).

ITC opened FY23 with a cash balance of ₹266.678 crore (which is the same as the closing balance of FY22). Its FY23 business activities increased its cash balance by ₹139.32 crore to ₹405.9 crore.
This was for ITC’s cash flow statement in a strong market. A company has to balance how much cash to keep and how much to use. If the market is uncertain, companies hoard more cash to keep cash flowing in the business.
(i) Phase of the business cycle
A cash flow can tell you a lot about which phase the business is in. We will go back to chapter 2 where we discussed the business phases.
A startup or company in the early stages of growth is likely to have negative cash flow from operations. Their investing cash flow is high as they reinvest the money to grow the business operations. If a company launches an IPO, its financing cash flow will be high.
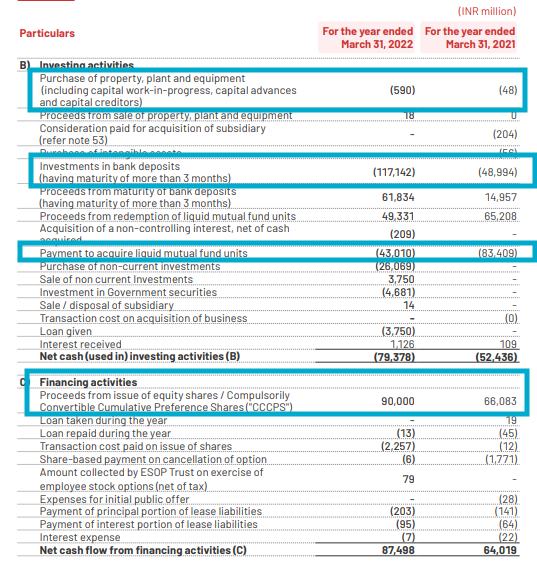
Take Zomato, for instance. Zomato launched its IPO in July 2021. If you look at its cash flow from financing activities, there is a ₹90,000 million cash inflow from proceeds from equity shares. In the short term, it parked its IPO proceeds in bank deposits and liquid mutual funds and reinvested ₹590 million in the business.
On the other hand, a company in a mature stage will have high operating cash flow and low investing and financing cash flow, as in the case of ITC.
A company’s cash flow statement is much like an individual’s financial health – a person who recently started a job (only one source of income) versus a person at the peak of his/her career with multiple sources of income (salary, investments, side hustle).
But this is only one side of the coin.
(ii) Positive vs. negative net cash flow
Remember how we said that a profitable company could have negative cash flow and a loss-making company could have positive cash flow?
Throughout the year, adding up the operating, investing, and financing activities could either give positive or negative net cash flow, which is reflected in the cash flow statement.
And just like in literature, even in business, all that glitters is not gold.
Loss-making company with positive cash flow: In the above example of Zomato, it has a positive net cash balance of ₹1,190 million. But the company has been making losses. It reported a net loss of ₹12,225 million in FY22.
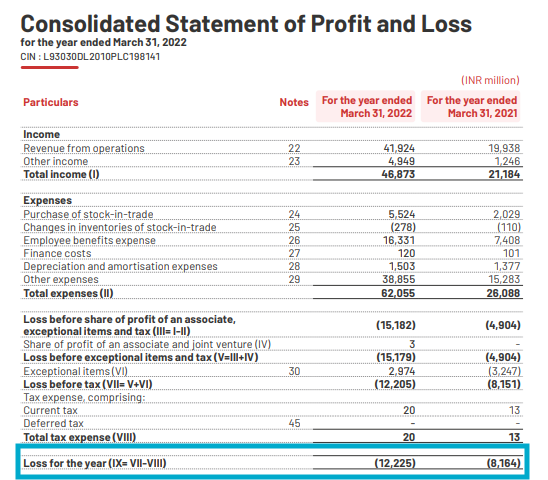
A company could also have a positive cash flow if it sold some assets like land, property, and a business segment. There will be positive investing cash, but this method needs to be more sustainable.
A profitable company with negative cash flow: A profitable company can also report negative cash flow if it has made a major investment, such as buying a plant or machinery or a major acquisition. Think of it this way: Ananya, a salaried employee earning ₹12 lakh per annum (Operating cash flow), buys a ₹1.5 crore house (Investing cash flow). So, her cash flow will be negative for that year. But that doesn’t affect her operating cash flow or her profits.
In today’s Buy Now, Pay Later world, the cash flow statement has become an ever more critical fundamental analysis.
When you look at the role our cash flow sidekick plays, it supports the P&L by providing finance from debt and equity and investing it in plant and machinery. In return, the P&L earns more cash from operations and thus continues the cycle.
Next up: The curious case of the Balance Sheet.
Summary
- A P&L statement tells you how much business a company did (billed their clients for services or sales) and how much profit/loss it made from this activity. This is called ‘accrued earnings’.
- The cash flow statement records the cash inflow and outflow of every transaction.
- If a client did not pay for a service, it is recorded in Accounts Receivables and deducted from a company’s profits. Until the client pays for the service, it comes out of the company’s pockets and reduces its cash balance.
- A cash flow statement is divided into three elements based on the source of cash. A business raises finance (debt, equity) to commence operations (cash flow from financing). It then invests in business to buy plant and equipment (cash flow from investing). Once the operations begin, cash is earned from the company (cash flow from operations).
- Each cash flow element talks a lot about a company’s growth phase.
- A startup may have negative operating cash flow as it is making losses.
- A growth-stage company may have high negative investing cash flow as it is reinvesting the money in expansion.
- A mature company may have a high positive operating cash flow and low negative investing and financing cash flow.
- All three elements tell you whether your overall business increased or decreased your cash balance. Add up the net cash from operations, investing, and financing, and you will either have a positive or negative net cash flow.
- A loss-making company can have positive cash flow if it raises money in an IPO or sells its land or business for cash.
- A profit-making company can have negative cash flow if it invests significantly in expansion, such as a new plant or acquisition.
Chapter 6: Finding Balance with the Balance Sheet
In this module, we will learn how the balance sheet takes inputs from the profit & loss account and cash flow statement and presents the overall financial report of a company. We will dive deeper into each segment of the Balance Sheet and what it infers to help you make informed decisions.
We are halfway through the journey of fundamental analysis. We have understood how to look at a company from the lens of a fundamental investor, skimming through its business model, annual report, and business operations.
While you should track the daily business routine, the company’s true worth is known from its balance sheet.
To put it in the Bollywood language,
In the movie Deewar, Amitabh Bachan says, ”Aaj mere paas bangla hai, gaadi hai, bank balance hai (Tangible assets),” and Shashi Kapoor replies, “.. mere paas maa hai (Intangible asset).”
This one statement doesn’t tell you how much they earn, but how much net worth is.
And that is what the balance sheet is all about.
The balance in ‘balance sheet’
Let’s say you have to calculate your net worth. You will list down all your financial achievements from the day you started earning. It includes everything you purchased under your name (clothes, jewelry, house, car, mutual funds, stocks) and how you financed your purchases from Day 1 of your earnings.
Going back to our lemonade example in the previous chapter, you can buy a bike either from your OWN money (your savings, money from family, payments you get from selling lemonade) or OWED money (loan from banks or creditors).
💡Remember that Assets = Liabilities + Equity
Hence, a balance sheet,
- is a sheet listing down everything you own as assets and everything you owe as liabilities since you are liable to pay it in the near or far future.
- should be balanced, meaning every asset you own should have a source of funding (Owner’s money or borrowed money). If the sheet doesn’t balance, it raises suspicion about where you got the money to buy the asset.
Note: The company is a separate legal entity. If you, the business owner, put your money into the business, the company is liable to pay you interest/returns for the money you invested. Hence, the owner’s money is owed money in the company’s balance sheet and is recorded under the head “Shareholders Equity.”
What does a balance sheet tell you?
Who and why would someone be interested in knowing your assets and liabilities?
- Who – the business owners (shareholders), creditors, suppliers, investors, customers, and any other party with financial interest in your company.
- Why – to know where the company is using the capital and if it can pay its bills and loans while making money for the owner (dividends etc).
Capital
In this context, capital is the money used for productive or investment purposes. When a business invests money to generate revenue/income or buy equipment that will help in generating revenue/income, that money is called capital.
A business is like a transaction. You always want your money’s worth and, if possible, something extra. Let’s take a daily life example. You purchase a mobile worth ₹1.5 lakh. Note that the sentence states “worth”. You know it’s basically the features and services for which you are paying ₹1.5 lakh. And you would be happy if you get something extra like an extended warranty or a 3-month subscription.
Loans and Investments are also transactions. When you give a loan to someone, you want to know where they are using the money and if they can repay the money with interest. When you invest in a company you should seek information on how they plan to use the money and if they can return you more than what you invested over a long term. This information can be obtained from the balance sheet.
Reading a balance sheet
The balance sheet begins with the business owner’s fund which they use to buy inventory and earn revenue. As the business expands, they raise capital from debt/equity to purchase assets and earn more income. This cycle continues and increases/ decreases the value of a business.
Let’s look at a balance sheet’s 3 segments:
- Shareholder’s equity
- Liabilities
- Assets
We will take each part of the balance sheet and then join them to see how all 3 balance to make a complete balance sheet.
(i) Shareholder’s equity
Every business is self-funded at the start. The owner divides his/her ownership into shares (with a face value of ₹10) and sells them to investors to raise equity capital. When you buy equity shares of a company, you become part owner and share both the company’s profits and losses.
You might wonder why shares with a face value (FV) of ₹10 are listed on the stock exchange at different prices. That is where the shareholder’s equity comes in.
All companies start at the same price point ₹10/share. Over the years, the business operations create value through profits/losses which changes the value of the stock. If a company splits a stock, the FV reduces.
Below is the shareholder equity of Eicher Motors:

If you look carefully, there are two segments: “Equity share capital,” which is the face value of shares, and “Other equity,” which is the value the company created through its business. Let’s look at the details in Notes 17 and 18.
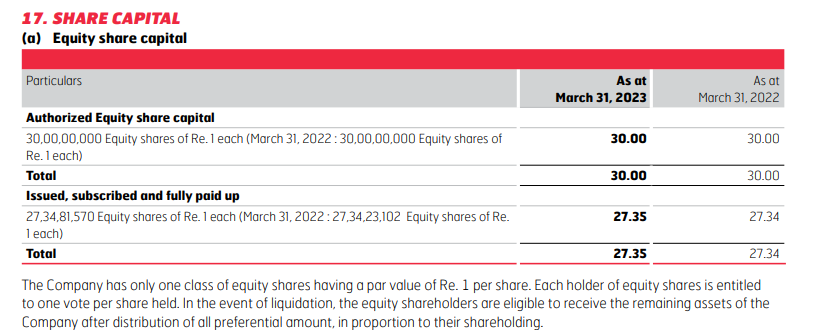
Eicher Motors has divided its ownership into 30 crore equity shares with FV of ₹1. However, it has only issued 27,34,81,570 shares so far. It can issue the balance shares as and when it needs more capital. The FV of Eicher Motor shares is ₹1/- as the company did a 1:10 stock split in February 2023. For every 1 share of Eicher Motors, shareholders got 10 shares, which reduced its FV from ₹10 to ₹1.
Note: A company does a stock split if its trading value on the stock exchange increases, making it difficult for retail investors to buy shares.
The value of “other equity” is higher as it shows the value the company generated over the years.
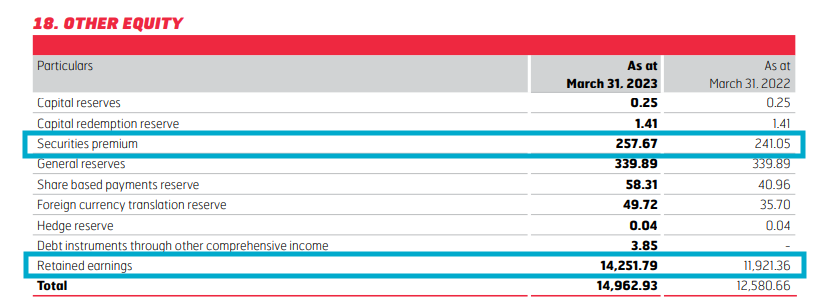
Line 3 – Securities Premium is the amount the company raised by selling its shares in the stock market at a premium to its FV.
Line 9 – Retained earnings. Every year the company earns net profit (the outcome of the P&L statement). It allocates this profit in various reserves and leaves the rest in retained earnings.
Reserves are like a pool of funds a company sets aside for a specific purpose.
Capital reserves are to fund future asset purchases, mergers, expansions etc.
General reserves are for general purposes such as additional inventory, marketing etc.
As all this money is earned and retained in the company, it increases the value of your equity share.
💡 Book value of equity share = Total value of equity ÷ Number of issued shares
Book value per share tells you how much money the company holds for every share. A strong company’s share generally trades at a price higher than its book value.
(ii) Liabilities
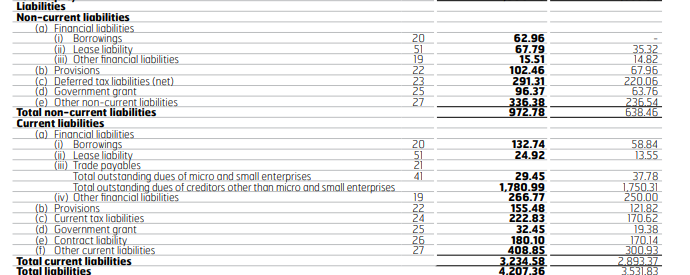
Liabilities are the company’s payment obligation in the next 365 days (current liabilities) and in the long term (non-current liabilities).
Financial liabilities are various types of loans that charge interest. Any principal amount of long-term loans to be repaid in the next 365 days is deducted from non-current liabilities and added to current liabilities. For instance, you took a ₹10 lakh loan for 10 years and you will be paying ₹50,000 of the principal amount in the next 12 months. Your current liabilities will appear as ₹50,000 and non-current liabilities as ₹9.5 lakhs.
This logic applies to all similar line items in current and non-current liabilities.
Provisions come from the term “provide for”. It is the amount the company sets aside for any upcoming payments, dues, or losses. It is mostly related to payments of employee benefits like bonuses and pensions.
Trade/Account Payables is the amount the company has to pay its suppliers and is associated with the daily business operations. It is a category specific to current liability.
All other line items are self-explanatory and show a company’s short and long-term obligations.
(iii) Assets
Liabilities tell you what the company has to pay. Assets tell you whether it has the liquidity to pay its liabilities.
💡 Liquidation: Liquidation is the process of converting an asset into cash.
Like liabilities, assets also have current and non-current assets. However, there is no 365-day rule in current assets. The classification is based on the liquidity of the asset.
Current assets
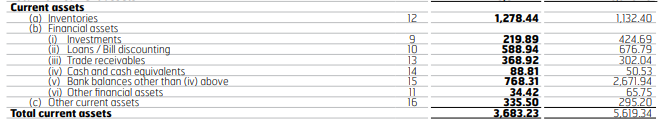
Current assets have specific line items like:
Cash and cash equivalents and bank balances are the most liquid assets. This line item is the outcome of the cash flow statement where we take the opening cash balance and adjust for the inflow and outflow of cash from operations, investing, and financing to determine the ending cash balance.
Trade/Accounts Receivables is the revenue the company recorded but did not receive complete payment for. These are the products sold on credit. As the company gets the payment, the Accounts Receivables amount reduces.
Inventories are the raw materials and goods stored by a company to sell in the market. Inventories can be at various stages: raw materials, work-in-progress/unfinished goods, and finished goods. Keeping the inventory requires warehousing costs and is crucial in daily operations. If an inventory gets damaged or becomes obsolete (i.e. the product lifecycle is over; for instance, medicines have passed their expiry date), the company has to write off the inventory by reporting a one-time expense.
For instance, a pharma company has an inventory worth ₹1 lakh and the medicine will expire in two days. They cannot sell this inventory anymore as it has become worthless. It will reduce the Inventory amount by ₹1 lakh from the Balance Sheet. This is called writing off the inventory. This amount of ₹1 lakh will appear as “write-off” expense in the P&L statement as the company bears the cost of obsolete inventory. Hence, companies must maintain a reasonable amount of inventory they can sell.
A company uses its current assets to pay its current liabilities. Hence, the company has to keep a fine balance between the two to ensure a smooth flow of cash in and out of the business.
Fixed assets
Any asset that is not easy to liquidate is fixed or illiquid. Some even call them “non-current assets” or “long-lived assets”.
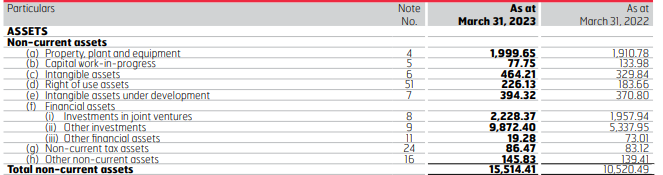
Intangible assets are those things that you cannot touch and feel but have an economic value and help you get a royalty or premium. These include patents, intellectual property (IP), trademarks, copyrights, goodwill, etc. Many technology and pharma companies develop an intangible asset (patent). All the costs incurred to develop the product can be accumulated here as intangible assets.
In the case of Eicher Motors, it makes motorbikes and trucks. Hence, it capitalizes its product development cost in “Intangible assets under development”. This includes all the costs incurred till the bike and truck are tested and ready for mass production. When the company produces/manufactures the bike and truck, that cost is included in the P&L as the cost of goods sold.
Property, plant, and equipment (PPE) purchased to perform business operations are mentioned here. But if the company purchased a building as an investment (maybe to lease it to someone else), it will be categorized under Investments. The idea is to show the assets that are in use for business operations.
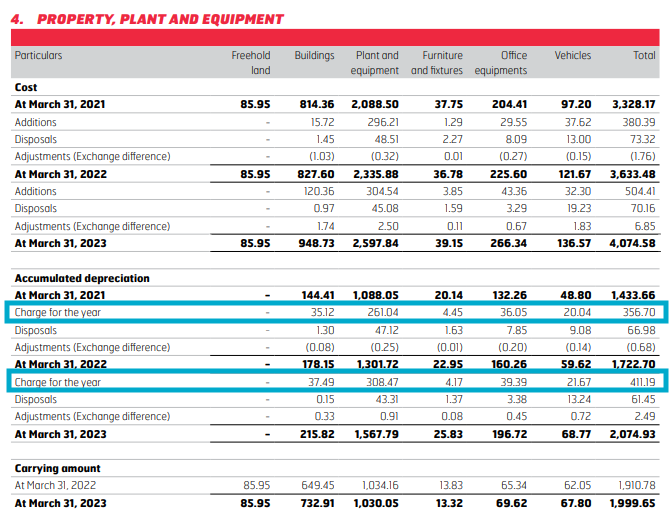
Depreciation and impairment
All fixed assets have a useful life during which they contribute towards generating revenue. For instance, Eicher Motors spends its largest capital on property, plant and equipment. This is a one-time cost of thousands of crores of rupees. How can you incorporate this cost into your business? That is where depreciation comes in.
Depreciation divides the capital cost throughout the useful life of the asset. In other words, depreciation is the expected wear and tear of the fixed asset over a fixed period.
Sometimes, an asset loses its value at a faster rate because of a natural calamity or an incident. At that time, the asset is impaired (weakened or damaged). Since the asset’s value has fallen below the book value (a value that appears on the Balance Sheet), the company reduces the asset price and tags the lost value as ‘Impairment’. The company adds the Impairment amount as an expense in the P&L statement as it has to bear the cost.
For instance, Ravi spent ₹8 lakhs on a taxi that will last 10 years. He has to earn this money back from the taxi fare.
Depreciation – He will divide the ₹8 lakh cost over a 10-year period as the “depreciation cost” and recover the amount. He will deduct the depreciation amount from the asset value and add it as an expense in the P&L statement.
Impairment – One day, his taxi met with an accident and the value of the car fell to ₹1 lakh. But in the books, the depreciated value of the car is ₹5 lakhs. Ravi will incur a ₹4 lakh impairment expense from his pocket, which will reduce his profit for that year.
These long-term assets will help the company earn money to pay long-term liabilities and give returns to shareholders. Here again, the company is balancing its assets to match the liability and transfer the balance amount to owners (Retained Earnings of Shareholder Equity).
Looking at the balance sheet as a whole
Now let’s join the three parts and look at the complete Balance Sheet.
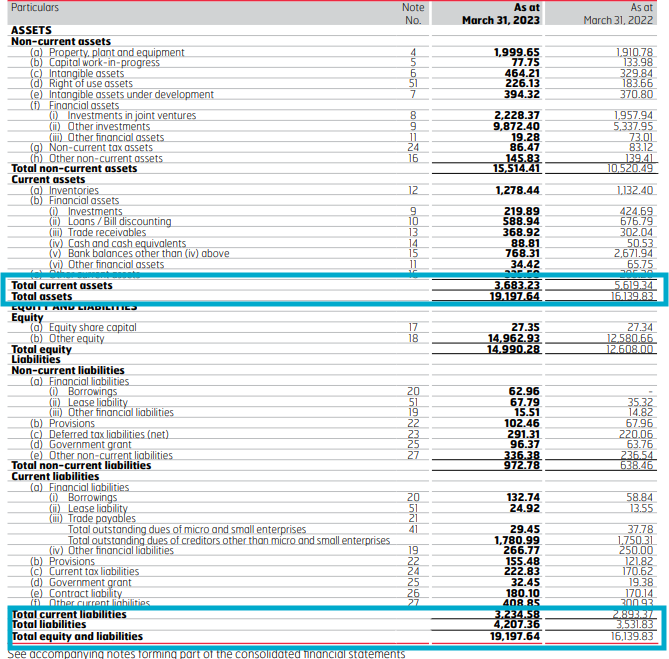
Look at the above Balance Sheet from a liquidity POV. Eicher Motors has ₹3,683.2 crores in current assets, which is enough to pay its ₹3,234.5 crores in current liabilities.
The company’s total liabilities of ₹4,207 crore are significantly lower than its Shareholder Equity of ₹14,990 crore. This shows that the company has more Owned funds than Owed funds, which means its debts are at comfortable levels.
Where all the statements intertwine
Throughout the chapter, you must have noticed some elements of P&L and cash flow statements keep popping up. It is because these daily business operations have an impact on the overall value of the company.
All three of these stories – the P&L statement, cash flow statement, and balance sheet – are intertwining at certain intervals affecting each other.
The cycle of the P&L statement: A company makes a sale, incurs operating expenses and finance costs, deducts depreciation, and adds other income from investments to arrive at the net profit. Each of the five elements of the P&L statement affects a line item in the Balance Sheet.
P&L’s Impact on the Balance Sheet
Sales for which you didn’t receive the payments change Accounts Receivable (Current Asset) and Cash Flow From Operations (CFO).
Operating expenses change Accounts Payable (Current Liabilities), Inventory (Current Asset), and CFO.
Net Profit is added to your Reserves and Surplus and changes CFO.
Balance Sheet’s Impact on the P&L
The debt (Non-current liability) a company takes or repays changes its Finance cost (interest and processing fees) and Cash Flow From Financing.
The asset (Non-current assets) a company purchases or develops is gradually expensed as depreciation (P&L).
Investments (Assets) the company makes generate returns and interest that is added as Other Income (P&L) and affect Cash Flow From Investments (CFI).
💡Tip: This whole exercise is to help you visualize how one transaction affects several line items. Try reading 5-6 Financial statements of companies in different sectors. Visualizing the transactions comes with practice.
As the company’s story unfolds, the financial statements leave the climax open to debate. Every person analyses and interprets these statements differently. If everyone could see what Warren Buffett saw in the financial statements, he wouldn’t be the billionaire investor he is today.
Now that you can read and understand a financial statement, the next step is to analyze them.
Get ready to use all that you have learned so far to analyse a company in the coming chapters.
Summary
- The balance sheet is a sheet that lists everything a business owns and owes and balances the two. Every asset is funded by a liability or business owner’s money.
- A balance sheet is used by anyone with a financial interest in the company (shareholders, creditors, suppliers, employees) to know if the company can fulfill its payment obligations and make money for shareholders.
- A balance sheet has three segments:
- Shareholder’s equity: It is the face value of the company’s equity shares and how reserves and surplus accumulated over the years enhance the book value per share. Even the owner’s fund is a liability for the company as it is obligated to give a share of its earnings to shareholders.
- Liabilities: They are loans and provisions payable in 365 days (current) and the long term (non-current liabilities).
- Assets: The current assets comprise cash, trade receivables, and inventories. If the inventory becomes obsolete or is damaged, it is written off and affects the company’s profits.
- Fixed assets include intangible assets (patent and goodwill) and tangible assets (property, plant, and equipment). The wear and tear of assets is deducted as depreciation whereas the damage to the asset is deducted as impairment and affects the company’s net profit.
- The balance sheet has to be balanced such that current assets are sufficient to meet the current liabilities. The equity and debt levels should also be balanced to ensure a smooth flow of cash in and out.
Chapter 7: Ratio Analysis Part 1: Finding Trends
This chapter will give an analytical view of financial statements. We will look at some popular financial ratios that show a connection between P&L and balance sheets to understand the trends within the company and its peer group. At the end of the chapter, you will know how to use ratios as clues to find anomalies.
We ended the last chapter by noting that financial statements are intertwined. The first half of the story begins with shareholders’ equity or debt used to buy assets to produce goods and services (operating expenses) and sell them (sales) with the intent to make a profit.
This profit is accumulated in reserves & surplus and sales on credit (yet to be paid for by the customer) are accumulated in accounts receivables.
You can analyze this interrelation between P&L and balance sheet using ratios.
What are ratios and how do you read them?
Ratios are a mathematical way of comparing two things that have a relation.
When we say the teacher-to-student ratio in a class is 1:10, it means that for every 10 students, there is 1 teacher. This 1:10 ratio can be applied to any volume – hundreds, thousands, millions, trillions. School A has 500 students and 50 teachers, whereas school B has 5 lakh students and 50,000 teachers. Both have the same ratio of 1:10. Ratios make such large numbers easily comparable.
Another way to look at ratios is through percentage, where you compare a portion with the whole. Suppose a pizza is divided into 8 slices, of which you eat 2. As the 2 slices were derived from those original 8 slices, your ratio would look something like this:
2/8, i.e., you ate 25% of the whole pizza.
Now that you know how to read ratios, we will look at some popular financial ratios and analyse them.
How to analyze data?
Remember, analysis is all about examining something in detail to discover more about it. The best way to start is to keep it simple. When you observe an object or behavior, you start with a base and see the trend over time and how it reacts to different situations.
For instance, the Zoom video calling app saw a sudden surge in demand during the pandemic as the world took to virtual meetings. The company raked in good moolah in that one year. Once the lockdown was over, the demand fell, competitors came in, and the company could not sustain its profits.
Zoom Communications | 2018 | 2019 | 2020 | 2021 | 2022 | 2023 |
Net Profit Margin | -3% | 2% | 4% | 25.40% | 33.60% | 2.40% |
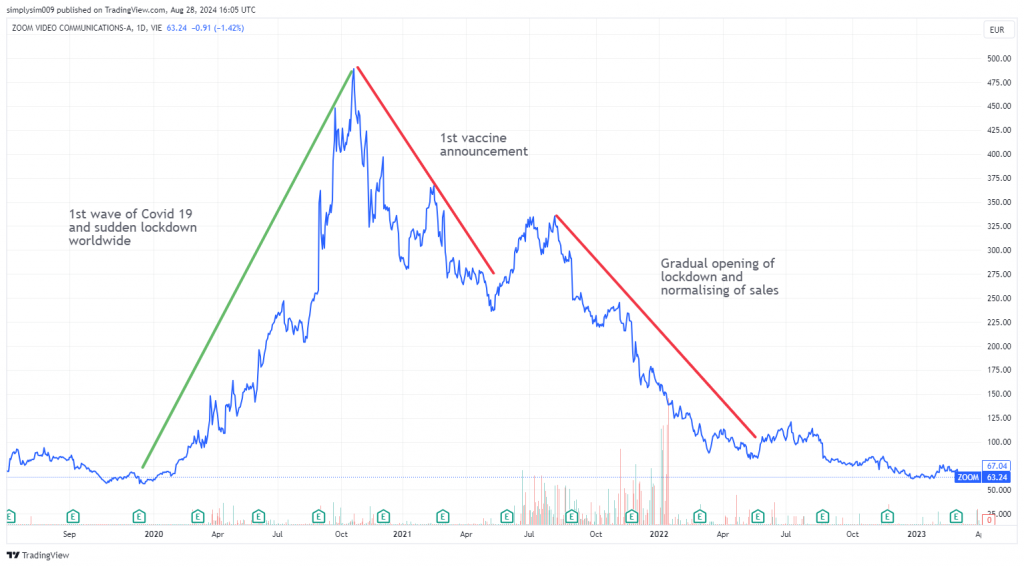
Another way to observe a company’s performance is by comparing it with its peers, i.e., comparing apples with apples. Even within apples, you should be specific about what you are comparing – are you comparing how red they are or their sweetness or size?
When you buy a phone, do you only consider the aesthetics and decide? No, you look at several parameters, such as battery life, camera quality, storage, quick charge, OS, and other features. But you won’t compare a button phone with a smartphone, even though both are phones.
For instance, if you compare a bowler to a batter based on batting skill, even though both are cricket players, you must factor in the difference. You must expect a bowler to give you a different run rate than your ace batter. But it is considered good if he gives you an average or above-average run rate.
This exercise adjusts your mindset to a fair analysis because ratios cannot be seen in isolation, and no absolute judgment can be derived just by looking at one ratio. You have to look at ratios in totality to get a clear 360-degree view of the situation before you make a decision.
Types of financial ratios
Financial ratios compare the balance sheet and P&L items to check a company’s financial skills on four fronts:
Operating Ratios – How efficiently the management is converting assets into revenue
Profitability Ratios – How much profit the management is generating from the capital and assets
Leverage Ratios – How efficiently the company is managing its debt and staying solvent
Valuation Ratios – Comparing the company’s book value with its stock price
💡Book Value: Book value per share tells you how much money the company holds for every share. A strong company’s share generally trades at a price higher than its book value.
As a fundamental investor, why do you need to know about these ratios to analyze the company’s trend over the years and compare it with peers?
Let’s say you invest ₹15 lakh in your friend’s business as an equity shareholder, becoming a part owner. You would want to know what he is doing with your money, wouldn’t you? Is he buying a vacation home or repaying his debt? Suppose he buys five tempos (for ₹3 lakhs each) for his logistics business. As part-owner, you would want to know how much revenue these tempos generate and whether they can cover their costs and generate profits. You would also want to know if your friend handles his debt without affecting your returns.
Wearing a business owner’s hat, let’s analyze each ratio. We will also share a basic formula, but you can tweak it according to the business and situation. There is no good or bad; the interpretation of these ratios is subjective to the company and situation. Hence, focus on understanding the logic behind the ratio, whether good or bad, not the computation.
You can look at operating and profitability ratios as follows:
- The numerator is the skill you are testing
- The denominator is the basis of your testing
Operating ratios
We are testing the company’s revenue-making skills in operating ratios from existing assets/debt/Shareholders Equity. Some of the common ones are:
- Fixed Assets Turnover Ratio
- Inventory Turnover Ratio
- Receivable Turnover Ratio
Before we get into ratios, here are the two financial statement terms you will keep running into. Here’s how you should look at these terms.
Revenue: Turnover refers to the revenue generated from operations. Companies also generate income from other sources but that will not tell you how efficient your business operations are. Hence, you might see two types of revenue (Operating Revenue and Total Revenue). We will understand this in more detail as we proceed with specific ratios.
Asset: During a financial year, a company may buy and sell assets and some assets may depreciate, changing the value of assets. Some analysts use the value of the asset at the end of the financial year and some use the average value of the asset of the last and current financial year. Here it is your call which value you want to use. We will be showing you the calculation for both Total Asset Value and Average Asset Value.
The relevancy of the first three ratios will depend on the type of business you are analyzing. We will take the Eicher Motors example and try to calculate the ratios simply by determining the base that you want to analyse the turnover with.
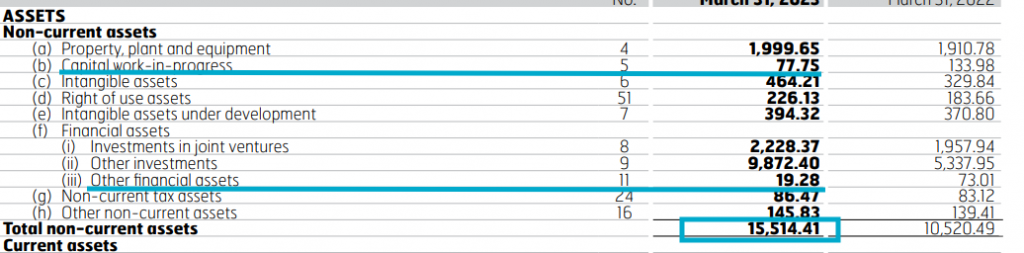
(i) Fixed assets turnover
Fixed Assets Turnover = Operating Revenues / Total Fixed Asset x 100
Eicher Motors is in the manufacturing and selling of bikes and trucks. Hence, it is a company whose fixed assets like plant, property, and machinery are important. In its fixed assets two segments may not be actively involved in generating turnover:
- ‘Capital work in progress’ comprises expenditure for buildings, plants during construction, and machinery yet to be installed. You can determine whether to keep it or remove it.
- ‘Other financial assets’ include investments in bank deposits above 12 months.
Since the above two items don’t meet our purpose, we will deduct them from the fixed asset (₹15,514.41 – (₹77.75 + ₹19.28) = ₹15,417.38).
Now that we have calculated the denominator (Total Fixed Asset), let’s calculate the actual ratio.
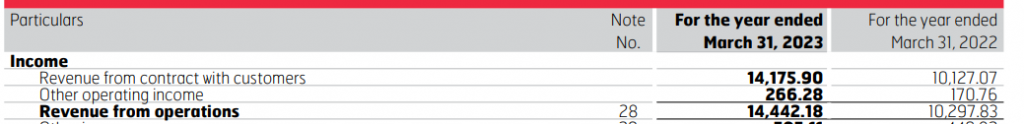
Hence, the operating revenue = ₹14,442.18
Eicher Motors Fixed Asset Turnover = 14 442.18 / 15,417.38 x 100 = 93.67%
What it means: The company is generating revenue of 93.67% of its fixed assets. This number looks good, but is it good? To identify this, we will compare it with the last five years.
Particulars | 2019 | 2020 | 2021 | 2022 | 2023 |
Operating Revenue (in crores) | ₹9,797.06 | ₹9,153.58 | ₹8,720.35 | ₹10297.83 | ₹14442.18 |
Fixed Assets* (in crores) | ₹6,677.37 | ₹6,024.30 | ₹5,663.36 | ₹10,313.50 | ₹15,417.38 |
Fixed Asset Turnover | 147% | 152% | 154% | 100% | 94% |
Looking at the last 5 years’ trend, the fixed asset turnover has decreased because the company tripled its fixed assets in the last three years to increase its revenue. You can read the Annual Report’s Management Discussion & Analysis, in which the company discusses its expansion plans and the road ahead.
A high Fixed Asset turnover is good, but a decline in the ratio could also be good, as it supports revenue growth. Comparing it with peers like Honda Motors or TVS Motors will give you a fair idea of the industry standard and where Eicher Motors stands.
We calculated the above ratio using the Total Value of the Fixed Asset. Now, we will see how to calculate the same ratio using the Average Value of the Fixed Asset.
Average Fixed Asset
Average Fixed Asset = 2022 Fixed Asset + 2023 Year Fixed Asset / 2
= (₹10,313.5 + ₹15,417.38) / 2
= ₹12,865.44
Average Fixed Asset Turnover = 14 442.18 (Operating Revenue) / 12,865.44 (Avg Fixed Asset) x 100 = 112%
Particulars | 2019 | 2020 | 2021 | 2022 | 2023 |
Operating Revenue (in crores) | ₹9,797.06 | ₹9,153.58 | ₹8,720.35 | ₹10,297.83 | ₹14,442.18 |
Average Fixed Asset (in crores) |
| ₹6,350.84 | ₹5,843.83 | ₹7,988.43 | ₹12,865.44 |
Average Fixed Asset Turnover |
| 144% | 149% | 129% | 112% |
You can experiment with the denominator and compare Reveneu with different parameters, such as
Average or Total Assets (Fixed + Current)
Average or Total Shareholder Equity
Average or Total Debt
Average or Total Working Capital (Current Assets – Current Liabilities)
FYI: Working Capital turnover is also called the Current or Net Capital.
The above ratios will tell you how much revenue the company is generating for every Re. 1 of the Denominator (Total Asset, Shareholder equity, Debt, Working Capital).
Which ratio to use: If a company has significant debt, you should know the debt turnover ratio. An asset-light company like Uber doesn’t have substantial fixed assets. In that case, you might consider Total Asset Turnover. The owner/investor might be interested in shareholder equity turnover in startups. These examples can help you start thinking analytically.
As you analyse more companies, you can build your own ratios. A company will likely compute ratios in a way that shows beneficial trends. The ratios can be easily manipulated depending on what you add and subtract from the numerator and denominator. Hence, it is suggested that you compute the ratios yourself.
(ii) Inventory turnover ratio
This ratio tells you how the company manages its inventory and whether it stocks enough goods to meet the demand and earn revenue. It can be divided into two parts:
(a) the turnover ratio tells you how many times a company restocks its inventory and
(b) how many days it take for the company to convert its inventory into revenue (turnover).
Unlike other turnover ratios, we take cost of goods sold (COGS) in the numerator as the inventory is held at COGS. For instance, Company A produces a pen at a cost of ₹5 and sells it for ₹7. Its COGS is ₹5 per pen. It sells 200 pens and has 100 pens stocked up in the inventory. In this case, its COGS would be ₹1,000 (₹5 x 200 pens sold) and the inventory value would be ₹500 (₹5 x 100 pens in stock).
This ratio is essential for companies that store goods until they are sold (retailers, manufacturers, and farmers).
To derive our Numerator (COGS) in the Eicher Motors example, we will add the 3 segments highlighted in the image below:
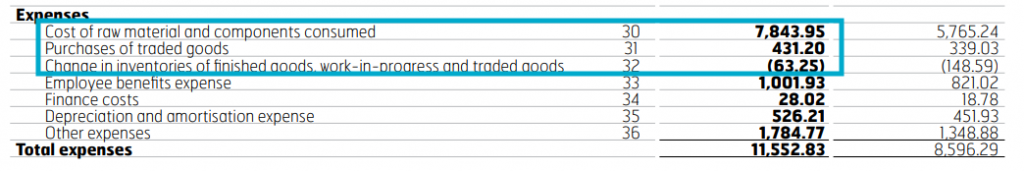
COGS = (7843.95 + 431.20 + (63.25))
= 8,211.9
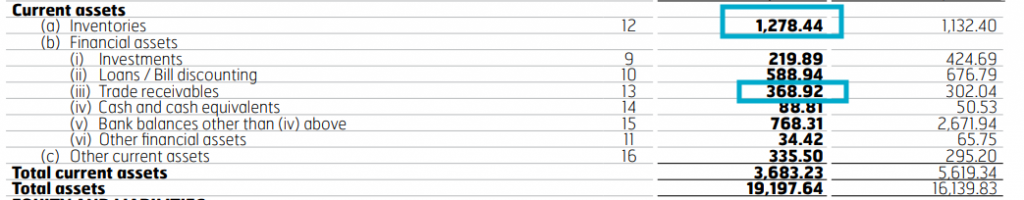
Inventory Turnover = Cost of Goods Sold / Inventory
= 8,211.9 / 1,278.44
= 6.4 times
This means the company replenishes its inventory 6.4 times in a year, which, if converted into days will be:
Number of Inventory days = 365 / 6.4
= 57 days
Particulars | 2019 | 2020 | 2021 | 2022 | 2023 |
COGS (in crore) | ₹5,057.38 | ₹4,995.94 | ₹5,112.77 | ₹5,955.68 | ₹8,211.90 |
Inventory (in crore) | ₹633.38 | ₹572.35 | ₹874.6 | ₹1,132.40 | ₹1,278.44 |
Inventory Turnover | 7.98 | 8.73 | 5.85 | 5.26 | 6.42 |
Days of Inventory | 45.71 | 41.82 | 62.44 | 69.40 | 56.82 |
The rupee value of inventories doesn’t tell you if it is high or low compared to the demand (COGS). Hence, you look at the inventory turnover ratio. Very low or very high inventory days might raise questions.
Low inventory – Why is the company not producing enough? Is it because of a lack of funding, low demand, or plant outage?
High inventory – Is there a supply shortage of raw materials? Has the demand for goods fallen, preventing the inventory from selling? Or is it because the company is stocking ahead of a new product launch or wedding season?
Again, you must look at the trend to analyze whether inventories are healthy or problematic.
Like this, you can also calculate the days of:
Accounts Payables
Accounts Receivables (here you will use Operating revenue instead of COGS)
Cash conversion cycle = Days of Inventory + Days of Receivables – Days of Payables
The cash conversion cycle tells you how many days the company takes to convert its inventory into cash.
Now try calculating the cash conversion cycle for Eicher Motors and analyse the numbers yourself!
So far, we have examined a company’s efficiency to generate revenue. The next most important aspect for an investor is PROFIT, the end objective of every business.
Summary
Ratios can be used to see the breakdown of things in numerics (3:2) or percentages (60%). A ratio standardizes the numbers and makes them comparable with others. For example, if you ate 2 slices of an 8-slice pizza, you ate 20% of the pizza.
Analysing data (ratios) requires you to observe a pattern in the ratios over time and in different situations and compare it with peers to understand where the company stands.
While analyzing the ratios, you have to keep clarity on two things:
What skills (profits, revenue) of a company you want to measure – Numerator
Against what parameters (assets, debt, equity) you want to measure it – Denominator
Fundamental analysts broadly use four types of financial ratios: operating, profitability, leverage, and valuation.
Balance sheet items can be used in two ways: the total value at the end of the financial year or the average of last year’s and current year’s values.
Operating ratios test the company’s revenue-making skills from assets, debt, or Shareholders Equity
Recalling all the important rations:
Fixed Assets Turnover = Operating Revenues / Total (Average) Fixed Asset
Days of Inventory = Cost of Goods Sold / Total (Average) Inventory
365/ Inventory Turnover
Cash conversion cycle = Days of Inventory + Days of Receivables – Days of Payables
Chapter 8: Ratio Analysis Part 2: Understanding the Nuances
This chapter will help you understand the nuances of EBIT and EBITDA, ROE and ROCE. We will analyse these profit measures through portability ratios and try to interpret the profit-making skills of the company.
Before we get into the nitty-gritties of profitability ratios, let’s take a halt and discuss EBITDA and EBIT, the two most commonly used – and often, confusing – terms.
EBIT = Earnings Before Interest and Taxes
EBITDA = Earnings before Interest, Taxes, Depreciation and Amortization
Lets say, Vinod is an average Indian with a monthly salary of ₹1 lakh. His monthly expense is ₹30,000 and ₹50,000 goes into EMI (car loan, home loan, personal loan) and ₹5,000 in taxes. If we were to calculate EBIT of Vinod:
Salary | ₹100,000 |
Monthly Expenses | -₹35,000 |
Loan EMIs | -₹50,000 |
Taxes | -₹5,000 |
Income in Hand | ₹10,000 |
EBIT | ₹65,000 |
Wait, what?! Where did that ₹65,000 come from???
Vinod would have ₹65,000 left after his expenses had he lived in a tax-free and debt-free world.
That’s EBIT and EBITDA for you!
If we compare a company’s expenses with an iceberg, EBITDA is just the tip of the iceberg. It only shows the income a company earned from its revenue without taking into consideration the cost incurred (debt and equity) to buy the assets.

But we live in a world where taxes and debt do form a significant part of our expense.
Then why consider EBITDA in the first place? Wouldn’t it be misleading?
It would if you look at EBITDA in isolation. The key reason for EBITDA is to compare one’s operations with that of another.
Let’s say Vinod has a colleague Suraj, with the same qualifications, experience, job profile and salary. But Suraj has an EBIT of ₹40,000 as he has higher expenses. In this case, everything else remaining constant, Vinod seems to be doing better than Suraj.
With this basic understanding of EBIT and EBITDA, now let’s understand the profitability ratios and why we introduced these terms now.
Profitability ratios
(i) EBITDA margin
EBITDA margin = EBITDA / Revenue
Unlike other ratios, it is a pure P&L ratio that tells you how much percentage of revenue was left as Profit after deducting the recurring expenses as in the case of Vinod. The recurring expenses that are directly related to generating revenue (cost of goods sold, marketing, distribution, salaries) are called operating expenses. They are common for all companies doing similar work.
When you deduct these operating expenses from revenue, you arrive at EBITDA, everything else remaining constant.
Suppose you have to compare Pepsi and Coca Cola, you will look at their EBITDA to determine which company is doing better on the operations front, which means at selling sugar water. EBITDA here could be the differentiator for an investor.
Now, how to calculate EBITDA.
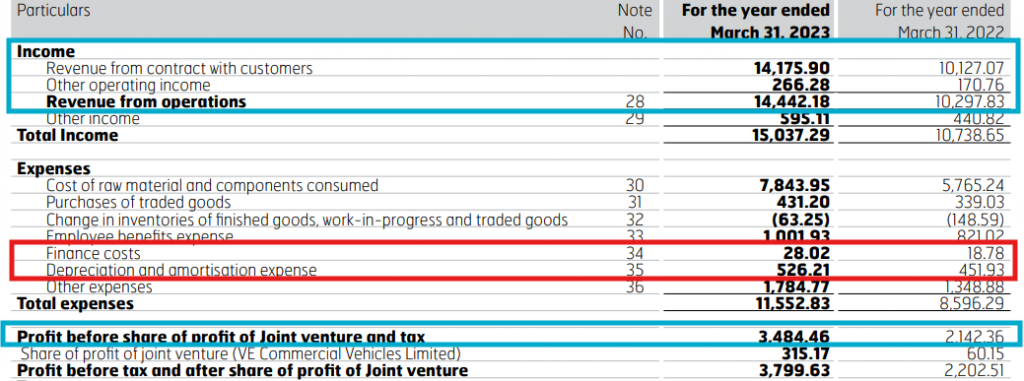
In the case of Eicher Motors, we have Profit Before Tax. We only have to deduct the Interest (Finance cost), Depreciation and Amortization from this profit to arrive at EBITDA.
Eicher Motors EBITDA = Profit before Tax – (Finance Cost + Depreciation and Amortization)
= 3484.46 – (28.02 + 526.21)
= 2,930.23
EBITDA Margin = 2930.23 / 14,442.18
= 20.23%
FYI: Going back to the pizza example in the previous chapter – if we ate 2 slices of the 8 slices of pizza, the EBITDA would be 2 and the EBITDA margin would be 25%.
EBITDA margin is a popular ratio as it helps you compare the operating profits of two companies.
You can replicate the margin (profit as a percentage of revenue) formula in other line items of P&L:
EBIT
Operating Expense
Net Income
You can choose a ratio depending on the relevance of the numerator. For instance, EBITDA is only relevant when the company has significant fixed assets or debt. Because then it will have a high depreciation and amortization expense.
Asset-heavy industries like manufacturing, airlines, telecom etc. place special emphasis on EBITDA to showcase their operating performance.
A software company has an asset-light model where depreciation and amortisation may not be significant. However, it might compete with peers of other countries that follow a different tax structure. Here you can use EBIT (before interest and tax) margin to compare their operating performance.
In a game of cricket, if you were to analyze the performance of a batter and a bowler, you would give more weightage to a batter’s run rate (numerator) and a bowler’s wickets (numerator). Similarly, you will first study a company’s business model and read the financial statements to understand which line items (EBITDA, EBIT, net income) you should give weightage to.
Till now we were comparing different types of profits with revenue. Now let’s change the denominator and compare the profit with the Balance Sheet items:
Capital Employed
Shareholders’ Equity
Assets
Here again, you can use the value of the above balance sheet items at the end of the financial year or calculate the average value of the last and current year.
(ii) Return on capital employed (ROCE)
Return on Capital Employed (ROCE) = EBIT / Capital Employed
Capital Employed means how much capital (debt + equity) is being used in the business to generate profit and is calculated as
Capital Employed = Long Term Debt + Equity
It excludes short-term debt as that capital will be paid off within 12 months and no longer contribute to profits.
EBIT: As short-term debt is excluded from the denominator, we have to exclude the cost of debt (finance cost) from the Numerator. Hence, we take EBIT (Earnings before interest and taxes) as the numerator. Remember, you have to adjust your numerator with the denominator.
The ROCE will tell you how much EBIT the company earned for every ₹1 of capital employed, without giving a bifurcation of how much return is from equity and how much from debt.
Startups and small companies may have low ROCE as they have deployed significant capital and have little to no profits. A high ROCE might look attractive but if the debt portion is high, it might not be attractive for equity shareholders.
Hence, you have to look at ROCE alongside ROE (Return on Equity).
(iii) Return on equity (ROE)
Return on Equity = Net Income / Shareholder’s Equity
(Here we used net income as that is what shareholders get as return.)
Remember the phrase, “Higher the risk, Higher the Return”?
In the case of ROE and Return on Capital Employed, the risk is Debt.
Let’s take a hypothetical scenario, and see how these ratios change with the change in the debt level, with everything else remaining constant.
EBIT | 60 | 60 | 60 |
Capital Employed (Debt + Equity) | 1000 | 1000 | 1000 |
ROCE | 6.0% | 6.0% | 6.0% |
1. Net Income | 50 | 50 | 50 |
a. Debt | 300 | 500 | 700 |
b. Equity | 700 | 500 | 300 |
ROE (1/b) | 7.1% | 10.0% | 16.7% |
The company’s debt grows from 300 to 700 while net profit, EBIT and total capital employed remain constant.
ROCE remains the same as it is a sum of debt and equity. However, ROE increases with an increase in debt as the net profit is distributed across a smaller portion of equity shareholders. If you look at the ROE table,
in the first scenario, ₹50 Net Income is being distributed among 70 shareholders (assuming 1 share = ₹10)
in the third scenario, ₹50 Net Income is being distributed among 30 shareholders, lowering the number of beneficiaries.
If a company has high debt, ROCE may not give you the true picture of the risk. In this case, a higher ROE will come with higher risk as creditors have the first right to the company’s assets.
Interpreting the ROCE and ROE from an investor point of view
A company can increase its return on equity either by increasing its net income (numerator) or decreasing its shareholder equity (denominator) through share buybacks. Hence, it is important to understand what is causing ratios to surge and if that cause is sustainable.
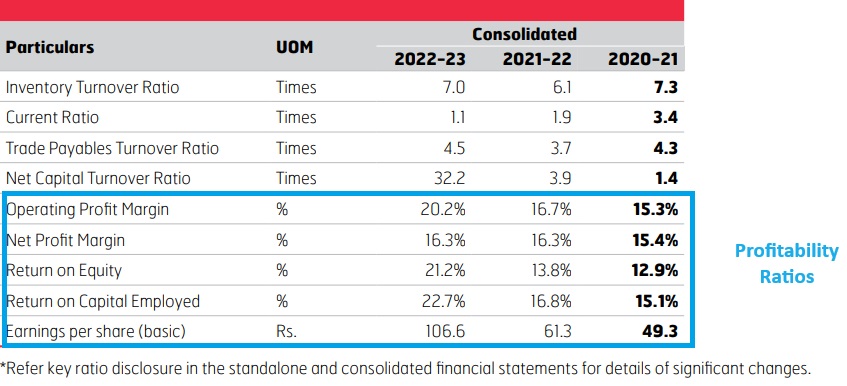
In the case of Eicher Motors, the company’s Return on Capital Employed and ROE increased simultaneously, alongside the operating margin, hinting that the surge was due to rising profits.
(iv) Return on assets (ROA)
ROA = Net Income / Total Asset
The ROA will tell you how much net income the company earned for every ₹1 of assets. If Company A has an ROA of 45% and Company B of 8%, which company would you choose?
The answer is more complex than choosing the one with a higher ROA.
ROA is especially relevant in companies with high fixed assets like real estate and airlines. Such companies have a low ROA since they are capital-intensive. As for asset-light companies like software and accounting services, ROA is high. Hence, it is important to compare the ratios of two companies in the same industry.
Then you have to look at the trend of the ROA, whether it is increasing or decreasing and Why?
Particulars | 2019 | 2020 | 2021 | 2022 | 2023 |
Net Income | ₹2,202.73 | ₹1,827.44 | ₹1,346.89 | ₹1,676.60 | ₹2,913.94 |
Average Fixed Asset |
| ₹6,350.84 | ₹5,843.83 | ₹7,988.43 | ₹12,865.44 |
Return on Asset |
| 29% | 23% | 21% | 23% |
In our Eicher Motors example, the company significantly increased its fixed assets in 2022 and 2023 to expand capacity and grow revenue and net income. Hence, its ROA saw a pullback in 2022 before increasing in 2023.
Interpreting Operating and Profitability Ratios
In all the above examples of operating and profitability ratios, you can see that a high ratio may not always be good and a low ratio might not always be bad. Ratios only standardize the overbearing numbers of millions and crores into 1 to 10 or 1% to 100% and make them comparable. You have to use your understanding of how the money flows in the business and use ratios as a tool to verify the efficiency of the money.
However, the efficiency and profitability ratios alone are not sufficient to tell you if the stock is a ‘buy’. You also have to look at the debt baggage the company is carrying, and identify if it is a “good debt” or “bad debt”.
The good and bad of debt
Debt as we know it is a loan that banks and bondholders give companies for a fixed period, in return for a fixed return called “interest’. This loan can bring immediate cash, helping fund business projects and expansions. Moreover, the interest on the debt is tax deductible, helping the company earn higher net income.
However, debt brings with it obligations to pay interest and repay the principal, irrespective of the company’s financial situation. And that is where the risk factor comes in. The good and bad of debt depends on the debt level a company can handle without impacting its operations.
Good Debt is when the return on capital is higher than the cost of debt. For instance, a company takes a loan at 5% interest to buy an asset. The return on the asset is 8%, the asset is earning its interest and also contributing to the company’s profit.
Bad debt is when the cost of debt is higher than the returns and the company doesn’t have enough liquidity to meet its debt obligations.
Leverage ratios
Leverage ratios are a warning sign, informing investors when a company’s debt obligations reach an alarming rate. We will look at the P&L and balance sheet segments related to debt and establish a numerator and denominator depending on what we want to analyse.
(i) Interest coverage ratios
The name of the ratio defines its purpose. It tells you if the company has enough profits to cover its interest payments. A company pays interest on debt from its EBIT (earnings before interest and tax).
Interest Coverage = EBIT / Interest payments
It tells you how many times over the company can pay its interest using its EBIT. If its interest payment is ₹200 and the company earned ₹1,000 in operating profit, its coverage is 5 times its interest payment.
You can use different variations of earnings and debt in this formula. Some companies use EBITDA (Earnings before interest, tax, depreciation and amortization). Some use interest and short-term principal repayment. The main objective of this ratio is to understand if the earnings can pay all debt obligations due in that year.
A perfect example of this is IndiGo Airlines. It has significant current liabilities and the non-current liabilities are significantly more than non-current assets.
Assets | 31-Mar-24 | 31-Mar-24 | Liabilities |
Total non-current assets | 463,714.00 | 494,297.67 | Total non-current liabilities |
Total current assets | 358,531.17 | 307,983.18 | Total current liabilities |
The airline uses interest payment, lease payments (aircraft lease) and the principal portion of the debt due in the year and EBITDA to calculate its coverage ratio. Since it includes more than interest, it uses the term debt service coverage ratio.
IndiGo’s ratio is 0.56, which means its EBITDA is only 0.56 times (half) the debt service cost. Its operations are not earning enough to meet its current debt obligations. This is the 2023 annual report. The pandemic significantly impacted airlines worldwide and pushed them into a debt spiral. Hence, the last three years were tough for IndiGo.
Once again, never look at a ratio in isolation, but at the trend over time to see signs of improvement or deceleration. Also, compare these ratios with peers to understand the industry standard. Debt is always a risk in the airline industry. Many airlines have even filed for bankruptcy because of huge capital and mounting debt.
(i) Debt to equity ratio
- Profitability ratios test the company’s profit-making skills from existing assets, debt, or Shareholders Equity
- EBITDA Margin = EBITDA/ Revenue
- Return on Capital Employed (ROCE) = EBIT / Capital Employed
- Return on Equity = Net Income / Shareholder’s equity
- ROA = Net Income / Total Asset
- Once you understand how to read and interpret the financial statement, ratios can help you understand the management’s efficiency in running the business.
- A company’s debt level, its ability to manage debt obligations, and impact on shareholder’s returns determine whether the debt is good or bad.
- Leverage ratio helps investors understand when debt obligations reach an alarming rate.
- Interest Coverage Ratio = EBIT / Interest Payments – It tells you if the company has enough profits to cover its interest payments.
- Debt-to-Equity ratio = Total Debt / Total Equity – it measures debt as a percentage of equity.
Summary
Profitability ratios test the company’s profit-making skills from existing assets, debt, or Shareholders Equity
EBITDA Margin = EBITDA/ Revenue
Return on Capital Employed (ROCE) = EBIT / Capital Employed
Return on Equity = Net Income / Shareholder’s equity
ROA = Net Income / Total Asset
Once you understand how to read and interpret the financial statement, ratios can help you understand the management’s efficiency in running the business.
A company’s debt level, its ability to manage debt obligations, and impact on shareholder’s returns determine whether the debt is good or bad.
Leverage ratio helps investors understand when debt obligations reach an alarming rate.
Interest Coverage Ratio = EBIT / Interest Payments – It tells you if the company has enough profits to cover its interest payments.
Debt-to-Equity ratio = Total Debt / Total Equity – it measures debt as a percentage of equity.
Chapter 9: In Search of Value
Until now, we have focused on a company’s efficiency and profitability, as well as the risk associated with debt. The next focus is on valuation ratios, which are crucial in making investment decisions. Here, you will understand how to identify the fundamental value of a share and compare it with the stock price.
Valuation ratios
The valuation ratio, even though a ratio just like the ones we explored in the previous chapters, deserves a separate chapter for one reason: it answers the all-important question every investor asks – “to buy or not to buy at the current stock price?”
To understand this better, we will revisit famed value investor Warren Buffett’s wise words: “Price is what you pay, and value is what you get.”
Let’s focus on value – What do you get?
As an equity shareholder, you have a right to the net profit after tax. The company divides the net profit in the following manner:
- Reserves and surplus is added to the shareholder’s equity
- Dividends and share buybacks are deducted from shareholder’s equity.
These adjustments are reflected in the “Other Equity,” as seen in the image below.

The total amount in the shareholder’s equity is divided among the number of issued shares. That is what you get (or lose) if a company discontinues its business. This amount is called the “book value” of the share, as it appears in the books of accounts.
Tip: You can find the number of issued shares in the “Equity” section of Consolidated Balance Sheet or the accompanying Notes. Eicher Motors mentioned this data in the Note 17 of Equity Share Capital.
You can find the number of issued shares in the “Equity” section of Consolidated Balance Sheet or the accompanying Notes. Eicher Motors mentioned this data in the Note 17 of Equity Share Capital.
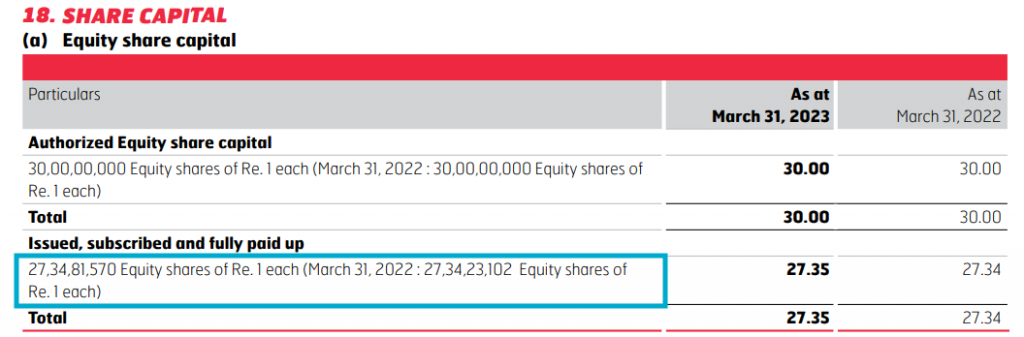
From here, we arrive at the first valuation ratio of Price to Book Value (P/BV).
Before we jump into the calculation part, let’s understand valuation ratios. They measure the stock price with the fundamental value of a single share. Note that any fundamental you take has to be divided by the number of issued shares.
(i) Price to book value (P/BV)
P/BV ratio = Stock price / book value per share
This ratio will tell you if the current stock price is above or below the book value per share.
In the case of Eicher Motors, we will take the stock price on May 11, 2023, when the company released its Q4 FY 23 earnings. The stock was trading at ₹3,626.35.
Book value = Shareholder Equity / Number of Issued shares
₹14,990,28,00,000 / 27,34,81,570 shares
= ₹548.12
[Note: (i) Shareholder equity is in crores. (ii) All figures have been taken from the images above]
Let’s plug in these values.
P/BV ratio = 3,626.35/ 548.12
= 6.6 times
The stock is trading at 6.6 times its book value. The 6.6x ratio might look expensive from the book value perspective, but you can only determine that once you compare it with the P/BV of peers and the industry ratio.
How do you interpret the Price-to-Book Value ratio?
Remember, the stock price reflects an investor’s expectation of future earnings potential of the company.
- A high P/BV ratio suggests that the market has overvalued the business. However, if the business is in a high-growth phase, a high ratio could also be attractive. Too high a ratio might be alarming.
- A low P/BV ratio suggests that the market has undervalued the business. But it may not always be the case if the company is making continuous losses or its sales are in a downtrend.
Hence, look at this ratio alongside the growth rate of sales and earnings trends to get a fair idea of whether the valuation is attractive.
Never base your decision on a single year’s ratio, as ratios could be skewed due to market volatility and short-term events. Always study the trend of ratios over the years to get a complete picture of the company.
You can replicate the above formula to derive:
- Price to Sales (P/S ratio)
- Price to Earnings (P/E ratio)
We have replicated the calculation to determine the PS and PE ratio.
We took Eicher Motors’s sales and net income after tax from its P&L statement and divided them by the total number of shares (27,34,81,570) to determine sales per share and earnings per share.
Particulars | Per Share | Valuation Ratio | Particulars |
Book Value Per Share | ₹ 548 | 6.62 | Price-to-Book Value |
Sales Per Share | ₹ 550 | 6.60 | Price-to-Sales Value |
Earnings Per Share | ₹ 107 | 34.03 | Price-to-Earnings Value |
When seen in isolation, these ratios may not tell you if the stock is undervalued or overvalued. You will have to compare it with industry peers to make an inference.
Eicher Motors P/E ratio of 34 might look high when seen in isolation. But when compared with the P/E ratio of two peers – Peer 1 (50.27) and Peer 2 (40.2) – Eicher Motors might look undervalued.
(ii) Price to earnings (P/E)
We will focus particularly on the PE ratio since earnings per share (EPS) are what shareholders get after the business pays everyone off.
In movies, you must have seen an affluent investor investing in the hero, who is still an underdog, because he sees “fire in his eyes.” The investor invests in the hero’s potential to do great things.
The same logic applies in the stock market minus the drama and cinematography.
A company’s share price reflects investors’ expectations about the company’s future earnings potential. If you look at a PE ratio of 30, you cannot make any interpretation. However, if you compare the PE ratio with the company’s earnings growth potential (earnings forecast), even a high PE ratio might be the right value for the stock. (We will learn how to forecast a company’s earnings in the later chapters.)
This is where we will introduce another popular ratio widely used in the stock market.
P/BV ratio = Stock price / book value per share
The PEG ratio compares the current PE ratio with the EPS growth forecast. Here, you forecast how much the company’s EPS will grow in the next 3 or 5 years.
PEG is an essential ratio if you are investing in a growing company whose EPS is also growing. To give you a crude analogy, when an eagle is on a hunt to catch its prey, it does not fly to the location where the prey is but to the location where the prey will be by the time it reaches the ground. Only when you look at the future will you be able to catch the growth.
Let’s take a hypothetical situation in which 3 companies operate in the same industry but have different PE and PEG ratios.
Company | P/E Ratio | EPS Growth (5 Years) | EPS 2024 | 2025 | 2026 | 2027 | 2028 | PEG Ratio |
Gati | 27 | 50% | ₹5.00 | ₹7.50 | ₹11.25 | ₹16.88 | ₹25.31 | 0.54 |
Madham | 13 | 25% | ₹8.00 | ₹10.00 | ₹12.50 | ₹15.63 | ₹19.53 | 0.52 |
Dheemi | 6 | 5% | ₹12.00 | ₹12.60 | ₹13.23 | ₹13.89 | ₹14.59 | 1.20 |
Gati has a high P/E ratio of 27 but is growing its EPS at an average annual rate of 50%. While P/E shows the stock is overvalued, the PEG of 0.54 shows it is undervalued as its high growth rate will compensate for the high P/E ratio.
How?
Standing at 2024, you see an EPS of ₹5. But like the eagle, you are not paying a 27 P/E ratio for the ₹5 EPS but for the ₹25 EPS you expect the company to report in 2028.
In this case, the stock Price is high, but the Value you could get in the next five years, as per your EPS forecast, could be higher.
At the same time, Dheemi has a low P/E ratio of 6, which might make it look like an attractive valuation. However it is growing its EPS at an average annual rate of 5%, which makes it overvalued from the PEG point of view.
So, while the PE ratio tells you value based on what has happened, the PEG ratio tells you value based on what could happen. Both ratios could be low or high or show opposite results.
These contrarian values of PE and PEG might put you in a dilemma about the better stock. As a fundamental investor, you must look at the company’s strengths and weaknesses to make this decision.
These valuations tell us that Gati is in the high-growth phase and carries high risk. To evaluate the risk and sustainability of the EPS growth, you will have to look at its operational and profitability ratios to make an informed decision.
Which ratio to use?
Which fundamentals (book value, EPS, sales) to choose to value a company depends on the type of business and your reason for being bullish on the industry. If it is a startup, you might be bullish on the sales as the company is in the early growth stages and may not have attractive earnings or book value. Similarly, a volume-based business (grocery) may not have strong profit margins, but its high sales might make the price-to-sales ratio a good measure.
At every stage of ratio analysis, the scenario changes depending on the growth phase and the industry your company is in. Hence, we first emphasize understanding the business model, then the growth phase, then reading and understanding the three financial statements, followed by financial ratios and valuation ratios.
For instance, in the case of Eicher Motors:
Business Model | Manufacturing Company |
Phase of Growth | Late Growth stage |
Essential line items in financial statements | Revenue and Net Profit (in the P&L Statement), Fixed Asset and Inventory (in the Balance Sheet). |
Important Financial Ratios | Fixed Asset Turnover, Inventory Turnover, Return on Equity, Return on Asset |
(Note: The company has very little debt, hence leverage ratios are not relevant) | |
Important Valuation Ratios | Price-to-Book Value, Price-to-Earnings |
Until now, we have only focused on the company’s past performance reflected in its P&L, Balance Sheet, and Cash Flows. It has already achieved these numbers. Next, we will understand how management’s corporate actions can impact the company’s future earnings.
Summary
- The valuation ratio helps you determine whether “to buy or not to buy at the current stock price?” It compares the company’s fundamentals with the stock price to determine whether it is undervalued or overvalued.
- The fundamental value of one share is determined by dividing the fundamentals (shareholder equity, sales, earnings) by the total number of issued shares. Just divide this number by the current stock price, and you get:
- Book value per share (Price-to-book value ratio)
- Sales per share (Price-to-sales ratio)
- Earnings per share (Price-to-earnings ratio)
- A general understanding is that a high valuation ratio (like the P/E ratio) means the stock is overvalued. However, these ratios should be considered alongside the company’s growth rate.
- A high-growth company may have a high P/E, P/S, and P/BV ratio. In such a scenario, even a high valuation will be attractive, but it will come with the risk of high-growth companies.
- Measuring the EPS growth and valuing the stock based on the future EPS is the PEG ratio.
- Which among the three ratios could best determine the value of a company depends on the company type, growth phase it is in, and which aspect of the business (EPS, sales, assets) you are bullish on.
Chapter 10: Straight from the Management
Description: Amid the numbers and quantitative models, one should pay attention to the qualitative aspects of a business. In this chapter, we will look at qualitative fundamental analysis, which involves understanding and analysing management’s actions. We will also understand the external factors beyond the company’s control that could impact a company’s fundamentals.
So far, we have been focusing on the theory and what the books have to say. While the numbers can tell you a lot about performance and trends, they have limitations. The numbers are good only when you have confidence in the ability and integrity of those who have compiled them.
A company is as good as its management…
It is said that ” a hero is not born but made.” Similarly, a successful company is not born but made by the people at the top, whom we call the “management.”
These people run the company and whose actions can have a material impact on its performance. Our next chapter is all about analysing management’s actions—the source of the numbers seen in the financial statements. You can call it a company’s ‘qualitative analysis’.
To understand and analyse the management of a company, we will look at three things:
- Management discussion & analysis
- Corporate actions
- Corporate governance
Management discussion & analysis
A company’s annual report has a segment called “Management Discussion & Analysis”.
This section’s idea is to give management a space to discuss their take on the earnings and highlight things they want to communicate to the shareholders.
Think of it as a meeting where the business owner tells the stakeholders (all companies and people invested in the business either as a shareholder, creditors, suppliers, customers, or partners) about the quarter or year it was. Companies must focus on three segments:
(i) Operational highlights
Management starts by discussing the one-off things that happened that were different from routine and how they reflected in the earnings. For instance, a new product launch or a power outage affecting factory production. Or maybe a component shortage delaying sales to next month or any government policies that have put the company in the limelight.
A real-life example is that in 2023, when the government increased the GST on gaming apps, it became a discussion point for all gaming companies. The high food prices due to rainfall shortages made it to the MD&A for FMCG and restaurant companies.
Such events may affect business operations positively or negatively, leading to earnings deviating from expectations. Management uses this space to inform investors about these risks and opportunities and how they plan to tackle or take advantage of the situation.
The management will also provide guidance, forecast, and outlook for the next quarter or year. If, for some reason, the management does not provide the guidance, they have to state the reason for the same. For instance, if a company is in the process of getting acquired, it will not provide guidance. If there is too much uncertainty in the business environment, they will state that as the reason.
As a fundamental investor, you can use this segment to prepare before reading the financial statements. You can factor management’s insights into setting expectations for the company’s future earnings.
Hence, a company’s stock price may fall or rise after an earnings call. It may also fall if management gives weak guidance for the upcoming quarter.
(ii) Accounting estimates
The next thing the management will discuss is any change in how it has prepared the accounts. Did it change the way it calculates inventory? Is there an extra day or week in the quarter? Is there any discontinuation of the business or addition of any new business in the earnings?
Changes in accounting policies can help you adjust your expectations of a company’s earnings as a fundamental investor.
(iii) Liquidity and Capital Expenditure
The most important part of the MD&A for investors is the liquidity and capital portion. The management will identify any trends, events, commitments, demands, or uncertainties that could materially impact the company’s liquidity or availability of capital. Remember, a company that runs dry on cash is on the verge of bankruptcy. Investors and creditors invest in the company so that it can make more money and fund its expansion while giving them returns.
You would be interested in knowing how much cash the company has and whether it can meet its current obligations and plans.
Apart from obligations, shareholders and creditors would also want to know a company’s capital spending plans. They would be interested in where the company is spending the money, from where it is sourcing the capital (equity, debt, or reserves), and what kind of returns this capital investment could generate.
Management would want to tell investors if a company’s credit rating has improved or if it has paid down a significant portion of its debt. For instance, Vedanta’s management highlighted the dividend amount it paid to shareholders in 2023, when it paid its highest dividend in the company’s history.
The objectives of MD&A are to explain the company’s financial statements to investors and help them develop realistic expectations of the company’s future earnings.
Corporate actions
Beyond the management’s discussion of the company’s operations, you might also want to understand the nature and behaviour of the management. The company is made by people who make decisions according to their behavioural traits. Some are aggressive, some risk-averse, some innovative, some conventional, some quality-driven, and some quantity-driven. These traits and the company’s cultural values are embedded in its management style, operational strategies, and decision-making processes.
Corporate actions, including stock splits, dividend distributions, mergers and acquisitions, rights issues, spinoffs, divestitures, restructuring, and liquidations, can help you understand the company’s DNA.
Corporate actions can have a significant impact on the company’s earnings and need the approval of the board of directors. Some actions like mergers and acquisitions (M&A) also need the approval of its shareholders as well as the regulator. Corporate actions could be voluntary like buybacks and dividends or mandatory such as divestiture of a business segment in a major acquisition to avoid too much market consolidation.
Divestiture
Divestiture is when a company disposes of its assets or a business unit through a sale, exchange, closure, or bankruptcy. The company could divest a business unit which is loss-making or it is streamlining its business operations to focus on something else. For instance, Bombardier sold its loss-making train business to train-maker Alstom to focus on business jets.
Discussing every corporate action could be cumbersome. So we will focus on a few major ones and see how they affect the company’s fundamentals.
(i) Stock split
Returning to the chapter where we discussed shareholder’s equity, every share has a face value of ₹10, and the company can split it until the face value becomes ₹1. So if you own 10 shares of Nestle worth ₹27,150 per share, and the company announces a 1:10 split, you will get 10 shares for every 1 share, and the price per share will fall to ₹2,715. This price will be adjusted to Nestle’s stock chart, and the entire historical price chart will show the adjusted price.
The stock split does not change the total value of your shares; it just increases the share count. For instance, you can divide a pizza into four or six pieces. That does not change the size of the pizza; however, it dilutes the size per slice.
Companies generally do stock splits to make their shares more tradeable and support retail investor participation. Think of it yourself: would you buy a share of Nestle at the ₹27,000 price point? Many investors might be unable to invest in even a single stock at that high price. But at ₹2,700, you can consider buying Nestle shares and also shares of other companies with the same ₹27,000.
Shares | Share Price Feb 2009 | Share Price Aug 2024 | Number of Shares Purchased with ₹1 lakh | Share count post-split | Value on August 2024 |
Eicher Motors | ₹22 | ₹4,800 | 4545 | 45,450 | ₹21.8 crores |
MRF | ₹1,632 | ₹137,000 | 61 | 61 | ₹83.57 lakhs |
Eicher Motors’ iconic 1:10 stock split in August 2020 made the stock more affordable at ₹2,000. In four years, the stock price surged past ₹4,800, running on solid fundamentals. Long-term fundamental investors, who had invested ₹1 lakh in the stock in February 2009 when the stock traded at ₹22 got 4,545 shares. The split increased their share count to 45,450, and they are worth ₹21.8 crores in August 2024.
Let’s take the example of MRF Tyres. One share is priced at more than ₹1.37 lakh because the company never did a stock split. So if you invested ₹1 lakh in MRF in February 2009 when it traded at ₹1,632 per share, you would have 61 shares worth ₹83.57 lakh in August 2024.
While the companies’ fundamentals drove the stock prices of both, the stock split made Eicher Motors shares more affordable to retail investors and helped them benefit from the company’s growth.
(ii) Mergers & Acquisitions
M&A is the best way to understand the company’s DNA—how management thinks and acts. Avenue Supermarts—the company behind D-mart—has a risk-averse business model. Using its retained earnings, it acquires land in less expensive areas and builds the supermart where it is assured to get a strong footfall. It grows its stores gradually, ensuring each store pays off the amount invested in it in certain years.
Reliance Retail, on the other hand, follows a more aggressive management style of investing a large amount of capital in one go. It acquired all Future Group stores and renamed them Reliance Smart. Reliance is known for acquisitions and market disruptions, using the financial backing of Reliance Group.
At the same time, Tata Group is known for acquiring iconic companies at depressed prices, turning them around through efficient management, and injecting more capital. The classic Jaguar Land Rover (JLR) acquisition, the Corus acquisition, and now the acquisition of Air India are a few examples. All these companies are loss-making but have the most valuable assets (factory, technology), tremendous market outreach, and well-established brand names.
Mergers and acquisitions significantly alter a company’s fundamentals, forcing you to rewrite your analysis in a fresh light. In such decisions, the qualitative aspect tends to generate more value than the quantitative aspect.
What Ford Motors couldn’t do in 18 years (1989 and 2007), Tata Motors did in six years. It turned around the loss-making JLR into a profitable venture by introducing new products, and targeted investments during the 2008 Financial crisis, expanding its market beyond the West and bringing it to the Asian countries. It made its own cars (Tata SUVs) more advanced with JLR’s technology.
Corporate governance
Knowing what the management has to say about the operations and plans for the business gives you a sense of how your money is being used. However, you want to be sure that what is reported in the annual reports and financial statements shows the actual picture of the company’s financial health. That is where corporate governance comes in.
You might have heard the term “corporate governance” often. Many companies highlight it as their ‘top priority.’ But what exactly is it?
Many family-run or founder-owned businesses, as they evolve, might continue to act as owners, giving priority to their personal interests and sidelining the interests of other investors. To ensure businesses balance the interests of the company’s shareholders, senior management executives, customers, suppliers, financiers, the government, and the community, the system of corporate governance was formed.
This system lays down rules, practices, and processes for controlling and managing corporations. The system ensures the companies:
- Maintain transparency and accountability,
- Comply with the existing laws and statutes,
- Protect the interests of shareholders,
- Maintain ethical and moral business practices,
- Make adequate and effective decisions that are in the best interest of stakeholders.
Companies that protect shareholders’ rights and interests enjoy strong investor confidence as you know your money is being used ethically and for legal business.
(i) Why is corporate governance important?
Companies with poor corporate governance can significantly risk investors’ money. Poor corporate governance means companies might hide facts or report inaccurate numbers in their financial statements or practice unethical behavior, polluting the environment or putting investors’ money at risk.
Most accounting frauds and scams have shown signs of corporate governance failure. Some extreme cases are the Satyam scam of 2009 and the Yes Bank failure in 2018. These events eroded shareholders’ wealth due to wrong or unethical decisions by management.
Satyam scam is a classic example of corporate governance failure, which led to changes in the law and how a company’s audit is done. Satyam Computer Services founder and chairman Ramalinga Raju and top executives manipulated accounts by making fake invoices and reporting revenue and profits that never existed between 2003-2008. Almost 94% (₹7,800 crores) of the company’s assets and 75% (₹5,040 crores) of its revenue were overstated. He transferred the profits to his family’s enterprises, such as Maytas, to invest in real estate and other projects.
The scam was discovered when the 2008 Global Financial Crisis hurt the IT sector, and creditors and lenders asked Satyam to settle its loan obligations. In such a situation, Raju offered to use Satyam’s financial reserves to buy Maytas for $1.6 billion, creating an uproar among shareholders and board members who saw this transaction as a conflict of interest. Although Satyam received many awards for corporate governance, it was a significant failure. The company lost investor confidence, and shareholders’ value vaporized.
It was a landmark case that highlighted the importance of corporate governance. There are many cases worldwide, like WorldCom and Enron in the US and Volkswagen in Europe. While these are extreme cases, many frauds can be avoided with proper governance structures and a vigilant board. Satyam’s case was a well-planned and well-crafted fraud; the auditor and the board failed to do statutory checks.
Such incidents have strengthened the corporate governance system, making it more and more difficult to commit fraud.
(ii) Red flags of corporate governance
As a fundamental investor, you can check for corporate governance through various red flags. While there may be awards and accolades, small checks can make you vigilant.
Firstly, companies with poor corporate governance cannot withstand an economic or industry crisis and collapse.
Secondly, the financial statements and management actions might need to be in sync. They won’t add up and you might feel something is missing, as in Satyam’s case. Here are some red flags you can identify:
- The company might report significant profits but need better cash flows for several years. Looking at the trend of accounts receivables can give you a hunch.
- Management might speak highly about the company and its plans without highlighting the risks before raising capital to artificially inflate the stock price.
- The chairman’s speech might be distorted from what the financial statement says.
- Senior executives resigning or leaving the company abruptly could signal caution and call for detailed scrutiny.
As you read and analyse more statements, you will gain a better understanding of the qualitative aspects and be able to differentiate mere marketing tactics from actual, hard facts.
While the financial statements, corporate actions, and governance are things the company’s management can control, things beyond its control can affect its fundamentals.
External factors influencing a company’s fundamentals
A company operates in an economy and interacts with several entities, such as customers, suppliers, regulators, government (policy makers), investors, courts (in case of lawsuits), banks, and more. Any significant change in its surroundings can also impact the company.
Think of a company like a ship sailing on water. Any turbulence in the sea or winds will affect the ship’s motion. At the same time, it will also be affected by the course of other ships sailing in the sea.
Macro factors: Inflation, GDP, interest rate, fuel prices, favorable government policies and incentives, taxation, government investment, pandemic.
Government subsidies drove demand for electric vehicles, and food inflation affected the profits of FMCG companies. The pandemic served as a boom for hospitals and IT companies while disrupting the airlines and hotel industry.
Geopolitical environment: Trade and financial relations between countries could significantly alter the business environment for companies doing business with that country.
The Russia-Ukraine war benefitted Indian oil companies, as they purchased Russian oil at low prices when the U.S. and Europe banned Russian oil imports.
Environmental factors: Weather, natural disasters, climate change, limited natural resources (coal, iron).
Regulatory changes: Banks, Pharma, and food companies are highly regulated.
An FDA approval can change the business dynamics of a pharma company. RBI can ban a bank from conducting business if it fails to comply with regulatory standards.
Consumer trends: The disposable income of consumers, consumption patterns, and trends.
When consumers have more money to spend, automotive and luxury goods companies flourish. The real estate and automotive sectors saw a significant jump in sales post-pandemic as disposable income increased.
Competitors: Technological advancement, better business strategies, more investment
A fundamental analyst takes a 360-degree view of the company and the environment it operates in to build an understanding of the business and build earnings expectations. Once you build your analysis, you must keep modifying it as per the developments in the situation. The future is always in motion, and so should your analysis.
Now that we have all the fundamental analysis jigsaw puzzle pieces, it is time to make the big picture join the pieces. You can approach equity research in various ways.
In football, every player has a different approach to achieving a goal, but the rules of the game and their training are similar. Till now, we have covered the rules of the game. In the next chapter, we will train you on how to play the game by the rules. You can apply what you have learned and build your approach to the game with practice.
Summary
- One significant aspect of fundamental analysis is knowing the people running the company and assessing the management, their strategies, and actions. For this, you have to look at three segments:
- Management Discussion & Analysis: Management narrates the business operations, any off-beat events, changes in accounting, liquidity position, and capital spending plans. They also give guidance on the upcoming quarter or year.
- Corporate Actions: Management makes several decisions, such as paying dividends, stock buybacks, stock splits, mergers, and acquisitions voluntarily or mandatorily. These decisions tell you a lot about management’s style and strategies.
- Corporate governance is a system that lays down rules, practices, and processes to manage and control corporations and make them work in the interest of all stakeholders. Failure to implement corporate governance leads to scams, misleading accounts, and unethical practices that are detrimental to shareholders.
- However, red flags such as senior executives leaving a mismatch in management’s statement and financial statements could hint that something is not right, and investors should remain cautious.
- External factors like macro, geo-political, environmental, regulatory, consumer trends, and competition could affect the company’s fundamentals.
Chapter 11: Fundamental Investing: Joining the Dots
As we near the end of our module, we have learned about business models, reading and making sense of financial statements, valuation, and qualitative analysis. But how do we put all these learnings into practice? This chapter will focus on a step-by-step process, from applying what is learned to generating a fundamental investment portfolio.
Before you invest in stocks, invest in yourself.
If you have reached this chapter, pat yourself on the back! You have cracked the most difficult part, which is investing your time in learning and sharpening the basics of fundamental investing. After all, a sharper axe can cut more trees than a blunt one.
Now it’s time to apply what we learned in building an investment portfolio. This process involves several steps and may take time at the start. But once you have your analysis ready, reviewing it will be much easier and faster.
The investing process begins with you
Before you analyze the stocks and business, you first have to analyse your own financial situation.
Take a pen and paper and list your expenses, income, savings, emergency funds, and financial obligations. What is left as free cash flow is the amount you can invest. Now ask yourself these questions:
- What do you want from your investment? – Wealth creation, passive income, or stable returns.
- How much can you invest, and for how long?
- What is your risk appetite? You may be a risk taker by personality and behavior, but if you have bills to pay and income is insufficient, take less risk.
- Determine your asset allocation across different assets, such as equity shares, bonds, fixed deposits, gold, ETFs, real estate, and more.
ETFs
Exchange-traded funds are like index mutual funds that trade on the stock exchange. ETFs mimic a stock index and strive to give you returns of the underlying index.
You can have multiple financial goals for different things and with different time horizons and risk profiles. You can build a portfolio for each goal and invest in specific stocks that meet your requirements.
- A growth portfolio mostly consists of stocks with significant growth potential, such as small and mid-sized companies, companies in their early growth stages, or companies in fast-growing markets.
- An income portfolio consists mainly of dividend stocks, bonds, and preference shares that pay regular dividends. It also involves stocks of large and stable companies in their mature growth stages.
- A value portfolio consists of stocks undervalued by the market and in which investors see huge potential. These stocks can be growth or dividend stocks of large, mid, and small-sized companies.
A balanced portfolio is a combination of all the above stocks.
Stock selection: top-down or bottom-up?
Once you are clear about your goal and the kind of portfolio you want, and are well aware of the risk, you can accordingly proceed to selecting stocks. Risk-averse investors are better off investing in large-cap stocks as they can sustain the downturn and grow in the long term.
Large-cap
Cap refers to market capitalization. Large-cap stocks are mostly well-established companies that are the market leaders in their sector and have a market cap of ₹20,000 crore and above. They have high trading volumes, and most mutual funds are invested in them.
Generating an investing idea depends significantly on your behavior, personality, and surroundings. Our decisions are often influenced by what we see, read, and experience. You might have heard of a stock in the news or your friend told you about a company. Some are marketing tactics a company uses to stay in the news. If any of these stocks excite you, you can study and observe their fundamentals. It is a random way of picking a stock.
A more structured way to approach stock identification (used even by institutions) is:
Top-down approach
You start with the macro trends, industry trends, and government policies to shortlist a sector. It is more broad-based and helps you invest in market cycles. It works well when you don’t have any stock in your watchlist. It is a more qualitative approach as you are targeting areas where you see opportunities.
For instance, the Russia-Ukraine war alerted countries to strengthen their security, and the government increased its defence budget, making investors bullish on defence stocks. Another instance is when the central bank began a series of interest rate hikes, making investors bullish on banks since they could earn higher interest income from their loan portfolio. Some cycles may be short, some long. For instance, secular growth trends like artificial intelligence and renewable energy could help you enter into long-term growth early.
Bottom-up approach
In this approach, you shortlist stocks based on fundamental ratios like price-to-equity, revenue, return on equity, profit after tax, market cap, price-to-book value, or even dividends. It is more stock-specific and quantitative. For instance, you are open to any sector, but the stock should have a market cap of ₹20,000 crore or a P/E ratio of below 12. This way, you eliminate risk.
You can use stock screeners for the bottom-up approach as they allow you to filter stocks using such parameters.
You cannot research every stock you shortlist. Studying 1 stock in detail could take 15-20 hours. Among your shortlisted stocks, you could take a stock trading below its 52-week high or a company in your area of competence. For instance, if you are a civil engineer, you could study an infrastructure or cement company. Starting fundamental research on a sector you are working in gives you an added degree of sector expertise that a finance or investment analyst may not have.
Evaluate the financial performance of the company
Once you have finalized the company you want to study, it is time to apply what you have learned from this module. Collect all the tools you need: Annual report of the last 3-5 years, market news, analyst reports, stock price, and Excel sheet.
- Start by studying the business model, and identify the growth phase the company currently is in
- Study the Porter’s 5 forces (customers, suppliers, competitors, substitutes and new entry). All this is available in the annual report and it will give you a fair idea of which segments of financial statements carry higher weightage.
- Read the financial statements and build a 5-year table of the key figures you believe you want to see the trends for. For instance, turnover plays a major role in FMCG stocks. So we will look at the turnover, cash flow from operations and any other information you need.
- See the growth rate and how the revenue or profit moved. Against every line item, you can create a column called Notes and mention any anomalies that drift the line item trend.
- Calculate the financial ratios you feel are relevant for the company. In Chapters 7 and 8 we discussed in length the important ratios and how to determine the relevant one.
Evaluate the management and leadership team
- Read the management discussion and analysis to know the company’s current state and management’s strategy to tackle risk and grab opportunities.
- Do a background check of the management (their experience, accomplishments, failures)
- Also, read the auditor’s report and do a corporate governance check. How? See if the MD&A acknowledges the risk and opportunity the financial statement presents.
Evaluate the economy, industry and competitive landscape
Look at the external macro, regulatory, and geo-political factors the company is sensitive to. If you used the top-down selection model, you already know the macro and industry factors. You just need to study the severity of the impact. The chairman’s statement will specify the same.
You could also examine the economic report, analysts’ statements, and management interviews to get a fair idea of the impact of an external event on the company’s fundamentals.
For instance, the RBI ban on Paytm Payments Bank sent tremors everywhere, and the stock fell drastically. At that time, a few institutional investors bought the stock at the dip because they believed the market had overreacted to the ban. They arrived at this conclusion from the analysis they had built.
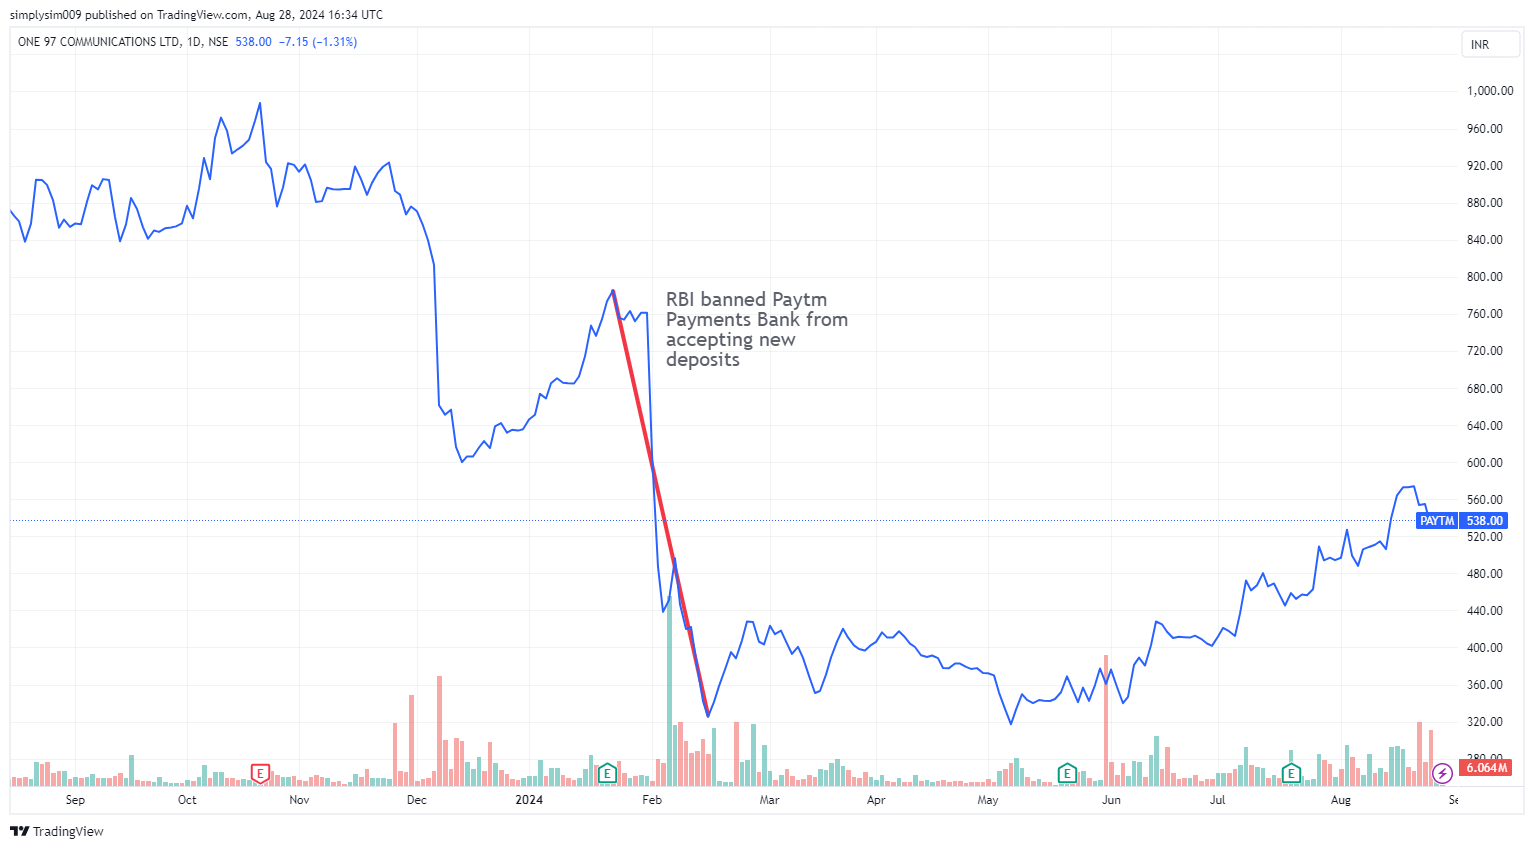
You should study the RBI law, the magnitude of its effect on Paytm’s revenue and business, identify the steps management can take to address the issue, and make changes to your analysis model accordingly.
f) Forecasting and valuation
At this stage, you have an Excel sheet with the key financial figures, their trends, future growth plans, and several factors affecting these figures. Now, it is time to use all this data to forecast future revenue, earnings, and free cash flow.
One of the easiest ways to forecast is to take the average of the past 3-year revenue or earnings growth and apply it in future years. As you make more models, you can learn advanced-level forecasting.
Year | Net Profit After Tax | YoY Growth | Notes |
2019 | ₹ 2,203 |
|
|
2020 | ₹ 1,827 | -17.0% | Pandemic |
2021 | ₹ 1,347 | -26.3% | Pandemic |
2022 | ₹ 1,677 | 24.5% |
|
2023 | ₹ 2,914 | 73.8% | Boost in Capital Spending |
2024* | ₹ 3,613.29 | 24% |
|
2025* | ₹ 4,480.47 | 24% |
|
2026* | ₹ 5,555.79 | 24% |
|
In the above table, we first noted Eicher Motors’ Profit After Tax (PAT) from FY19 to FY23. Now, we analyze the growth trend to make a fair assumption. The profit for FY20 and FY-21 fell due to the one-off pandemic. However, taking these numbers alone may not give a correct picture of its future growth. The FY23 PAT jumped significantly because of significant capital spending on production.
Since FY21 and 23 are outliers, the average of three years balances the growth rate to 24%. For some companies, you can also take the pre-pandemic growth rate if their earnings have normalized. Now, just multiply the 2023 PAT with the 24% average growth rate to get the future earnings forecast.
FY24* PAT = ₹2,914 crore x 1.24
= ₹3,613.29 crores
You can move to the valuations part now that you have future earnings and cash flows.
There are also some detailed methods, like the discounted cash flow (DCF) or dividend discounting model. This model bases its calculations on the difference between the amount you will earn from investing in a stock and the amount you will earn from putting that money in a fixed deposit.
If you invest ₹1 lakh in an FD for 5 years and ₹1 lakh in the stock, the stock should give you more returns as it comes with additional risk.
In DCF, we calculate the company’s future free cash flow and divide it by the FD interest rate to arrive at the stock’s present value. This model uses free cash flow, as that is the amount that belongs to shareholders after paying all other stakeholders. You could learn this model in advanced courses.
The valuation models will help you determine the fair price of a stock for the company’s future earnings potential. These future earnings forecasts are based on several assumptions. Events like corporate actions (M&A) or external factors beyond the management’s control (Policies, taxes, pandemic, natural disasters, changes in consumer behaviour) could significantly alter the forecast.
You could account for these events by adding a range to your forecast. If the company is large and resilient, you can see how much the stock price has moved on major events and put that as a range. For instance, a resilient stock whose fair market value as per your model is Rs 100, fell by an average of 10% in the past few crises.
Instead of forecasting the fair value as ₹100, you can consider a range of +/- 10%, which brings your forecasted value to ₹90 – ₹110.
If the stock is trading below this range, you could consider investing in it as you have built an expectation on future earnings and cash flow. The market might have probably undervalued the stock or overreacted to a short-term event, which could be balanced in the long term with higher recovery growth, as in the case of Eicher Motors.
Monitoring and Review
You can replicate the above process for multiple stocks. Each stock will give you a different outcome. You can build your own forecast model and a dashboard of each stock’s strengths, weaknesses, threats, and opportunities (SWOT).
Fundamental analysis and preparing a model sets the base. It is important to monitor and update your model from time to time to incorporate new market developments. Such reviews of your investments can help you identify red flags and exit an investment on time before the market crashes.
For instance, Warren Buffett sold his airline stocks worth $6 billion in less than a month when the pandemic broke in March 2020. He said the world has changed for the airlines. While some airlines recovered after three years, he was right to sell the stocks and cut losses because his reason for investing in airlines was improving operational efficiency and the profits they were making on every flight that took off.
There will be times when your decisions might not be right. But making mistakes is how you learn. The only thing you have to see in the learning process is that you are not losing money. Less profit is better than losses.
While this monitoring was of stocks you have already invested in, there is another angle to the review.
Doing a fundamental analysis of some stocks might be good. However, they might be overvalued at that time. You can add them to the watchlist and review their developments. Whenever they reach a favourable point, you can invest in them.
Some stocks look fundamentally weak when you review them. But you have your SWOT analysis with you. No business remains the same. The management keeps working towards making a business successful and profitable. You can put such stocks on another watchlist and keep reviewing them for fundamental developments. If you see any positive change, these stocks become a good investment as they can generate value.
Let’s take the case of Zomato. The company’s shares plunged after its July 2021 IPO as the loss-making company overvalued its shares during the IPO. The management changed its strategy and focussed on optimizing its operations and generating profits while growing revenue. The various efforts it took, such as reducing marketing expenses, closing underperforming branches in Tier 2 cities, charging platform fees, and more, helped the company report its first profit of ₹2 crores in Q1 2023 and increased it by 126.5 times to ₹253 crores in Q1 2024. During this time, its share price also surged.
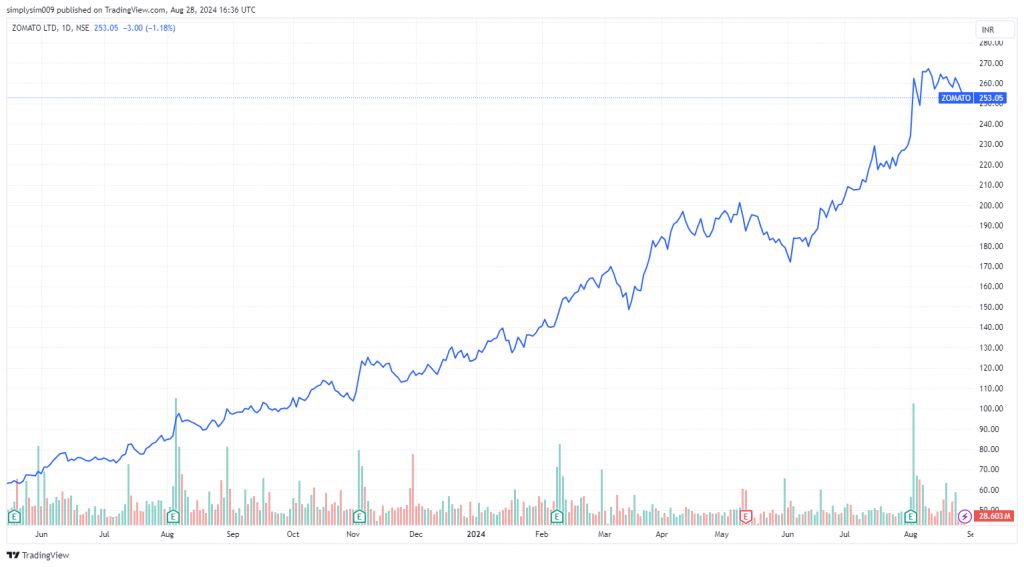
This shows that nothing is constant. The stock that was weak in the past may become strong in the future and vice versa. Hence, it is crucial to keep monitoring the market.
To put this in layman’s terms, Albert Einstein, the renowned scientist and genius, once failed a math test. Amitabh Bachchan, whose deep voice is one of the most recognised in the country, was rejected by All India Radio for his voice. These small setbacks did not define their future—indeed, they were overturned, and how!
Similarly, it would be incorrect to let one flaw cloud your analysis of a stock or company. Passing such a premature, one-time judgment over a single instance or data point could make you lose the opportunity for their recovery and future potential.
Moral of the story?
It is vital to keep monitoring the market at regular intervals to not miss out on opportunities and changed fortunes of a company. You can keep studying new companies and adding and deleting them from your portfolio.
This is just one method of fundamental analysis. You can use your knowledge of stocks and apply it to various investing styles to make the most of one stock.
Summary
- Fundamental investing can be structured in a step-by-step process to make it efficient.
- The first step is to analyze your financial goals, risk appetite, and investment horizon.
- Next, you select stocks based on your requirements and risk profile using a top-down or bottom-up approach. You could further shortlist the stocks by starting with the companies in your area of competence.
- You begin with understanding the business model and reading and analyzing the annual reports and financial statements.
- Evaluate management and leadership by reading management discussions and analyses and doing background checks on management.
- Study the external economic, industrial, and competitive landscape.
- Forecast earnings and derive the valuation of the stocks.
- Monitor the stocks you have studied and keep them on the watchlist.
Chapter 12: Market is the Best Teacher
Fundamental analysis can help us understand whether a company is investment-grade by studying its publicly available information (annual report). These companies operate in an investing landscape with several market players, each with a different strategy. In this chapter, we will learn how to observe stock market investment behaviour and learn the golden rules of investing from famous investment moguls.
In this module, we saw how a company works and reports its financial data, the factors surrounding the company, and how they affect its performance. After all, fundamental analysis is about owning a business, not a stock. It can help you identify the intrinsic value of a stock based on its future growth potential or a company’s assets. It can also tell you whether or not the stock is an investment-grade stock.
How many stocks should you have in a portfolio?
You can generate stock ideas and research each stock. But how many stocks should you own to have a successful portfolio? Frankly, there is no magic number. Some famous investors who made their wealth from stocks had not more than 5-10 or at least 20 stocks in their portfolio!
For a strong portfolio, you should diversify your investments across different asset classes, sectors, and stock types.
Asset Class
An asset class is a type of investment instrument that has the same laws and regulations and often behaves similarly in a marketplace. For instance, equities are one asset class, and real estate, fixed-income bonds, and commodities are other types of asset classes.
It is not the quantity but the quality of stocks that counts.
Taking note of investor sentiments and biases
Finding stocks is just one part of the investing game. The next part is understanding the market sentiments and protecting your portfolio from several investing biases.
Herd mentality – Most beginners and retail investors fall for ‘herd mentality’. Some stocks might be popular and this popularity might be driving their stock price, making them overvalued. Since everyone is talking and investing in that one stock, we tend to follow the herd and buy the stock without reading their fundamentals. This could put you in danger of buying poor-quality stocks at inflated valuations.
Loving tendency and over-optimism – Sometimes, you may buy stocks of a company you love and ignore the red flags or weaknesses of the company. There is also over-optimism around the stock, even though the fundamentals say otherwise. There is a thin line between being confident and being overconfident. Remember, this overconfidence sank the unsinkable Titanic on its first voyage. Hence, fundamental analysis requires you to look at a company as it is.
While these are some common investing biases, you can learn from them on the go by understanding the kind of biases you are most inclined to make and taking proper steps to avoid them.
Lessons from Investing moguls
You can take lessons from several investing stories of success and failure and learn from their investing experience. You will see contrasting lessons from different investors; sometimes, the same investor might give contrasting lessons. There is no right and wrong in investing. It depends on which investing strategy you use in which scenario and on which type of stocks.
Some common lessons that apply in every scenario are:
Lesson 1: Don’t predict, prepare.
Many investors, including Warren Buffett, reiterate the same lesson: The future is uncertain, and so is the market. No one can predict it. However, fundamental analysis can help you prepare for various scenarios.
For instance, the pandemic and the Russia-Ukraine war were unpredictable events. Even the strongest of the fundamentals faltered when they hit the world unexpectedly. Airlines, hotels, and tourism were out of business for two years while tech stocks flourished. Times like these teach you to prepare a portfolio of asset classes and sectors that react differently.
This is where Warren Buffett’s investing lesson of “Understanding the business” comes in. When you know the business, you can analyze the best and worst-case scenario and state the reasons for buying a stock. If the reasons for buying are no longer valid, do not hesitate to sell the stock. This is where you need to overcome optimism bias.
Hence, Buffett, who popularised the “Buy and Hold Strategy,” said, “If you aren’t willing to own a stock for 10 years, don’t even think about owning it for 10 minutes,” they also said, “The most important thing to do if you find yourself in a hole is to stop digging.”
Lesson 2: Historical performance does not guarantee future returns
Rakesh Jhunjhunwala and Ray Dalio taught us that historical data may not dictate future performance. There are times when a company’s stock price continues increasing while its underlying fundamentals do not. So, while historical fundamentals can give you a base to forecast future earnings, historical stock prices do not. Unlike fundamentals that are influenced by the company’s performance, its stock price might be influenced by factors like market optimism, investors’ emotions, easy availability of capital, etc.
Lesson 3: Spend time in the market
Here again Stanley Druckenmiller, former chairman of Duquesne Capital, Rakesh Jhunjhunwala and Warren Buffett hold the view that just picking a good stock is not enough. You have to stay invested in it and give the company time to grow and give returns.
6 types of stocks
All these lessons are best used in former manager of the Magellan Fund at Fidelity Investments Peter Lynch’s investment philosophy, which categorizes stocks into six types based on their unique characteristics and uses different investment strategies for each category.
- Slow growers: These companies have little scope for expansion but may give generous dividends and reduce downside during a market downturn—for instance, utility stocks. You can use such stocks to minimize the overall portfolio risk and secure a stable source of income.
- Stalwarts: Large companies are growing consistently, even during downturns. They may not show excessive growth, but consistent gradual growth because of the nature of their business offerings. For instance, FMCG and pharma. They protect you from a bear market and give you strong returns in a bull market.
- Fast growers: These are small or new-age companies growing rapidly. They could generate significant wealth but come with downside risks.
You can buy and hold the above 3 stocks for the long term. Now, let’s talk about some riskier ones.
- Cyclicals: Some stocks see periodic upside and downside, especially automobile, banking, and metals stocks. These stocks are significantly affected by interest rates and raw material prices. A buy-and-hold strategy may not work here. To invest in them, you first need to identify the cyclical upturn and then buy in the downturn to get double-digit solid returns.
- Turnaround: This distressed company is going through a significant revamp. While the past performance might show weak results, the future performance could generate positive returns. Such stocks might trade at a lower valuation based on their past earnings and investors’ failure to realize their future earnings potential. Such stocks could give you significant growth. The best example of a turnaround is Eicher Motors (the one we discussed in Chapter 1).
- Asset play: These are asset-rich companies with significant assets like land or cash. However, the stock price does not reflect the asset value because of a downturn. Their stock price could grow in a strong or recovering economy when the asset value rises.
These are just a few lessons seasoned investment moguls learned from the market. You can learn from their experience and build your own experience by practicing and perfecting an investment strategy that suits your requirements. It will take time and you might make a few wrong decisions or losses in the process, but eventually, with more practice, you will get a hang of it.
Summary
- Fundamental analysis helps you identify investment-grade stocks. However, navigating the investing landscape requires you to understand the market.
- There are some investing biases most investors fall prey to:
- Herd mentality – Follow the crowd and invest in stocks everybody invests in.
- Overoptimism is being optimistic about the stock because you love the company and ignoring the red flags highlighted by the fundamental analysis.
- The market has been the best teacher of seasoned investors, teaching some common lessons that apply to all scenarios.
- The future is unpredictable. Don’t predict; prepare for the worst-case scenario.
- Historical performance does not guarantee future performance, as the past may be influenced by some factors and the future by others.
- Spend time in the market and adopt a long-term approach with fundamentally strong stocks.
- Invest with the mindset of never losing money. Don’t shy away from accepting mistakes and cutting losses. You can invest the money in a more successful investment and earn back the lost amount.
- Depending on their characteristics, stocks can be categorized as slow growers, stalwarts, fast growers, cyclical, turnaround, or asset plays. You can use their nature to create a mix that can strengthen your investment portfolio.
Options Trading Guide
Begin your journey towards becoming an exceptional options trader. Learn options trading the right way!
Chapter 1: Introduction to Options Trading
History of Options
History has proved time and again that derivatives were an innovative solution for risk mitigation. Options trading is no exception.
In fact, the first-ever option trade dates back to the 6th century BC, when a philosopher named Thales made a fortune with an option-type contractual agreement.
Thales, who is idolized in ancient history as “the first Greek mathematician”, is said to have developed what we know as Options today. He anticipated that there would be a good harvest of olives in Greece the following year.
Thus, Thales reserved the olive presses in advance, at a discount, so that he could rent them out at a high price when demand peaked.
By paying a small amount upfront, he reserved the right to use these olive presses from their owners, who agreed since they were getting an advance payment.
If things didn’t go the Thales way, he would lose the advance payment as there would be a shortage of olives and no demand for the presses.
On the face of it, it seemed like a good deal, didn’t it? Indeed, it was a great deal as Thales was right with his prediction – there was abundant production of olives the next year.
As a result, Thales was able to amass huge wealth by charging higher rent to people looking to use these presses.
This episode came to be known as the first historically known creation and use of Options. Options trading since then has tremendously evolved across the globe. In India alone, options make up 97% of the contracts traded in the futures & options market.
In this guide, we shall focus on what are Options and How can traders use Options to trade in the F&O markets.
Chapter 2: What are Options Contracts?
Options are standardised derivative contracts traded on recognized stock exchanges like NSE and BSE which derive their value from an underlying asset.
There are 2 parties to the contract:
Buyer
Has the right but not an obligation to buy or sell an underlying asset which can be a stock, commodity, currency, or even an index, at a predetermined price (aka Strike Price) on a predetermined date (aka Expiry). To buy this right, option buyers have to pay a premium.
Seller
The counterparty that gives this right to the buyer and receives a premium for the option sold.
Yes, you heard it right, the buyer of the option has the right and not an obligation to buy or sell the underlying asset. The seller also known as the option writer has the obligation to sell/deliver the underlying asset as per the contractual agreement.
Furthermore, there are two types of options contracts:
- Call Option: The right to buy an underlying asset at a predetermined price on a predetermined date.
- Put Options: The right to sell an underlying asset at a predetermined price on a predetermined date.
We shall discuss this in-depth and understand how these option contract types work in the next Chapter.
Options were created to manage the one thing we all are scared of, which is risk. But today options are used not only to manage risk but also to speculate or to hedge traders and investors against volatility.
Let’s decode the concept of Options by the very definition.
Options
Options are “Standardised Derivative Contracts” traded on “Recognised Stock Exchanges “ – since options derive their values from their underlying asset or stocks on which the options are based. Since these are traded on exchanges , these contracts have standardised terms and conditions defined by the exchanges on which they are traded.
Option Buyer
The buyer of the Option has the “right to buy or sell” and not an obligation to do so, this means the buyer of the option can choose to buy or sell the underlying asset from or to the seller of the option only if they wish to. Buyers therefore can use option buying as a hedge against price movements or volatility in the price movements of the underlying asset.
Option Seller
The seller in an options contract is the trader who has given the right given to the buyer for buying options. An Option Seller also known as Option Writer has to abide and by default oblige to deliver based on the terms and conditions mentioned in the contract.
Premium
Option Premium is what a seller receives from the buyer of the options.
Strike Price
The Strike Price is the price at which the buyers and sellers agree to buy and sell the underlying asset. Strike Prices are usually fixed in multiples or round figures and are set by the exchanges, to standardise the contract agreements.
The strike price is also known as the “Exercise Price” since the buyers choose to exercise their right to buy or sell at the chosen strike price.
Expiry
Expiration Date or Expiry of the options contract is the end period of the contract after which the contract gets terminated or null and void. Compulsory settlement as per the terms and conditions needs to be fulfilled post the expiration of the contract.
Now that you know what option contracts are, let’s jump to the meaning of option trading.
What is Options Trading?
Options trading is the activity of buying or selling “Options” in the futures and options segment of an exchange.
If traders have a bullish bias towards any underlying asset and therefore are buying a CALL Option which is the Right to Buy.
Similarly, if theres is a bearish view towards an underlying asset and therefore are buying a PUT Option that is the Right to Sell the underlying asset based on that bias, they are trading in options.
Options Trading is a high-risk high-reward domain as it involves leverage. Remember we discussed the significance of leverage in F&O markets? Options contracts are no exceptions and most traders flock to options trading because leverage helps increase ROI and compounds the money faster.
Where are Options Traded?
Option Contracts are Exchange Traded. You can find them on recognized stock exchanges. In India, there are 2 major stock exchanges that see significant volumes of options contracts traded daily:
- The Bombay Stock Exchange (BSE)
- The National Stock Exchange (NSE)
Out of these 2 exchanges, NSE has the highest volumes in terms of Total Turnover in the F&O markets. A boom in Options trading in India was witnessed in early 2000 when the NSE launched Index Derivatives on the popular benchmark Nifty 50 Index.
Since then, a wide variety of product offerings in Indexes and Equity derivatives has increased the popularity and volumes of options trading. The exchange currently provides trading in F&O contracts on 4 major indices and close to 200 stocks.
Chapter 3: Types of Options Contracts
There are primarily 2 types of Options that are traded:
- Call Options
- Put options
1. Call Options
A call option gives the holder the right, but not the obligation, to buy an underlying asset at a specified price (“strike price”) within a specified time period. The seller (“writer”) of the call option is obligated to sell the underlying asset at the strike price if the holder decides to exercise their right.
A call option is bought by bullish traders, meaning a trader will buy a call option assuming that the prices of the underlying asset will increase on or before expiry. Call option buyers may buy to hedge and mitigate price risk or want to speculate but take a limited risk if things go south.
Wondering why buying a call option has limited risk? It’s because the maximum loss to a buyer of any options contract can be the premium that is paid to buy that option contract.
2. Put Options
A put option gives the holder the right, but not the obligation, to sell an underlying asset at a specified price (the strike price) within a specified time period. The seller (“writer”) of the put option is obligated to buy the underlying asset at the strike price if the holder decides to exercise their right.
A put option is usually bought by Bearish traders, meaning a trader buys a put option assuming the prices of the underlying asset are about to decrease on or before expiry.
The buyer of a put option can be anyone such as an investor, who is either buying the put option to hedge and mitigate price risk that may occur due to the fall in prices of the underlying asset.
OR
A trader who wants to speculate and participate in the bearish trend but wants to take limited risk in case if the view of the trader goes wrong.
Both call and put options can be bought or sold and can be used for a variety of investment and trading strategies. There are also several other variations of options contracts, including:
American options: These options can be exercised at any time before the expiration date.
European options: These options can only be exercised on the expiration date.
LEAPS options: These are long-term options that have expiration dates that are more than one year in the future.
Weekly/ Monthly options: These are options that expire every week instead of every month.
It is important for traders to understand the specific features and risks associated with each type of options contract before engaging in options trading.
Underlying Asset in Options Trading
As a trader, wouldn’t you want to know what are the alternatives of the underlying asset available in the F&O markets, that one can trade with these options?
Options contracts are traded in the following underlying assets –
- Stock Options
- Index Options
- Currency Options
- Interest Rate Options
1. Stock Options
Stock options are options contracts which have individual stock as the underlying . Stock Options are widely used by various market participants such as investors , traders, hedge funds etc to either manage their risk of all the open un hedged position or sometimes for speculative purposes too. Stock Options are traded in Lot sizes on the futures on options segment of an exchange.
Stock Options | Lot Sizes ( no of shares ) |
Asian Paints | 200 |
Axis Bank | 625 |
Bajaj Finance | 125 |
Bharti Airtel | 950 |
HDFC Bank | 550 |
Icici Bank | 700 |
ITC | 1600 |
Mahindra and Mahindra | 700 |
Reliance | 250 |
Infosys | 400 |
Wipro | 1500 |
Stock Options have monthly expiry of their contracts and these contracts expire every last trading Thursday of the month.. If last Thursday is a trading holiday only then contracts expire on the previous trading day.
2. Index Options
Index futures are options contracts where the underlying asset is an index, like the Nifty50, Bank Nifty, or Finnifty in India. Comparable to stock options, they grant the buyer/holder the right, but not the obligation, to purchase or sell the underlying index at a predetermined price on or before a specified date.
The Index options market offers various contract expirations. For example, Nifty 50 options have four weekly contracts, three consecutive monthly contracts, three quarterly contracts for March, June, September, and December, and eight semi-annual contracts for June and December.
This ensures that options contracts with a minimum of four-year tenure are available at any given time. Let’s take the start of the Financial year as the base. Contracts that are available are as follows –
Contract Period | Contracts Available | Expiry Date |
Weekly | April – Week 1 , Week 2 , Week 3 , Week 4 | Every Thursday Weekly |
Monthly | April , May , June | Last Thursday of the Month. |
Quarterly Contracts | June , September, December, March | Last Thursday of the Month. |
Semi-Annual | June , December | Last Thursday of the Month. |
After each weekly contract expires, a new serial weekly options contract is introduced. When the near-month contract expires, new contracts (monthly, quarterly, or semi-annual) are introduced with fresh strike prices for both call and put options. This occurs on the trading day following the expiration of the near-month contract.
The monthly contracts for Nifty 50 options expire on the last Thursday of the expiration month, while weekly contracts expire every Thursday. In the event of a trading holiday on Thursday, the contracts expire on the previous trading day, similar to stock options.
Similar to Nifty 50 options, Bank Nifty options have the following –
Contract Period | Contracts Available | Expiry Date |
Weekly | April – Week 1 , Week 2 , Week 3 , Week 4 | Every Wednesday Weekly |
Monthly | Current Month April , Near Month May , Far Month June. | Last Thursday of the Month. |
Quarterly Contracts | June , September , December, March | Last Thursday of the Month. |
Finnifty, a relatively new Index gaining popularity these days, has a different expiry date and has the following contract cycle.
Contract Period | Contracts Available | Expiry Date |
Weekly | April – Week 1 , Week 2 , Week 3 , Week 4 | Every Tuesday Weekly |
Monthly | Near Month April , Mid Month May , Far Month June. | Last Tuesday of the Month. |
However, it’s a relatively new index and the long-term contracts have lesser volumes currently.
Lot sizes in Index Options in India –
Instruments | Lot Sizes |
Nifty 50 | 50 shares |
Bank Nifty | 15 shares |
Finnifty | 40 shares |
MidCap Nifty Mid Select | 75 shares |
3. Currency Options
Currency options are one of the most widely used instruments for businesses, individuals, and financial institutions to protect themselves against exchange rate fluctuations.
Currency options give the buyer/holder to buy or sell a specific amount of one currency for another at a predetermined exchange rate (the “strike price”) on or before a specified date.
There is no obligation for the buyer of the options contract to meet the contract commitments in case the buyer doesn’t wish to, as the buyer has the right to exercise the option of buying or selling on or before expiry. After all the buyer pays a premium to get this right.
Currency options can be used by investors, traders, importers, and exporters to manage currency risk, speculate on exchange rate movements, or create complex financial products.
4. Interest Rate Options
Interest rate options are options whose underlying asset is an interest rate, such as the 91-day Treasury Bill (T-Bill) rate or the 10-year government bond yield in India.
Interest rate options provide the buyer/holder with the right, but not the obligation, to purchase or sell the underlying bonds at a predetermined interest rate on or before a specified date.
These options can be used to manage interest rate risk, speculate on interest rate movements, or create complex financial products.
Interest rate options can be based on different types of government bonds, short-term interest rates, or other financial instruments that are sensitive to changes in interest rates.
With this we come to an end to this Chapter. In the next Chapter we shall discover how option premiums are priced ?
See you in the next one!
Chapter 4: Pricing of Options
An exchange has contracts with multiple strike prices and expires of the same underlying asset. Pricing of Options can be therefore quite challenging. But who decides the premium price when it comes to options contracts:
- Exchanges?
- Regulatory bodies?
The answer lies in understanding the components of option premiums and the factors that affect option pricing.
The regulatory bodies govern exchanges and ensure there’s smooth and fair trade. An exchange is just a platform where buyers and sellers come together to trade.
In fact, price discovery happens when a buyer and a seller execute trades on the exchanges. That forms the basis of asset pricing.
But with options premiums, the pricing mechanism has more layers to it. Since options are a derivative product, the value of options increases or decreases with the change in the underlying asset’s price. That’s not all.
An options value increases or decreases depending on different variables. Each of these variables may have a varied impact while the impact itsel will differ as per the type of contract.
Before getting into which factors affect the option premiums, let’s learn how option premiums are priced.
Concepts of Option Premiums
There are few mathematical models that can be used to derive the value of option premiums. Based on these models, option premium pricing can be determined on approximation, although markets are dynamic and prices may vary in practice when compared with theoretical models.
To simplify things, let’s explore the following concepts:
- Intrinsic Value and Time Value
- Moneyness of Option Premiums
- Intrinsic Value and Time Value
Option premiums comprise of 2 components:
- Intrinsic Value
- Time Value
That’s why…
Formula of Options Premium
Option Premium = Intrinsic Value + Time Value (Extrinsic Value)
The Intrinsic Value reflects the amount by which the option is “In The Money”, meaning if the right is exercised today, the option would be profitable.
The Time Value reflects the time remaining until the option expires and the expected volatility of the underlying asset.
Intrinsic value for Call and Put options are calculated as follows:
Formula of Intrinsic Value (Call Options)
Intrinsic value = Strike Price – Spot Price
Formula of Intrinsic Value (Put Options)
Intrinsic value = Spot Price – Strike Price
Please note that Intrinsic Value cannot be negative.
This is because options contracts give the buyer a choice to exercise or not exercise the contract. A trader will exercise the option only when it is profitable to the buyer.
If the buyer is incurring a loss, he would allow the options to expire worthless and lose the premium paid for buying the option. But, he wouldn’t lose any more money than the premium paid at the time of buying the contract.
Let’s take a practical example to understand the concept of Intrinsic Value by adding one more concept of the Moneyness of Option Premiums.
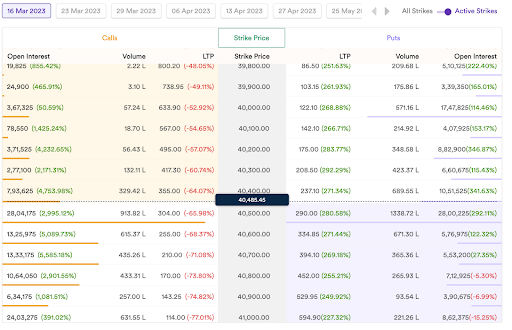
The above image is an Option Chain, a visual representation of strike prices and their LTP (Last Traded Prices).
The left side of the option chain has call option premiums, and the right-hand side put option premiums. All the strike prices are in ascending to descending order and the Spot Price is highlighted at the centre.
The spot price of Bank Nifty is 40,500 (rounded off in the image above). Now to the concept of the Moneyness of option premiums.
Moneyness of Option Premiums
Moneyness is the representation of the interplay between an option’s Strike Price and Current Market Price of the underyling.
An option’s moneyness determines whether an option contract is At The Money (ATM), Out of The Money (OTM), or In The Money (ITM).
You will hear this jargon a lot while trading options so here’s what they mean.
- An option is said to be “At The Money” (ATM) when the price of an underlying asset is equal to the strike price of the option contract.
- An option is “Out of The Money” (OTM) when the options strike price far away from the price of the underlying asset.
- An option is said to be “In The Money” (ITM) if the option buyer can make profits by exercising the option today.
A few things to note here are as follows:
- ITM has higher values since it has some Intrinsic Value.
- ATM and OTM options have zero Intrinsic Value since we know that Intrinsic Value cannot be negative.
- As time passes by, options lose the Time Value component.
Let’s refer to the option chain again and take examples to simplify the concept of Intrinsic & Time value and the relation of option premiums relative to their moneyness.
Example:
40500 Call and Put Options are At the Money currently since the Spot Price = Strike Price.
But ITM and OTM will differ for call and Put options.
For Call Options:
All the Strikes that are above 40500 (less Than 40500) in the option chain are In the Money and those below 40500 ( greater than 40500) are Out of the Money Options.
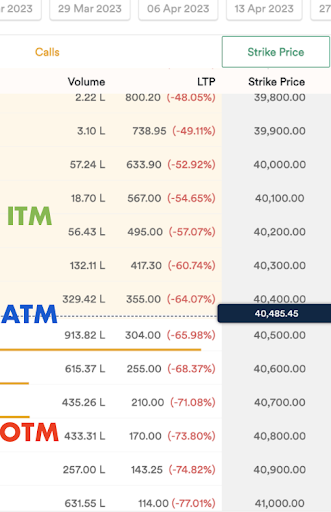
(shaded area on the image represents ITM)
For Put Options:
All the Strikes that are below 40500 (less Than 40500) in the option chain are are Out of the Money Options. And and those above 40500 ( greater than 40500) In the Money Put Options.

(shaded area on the image represents ITM)
Did you notice, ITM call options have more value than ATM or OTM Calls?
The reason is, ITM Call Options have Intrinsic Value + Time Value
For example, the Spot is currently 40500 so an ITM Call option of 40000 Calls is trading at Rs. 633 (refer to the image).
As we discussed, the option premium has 2 components Intrinsic Value + Time Value
Option premium = Intrinsic Value + Time Value ( Extrinsic Value )
Calculation of Option Premium
40000 Call Option = IV of 500
IV = Spot 40500 – Strike 40000 + Time Value of 133
Time Value = Option Premium 633 – IV 500 = 133
While an ATM option may have some Time Value depending on the spot price, OTM options only have the Time Value component in the option premium price.
Every options trader should know that as time passes, the Time Value component (Extrinsic Value) decreases from the option premium and the depreciation in premiums is much faster when the option contracts are nearing their expiry.
This decreasing Time Value has a name: Theta Decay (Time Decay). It acts as an unseen edge for option sellers.
But you may ask, why is this concept so important?
It’s because the moneyness of an option contract affects the pricing of options premiums and the probability that it will expire in the money.
Options that are ITM tend to have higher values since they have a higher probability of expiring in favour of the buyer, while options that are OTM tend to have lower values as they have a lower probability of expiring in the money.
For option sellers, OTM option selling can thus be a profitable strategy. There is a caveat though. It can be profitable only for those who understand the concept of time decay relative to the moneyness of options.
The reason option sellers are able to make consistent profits is that OTM options have a lesser probability of expiring in favour of the buyer.
Moreover, it’s likely that the option buyer will not exercise the right to buy the underlying asset if the trade isn’t profitable, just as we saw in our example, in Mr Bull’s case.
Thus, the premiums which buyers pay to sellers, lose their entire value and go down to zero, at expiry, when buyers choose not to exercise the options.
Time to expiry is fixed since it’s mentioned in the options contract and with each day that passes by, option premiums lose some Time Value component, the decay is much faster in OTM strikes and this acts as an unseen edge that is available to option writers that help them to increase their probability to make consistent profits.
The Moneyness of options also helps option sellers in risk management. Sellers get ample time to react if they sell OTM options and they can do certain adjustments to manage their risk.
So traders, based on the above facts, we can establish that, if an option seller who has good risk management skills, can consider option selling as a good business opportunity, to generate some really good ROIs on the capital deployed.
Option Premium Pricing Models
Theoretically, there are mathematical models that can be used to determine the approximate optimum pricing of option premiums.
The reason we should consider these models in the approximation is that these models don’t account for abnormal moves or unforeseen fluctuations in the markets that can cause higher volatility.
However, these models can be used for traders, especially traders who speculate in the options market , for better decision-making.
In this Chapter, we shall learn about 2 popular and widely used trading modules to arrive at the right value of option premiums.
- The Binomial Pricing Model
- The Black and Scholes Model
The Binomial Pricing Model
Developed in 1978 by William Sharpe, the Binomial option pricing model has proven to be one of the most flexible and popular approaches to valuing option premiums.
The Binomial Pricing Model represents the potential prices of an option’s underlying asset using a tree-like structure. It assumes that time is divided into discrete and equally spaced intervals.
At each interval, the asset’s price can either move up or down by fixed rates. These movements are determined by simulated probabilities based on factors like volatility and time.
Here’s the catch. The Binomial Pricing Model is known to be quite cumbersome as various probabilities are simulated. At the same time, the model is pretty accurate and thus works best for long-dated maturity options.
It’s been widely used since it is able to handle a variety of conditions for which other models cannot easily be applied.
Since the Binomial Pricing Model is based on the interpretation of an underlying instrument over a period of time rather than a single point, it is used to value American-style options that are exercisable at any time as well as Bermudan options that are exercisable at specific instances of time.
Definition of Bermudan Options
Bermudan options can be exercised at specific dates before expiration, whereas American options can be exercised at any time before expiration, and European options can only be exercised at expiration.
Black and Scholes Model
The Black and Scholes Model was published in the year 1973 by Fisher Black and Myran Scholes. Its one of the most widely used mathematical models and ever since the model was published, it led to a boom in options trading.
The model has been credited with providing mathematical logic to the activities of options markets across the globe.
This model is used to calculate the theoretical price of options with assumptions such as (but not limited to):
- Ignoring the dividend paid during the life of the option contract
- No arbitrage opportunities available
- Market movements are random – it’s difficult to predict the market direction at all times
While also using key fundamental factors of option premiums that are the price of the stock, strike price, volatility, time to expiry, and short term risk-free interest rates.
The Black–Scholes model assumes that the market consists of at least one risky asset, usually known as stock, and one riskless asset, usually called the money market, cash, or bond.
The standard Black and Scholes Model is only used to price European options, as it does not take into account that American options could be exercised before the expiration date.
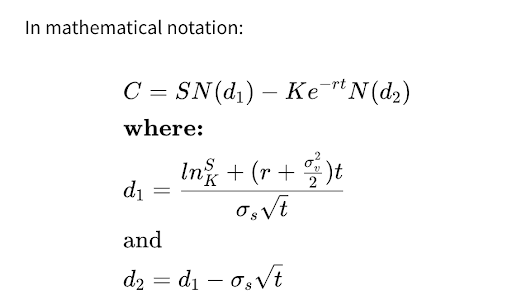
where,
C= Call option price
S= Current stock (or other underlying) price
K= Strike price
r= Risk-free interest rate
t= Time to maturity
N= A normal distribution
Although options traders have access to a variety of online options calculators, and many of today’s trading platforms have robust options analysis tools, including indicators that perform the calculations and display the options pricing values almost instantly, the Black and Scholes Model has been the most widely accepted model across the world.
In Fact, options markets in the Indian exchanges follow the Black and Scholes model to determine the pricing of options contracts.
So these were some of the option premium pricing models that are used to determine option premium pricing. The idea behind these mathematical models is to derive a fair value for option premiums and now let’s discuss the factors that affect the movements of option premium prices.
Factors Affecting the Pricing of Option Premiums
Pricing of the option premiums depends on a lot of factors such as what is the spot price of the underlying asset currently traded, strike prices of options, time to expiry, volatility in the underlying asset and the current interest rates in the economy.
These are fundamental parameters for option premium pricing. To further understand how options are priced and the impact of variable factors on option premiums, let’s decode these variables and how these factors determine and affect option premium prices. Don’t worry, we shall keep things super simple.
1. Current Market Price Or Spot Price
With every increase or decrease in the value of the underlying asset, the option prices keep on changing.
If the price increases, call option prices go up whereas put option prices decrease.
If the price of the underlying asset decreases, the value of put options increases while the value of the call option decreases.
2. Time to Expiry of the Contract
Options contracts expire post the last day of the contract period. Option premiums also include some additional pricing if the time to expire is in the future.
The longer the maturity of option premiums greater the uncertainty and therefore higher the premiums.
As we saw that options premiums have intrinsic and Time Value in their pricing, the Time Value component is maximum at the starting date of the contract and as time passes by the Time Value component decreases and goes down the zero at the expiry.
3. Volatility of Underlying Asset
Volatility refers to the magnitude of movement in the underlying asset price up or down from the current market price and it affects the option premiums of both call and put options in the same way.
The higher the volatility, the higher would be the option premium prices since there is a high risk for the buyer of the option of options going out of the money and option sellers fear option prices going against them.
4. Interest Rates
Interest rate has an inverse impact on option premium prices. Interest rates affect different options differently.
Most times, an increase in interest rates will cause an increase in the call premiums and cause put premiums to decrease.
Unlike other option Greeks (which we shall discuss in the coming Chapters), which are dynamic and affect the option prices on a relatively regular basis, the impact of interest rates on option premiums is barely noticeable but indeed important.
Chapter 5: What is Options Expiry?
In the previous Chapter, we saw how option premiums are priced and various mathematical tools to discover the prices of option premiums.
In this Chapter, we shall learn what happens on the expiration date of the option contract.
By design, every option contract has an expiry date mentioned in the specifications.
An option’s expiry date is the day after which the contract becomes null and void, and the buyer and seller have to abide by the contract’s obligations.
Similarities Between Options Contracts and Insurance
Thing is, options trading is quite similar to a general insurance business. Let’s say you own a car and often use it for long distance travel on a daily basis.
Since your car is on the road for longer distances, there’s always a probability of mishaps or accidents that can lead to major damage to your car and ultimately cause financial risk.
Thus, buying insurance for your car would make sense so that you can avoid any financial risk that may arise if there is an unforeseen incident and resultant damage. The insurance company will reimburse whatever financial loss occurs to you as a result of the damage.
Of course, there are no free lunches! You pay the insurance company a premium upfront and in return, they cover your financial risk as a trade-off.
Since the contract is for a fixed period of time, you renew before the expiration date. Sounds like a fair deal for the car owner, isn’t it?
In the context of options trading, the buyer enters an option contract at a particular strike price with a view that the price of the underlying stock or index will be favorable to them.
The seller of the option contract is like the insurance company, willing to provide a risk cover to the option buyer in case of a financial loss. In return, the seller gets an upfront premium payment.
Options contract have a defined contract period which is mentioned in the contract specifications provided by the exchange.
Post the contract period ends, there’s a compulsory settlement and both the parties to contract, i.e. the buyer and seller of the option contracts, have to oblige to the terms and conditions of the contract.
What Happens On Expiry in the Indian Options Market?
Index options and stock options contracts are European Options, meaning all options are automatically netted on expiry. Hence the Final Exercise is automatic on the expiry of both stock and index option contracts.
Long positions held at In The Money (ITM) strike prices are assigned randomly to short positions in corresponding option contracts within the same series.
Following this, the Final Exercise settlement takes place for options held at ITM strike prices. This settlement occurs at the close of the trading hours on the expiration day of the option contract.
All Out of the Money (OTM) contracts become zero and the sellers get to keep the premiums received from the buyers.
No wonder Option sellers consider option trading as a serious business as 80% of the option strike prices at expiry go down to zero.
Any open positions in option contracts, will cease to exist post their expiration day as the contracts are Null and Void after the settlement.
Exercise settlement is cash settled. The final settlement loss/ profit amount for option contracts on Index is debited/ credited to the relevant bank account on T+1 day (T= Trading Day) (Trading day = Expiry Day).
For the purpose of STT, each option trade is valued at premium. On this value, the STT rate as prescribed is applied to determine the STT liability.
In the case of the final exercise of an option contract, STT is levied on the settlement price on the day of exercise if the option contract is ITM.
With this we come to an end to this Chapter. In the next Chapter we will be discussing the most commonly asked question by traders who intend to start their options trading journey which is – “How much money is required to start with options trading?“
See you in the next Chapter!
Chapter 6: How Much Money is Required for Options Trading?
Margin is the amount which is kept as a deposit that acts as collateral for the exchange in case an options trader makes losses due to increased volatility.
A trader who wants to trade in futures and options needs to deposit margin money with the broker, as prescribed by the exchange ( subject to change from time to time-based on market volatility). The broker deposits this collected margin money with the exchange on the trader’s behalf.
Prices of underlying shares in the F&O markets keep on moving every day. And since there’s leverage involved, margins ensure that buyers bring money and sellers bring shares to complete their obligations even though the prices have moved down or up.
In India, SEBI urges exchanges to ensure that the margin requirements are met at all times. Any irregularities in maintaining margins by the exchanges or shortfall in margins at the trader’s end, can lead to hefty penalties for both.
Mr Vikalp Starts Options Trading
After going through the previous Chapters, Mr Vikalp , a super cash market trader gets a fair idea on options trading basics and he sort of gets how options premiums work.
Now Mr Vikalp is ready to try his hands on options trading and he contacts his broker Dhan as they have a dedicated app for Options Trading. He also wants to know how much capital is required to trade in Options.
To get started, Mr Vikalp needs to first open a Futures and Options Trading account with the broker and has to keep some capital as margin. Mr Vikalp has two options (literally) and the margin requirements for each will vary.
If Mr Vikalp wants to buy an option premium at any strike price, then the margin required will be calculated as follows.
Margin for Option Buying
Lot Size * Premium Price
If Mr Vikalp wants to sell options contracts then the margin required would be as follows.
Margin for Option Selling
SPAN margin (Initial Margin) + Exposure margin + Additional margin required by the exchange – Premium Amount received
Let’s take an example. Mr Vikalp wants to trade in stock options. He’s looking at Reliance Industries and wants to take exposure in the stock by buying and selling options.
Show below is the option chain of RIL, displaying a holistic view of the currently traded most active call and put options strike prices at the CMP of Rs. 2339.
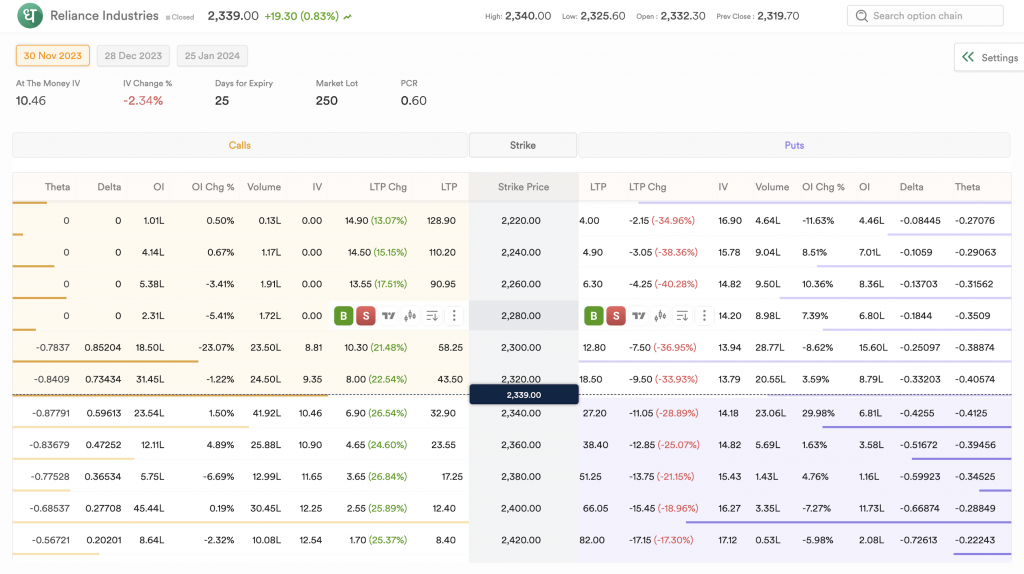
Mr Vikalp has 3 choices. Let’s have a look –
Case 1: Mr Vikalp is bullish on Reliance and wants to buy a Call Option. He is looking to buy an ATM Call Option with a strike price of 2340.
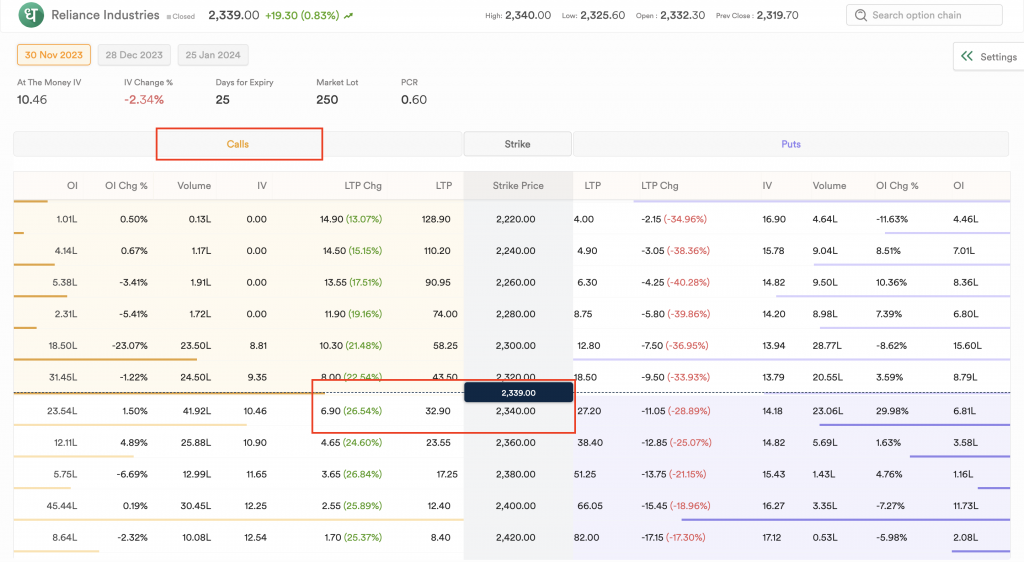
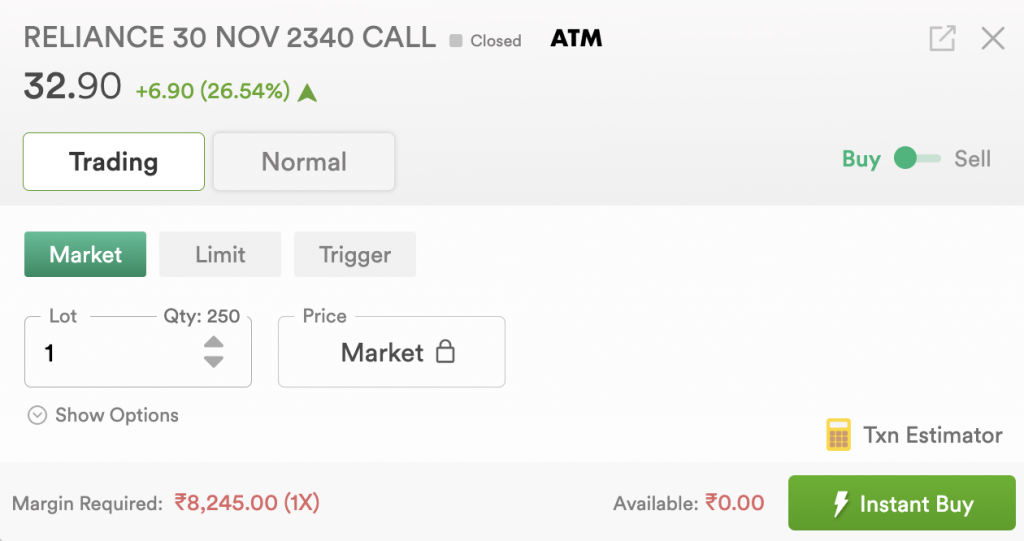
As you can see the , to buy 1 lot of RELIANCE 31 AUG 2540 CALL lot size is 250 shares, Mr Vikalp has to pay Rs 8245/- (1 lot = 250 shares * 32.90/- premium price).
Here is the breakup of the entire transaction with the TXN Estimator on Dhan.
The net amount payable is inclusive of all the charges such as brokerages, exchange charges, stamp duty and taxes.
The calculation is for 1 lot, and if he wants to buy more, then he will need to add more funds and multiply the lot size of 250 shares * the premium price which is 44.10.
Please note: Information in the Transaction Estimator is approximate, not actual.
Case 2: Although Mr Vikalp is bullish on Reliance , he has a view that the underlying price of Reliance may not go above 2600. And so he wants to speculate and decides to sell the RELIANCE 31 AUG 2600 CALL which is currently trading at 22.80.
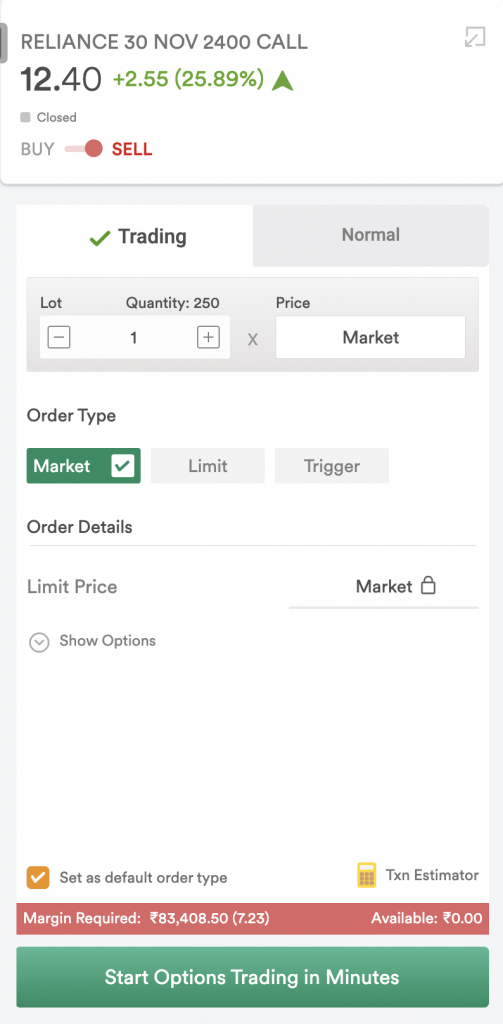
Now, Mr Vikalp’s capital requirement increases as option selling indeed has a higher risk. He needs Rs. 98272.56 as an upfront margin to execute the option-selling trade. Although the trade value is only Rs. 5700, Mr Vikalp will need to pay additional margins required by the exchange to fulfil his sell order.
Here’s the breakup of the transaction on the transaction estimator.
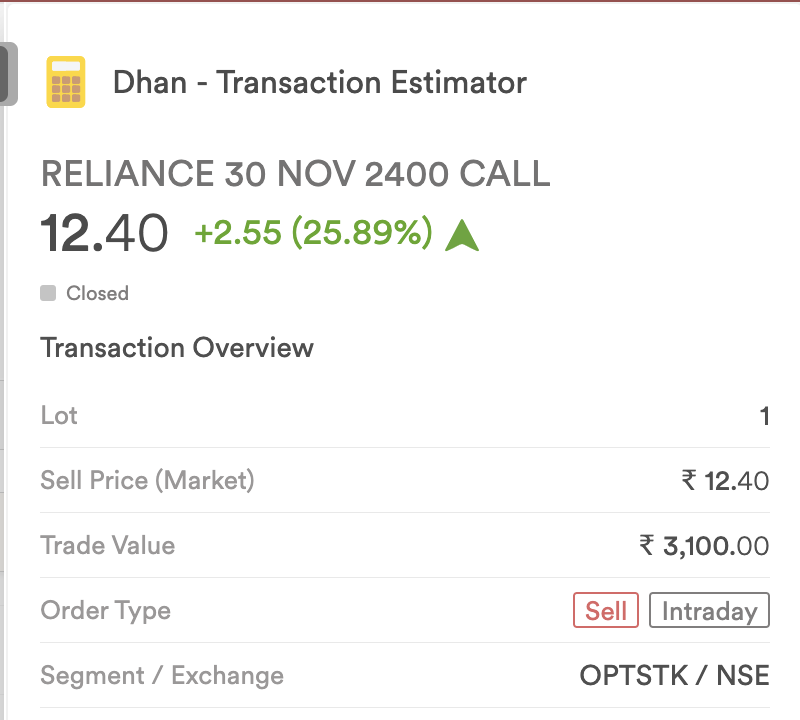
Let’s take one more example here on the index options. Mr X has a neutral view on the Bank Nifty which is a leading index comprising stocks from the banking sector. Based on this he plans to sell both call and put options and benefit out theta decay.
Case 3: Non-Directional Option Selling.
The CMP of Bank Nifty Spot is 44199.10
Mr Vikalp decides to sell a straddle, which is a non-directional strategy used when the market is expected to be range-bound or less volatile. We’ll discuss options strategies later. For now, let’s understand margin requirements with this example.
As you can see, the overall margin requirement for this strategy is roughly 1 lac rupees. While selling just one leg either call or put would require a margin of 87415 (as shown in the image below).
The reason margin is lesser is that exchanges have designed the margin requirements in such a way that they give away hedge benefits if both the options are sold, or if you hedge you trade by creating a spread, that is taking a counter position instead of selling a single option for protecting losses.
Coming to the basic question of how much money is required for options trading?
The answer is that it depends on how much quantity you’re comfortable with. But the minimum money requirements for options trading will always depend on the margins prescribed by exchanges.
By the way, margins are subject to changes by the exchange based on the volatility in the markets.
At Dhan, we have an in-built feature which automatically tells you the current margin requirements, so there’s no need for you to check the margin every time you take a trade!
Just search for the stock or the index options you want to take buy or sell positions, and as shown in the above examples, the margin requirements will be shown to you at the bottom.
All Types of Options Margins Explained
In order to start trading in Options , exchanges in India need you to deposit margins. These margins are a combination of cumulative margins such as
1. Initial Margin a.k.a. VaR Margin or SPAN Margin
SPAN generates different scenarios by assuming different values to the price and volatility and for each of these scenarios, possible loss that the portfolio would suffer is calculated.
Based on this, the initial margin required to be paid by the investor that would be equal to the highest loss the portfolio would suffer in any of the scenarios considered.
The margin is monitored and collected at the time of placing the buy / sell order. The SPAN margins are revised 6 times in a day:
Once at the beginning of the day
4 times during market hours
Once at the end of the day
Goes without saying, higher the volatility, higher the margins.
2. Exposure Margin
Exposure margin is collected along with Initial/SPAN margin. Exposure margins in respect of index futures and index option sell positions is 3% of the notional value of the contract.
For futures on individual securities and sell positions in options on individual securities, the exposure margin is higher of 5% or 1.5 standard deviation of the log returns of the security (in the underlying cash market) over the last 6 months period. It is applied on the notional value of position.
Premium Margins: It is charged to buyers of option contracts in addition to the Initial margin. We saw this in our examples above.
The premium margin is paid by the buyers of the options contracts and is equal to the value of the options premium multiplied by the quantity of options purchased.
Assignment Margins: It is collected on assignment from the sellers of the contracts.
With this we come to an end to this Chapter. In the coming Chapters we shall discuss how to choose the right financial instruments for trading and then touch on some more interesting option trading aspects.
Chapter 7: How to Trade Options?
If you’re one this Chapter, it means you’re closer to the goal of starting your options trading journey.
How to trade in Options?, is by far one of the most complex questions in the world of stock markets. Trading in Options is somewhat similar to trading in the Futures market (we had discussed in depth about this in our Futures Trading Guide).
But with options trading, you as a trader can get super creative and find new ways and strategies to use Option Contracts to minimise risk and maximise returns.
It all starts with a View! As an F&O trader, you should be able to develop a view or a bias pertaining to your vision for the markets or the stock that you wish to trade in.
Having a View or a Bias can help you build a strategy. And on this basis, a trader can use options as a tool to design a strategy and execute trades according to the strategy designed.
Steps to Start Trading Options
There are so many approaches that can be used to start trading in options. However, what separates an average trader from a profitable trader is, “having a strategic and disciplined approach to trading.”
That’s only possible if there’s a methodical process designed based on factors such as a trader’s risk profile, personal trading style, trading psychology, etc.
Every trader can experiment at first and with practical experience, come up with a trading plan that’s best for them.
Below mentioned process can be used as reference, which could help a trader to build their own trading process. It’s actually a simple 3-step process.
There’s no guaranteed success in trading but traders can experiment with the below mentioned process and create a process that may work for them. Lets have a look at it.
- Step 1 - Building/Developing a view
- Step 2 - Constructing a Trading Plan
- Step 3 - Finding and Deployment of a strategy that suits your risk profile
- Step 1: Building/Developing a View
Step 1: Building/Developing a View
Most successful traders , plan their trades in advance just because they study the markets or the stock , dig deeper and develop a bias. Developing a bias is the first step towards any form of trading , as it forms the base to select which strategy is the best fit for the trader to begin trading.
Biases can be of 3 types:
1. A bullish bias could mean a trader is expecting the price of any asset or commodity to up.
2. A bearish bias could mean a trader is expecting the prices of any asset or commodity to go down.
3. A non-directional bias could mean a trader is expecting the prices of any asset or commodity to stay within a range and is expecting very less volatility or fluctuations in the of the underlying prices.
Option sellers usually get the benefit of being non-directional as close to 90% of the strike prices become worthless at expiry.
Once a bias is developed, the next part is to create a trading plan.
Step 2: Constructing a Trading Plan
A trading plan is a set of rules that a trader makes. This plan acts as a detailed guide that an options trader adheres to. A good trading plan should outline your trading goals, risk tolerance, and time commitment.
Defining your entry and exit criteria, profit targets, and maximum loss limits are also part of a trading plan. Having a well-defined plan will help you stay disciplined and focused.
The plan must also include what financial instruments to choose and which strategy to deploy based on the view and the current market conditions.
Not only this , but the trading plan should have key insights such as how much capital to deploy, when to enter and when to exit from the strategy and any other information that can help the trader to take an informed decision right from before entering into a trade and until the time to exit.
Key elements that a trader needs to keep in mind before designing a trading plan are:
- Taking action based on the current market scenario
- Following a structured method of entry and exit before entering the trade
- Having a proper risk management system based on your risk profile
Traders sometimes have to make instant decisions, in fact most of the time take decisions spontaneously as and when any opportunity is spotted.
Thus, it’s good to have a trading plan designed well in advance so that there’s no room for error for a trader in times when prompt action is required.
Step 3: Finding and Deployment of a Strategy
Finding the right strategy could be challenging since there are thousands of strategies that can be deployed.
Options trading can be both rewarding and complex, so it’s important to approach it with a solid plan.
Here are some steps and ideas that can help you find the right strategy for you.
1. Education and Research
Before diving into options trading, ensure you have a strong foundation in understanding how options work, including concepts like strike prices, expiration dates, implied volatility, and different option strategies.
2. Risk Tolerance and Strategy Selection
Understand your risk tolerance and trading goals. Different options strategies have varying levels of risk and potential rewards.
Some strategies, like covered calls, are more conservative and income-focused, while others, like naked puts for example, can be more aggressive.
Knowing your risk tolerance can help you manage your risk. A trader should always choose the right strategy based on their risk tolerance.
3. Market Analysis
Conducting a thorough market analysis to identify potential trends, volatility patterns, and underlying asset movements is something that a trader should immensely focus on.
This analysis can influence your strategy selection. Technical and fundamental analysis can be particularly useful in this regard.
4. Choosing the Right Strategy
Explore different options strategies based on your market outlook and risk profile.
Some common strategies include, Covered Call that is selling calls against a stock you own or Protective Puts, which is buying puts to protect a stock position.
Then there are strategies like Straddles and Strangles. They involve Buying both a call and a put (Straddle) or selling both a call and a put (Strangle) with the same expiration but different strike prices. Such strategies are used by traders who have non directional views.
In the coming Chapters we shall be explaining some of these strategies in detail.
However, it’s important to know that every strategy has a different risk to reward ratio and therefore a trader has to understand his/her own risk profile in order to choose the best strategy that suits their trading style.
5. Implied Volatility Analysis
Paying close attention to implied volatility levels can be useful, as they can significantly impact option prices.
Strategies like selling options benefit from high implied volatility, while buying options benefits from low implied volatility.
6. Backtesting
Before deploying a strategy in a live market, consider backtesting it using historical data to see how it would have performed in different market conditions. This can give you a better understanding of the strategy’s potential risks and rewards.
7. Diversification
This is one of the most important aspects in trading. Avoid putting all your capital into a single strategy or trade. Diversification across different strategies, underlying assets, and timeframes can help manage risk.
Essentially, diversification helps you increase your longevity in the markets as a trader because you’ll be disciplined. And, as they say, never put all your eggs in one basket.
Not all strategies work at the same time. Some may work in stable market conditions while some may work when theres high volatility.
Thus, running multiple strategies can give traders an edge as they can have a higher probability of managing their positions in all market conditions and a better chance of being profitable.
8. Trade Management and Exit Strategies
Defining a clear entry and exit criteria for each trade can also be super helpful.
Instead of having a random approach to managing your trades, having a plan for managing losing trades (stop-loss) and taking profits (target price) can help you be disciplined.
Sticking to your plan can be a great way to avoid emotional decision-making.
With this we come to an end of this Chapter. In the next Chapters we shall explore how to choose the right instruments for options trading!
Chapter 8: How to Choose the Right Instruments for Options?
After learning some basic approaches to options trading it’s time for one of the most crucial aspects of options trading and that is – Choosing the right financial instruments.
Once you develop a view, based on your trading plan, a trader needs to choose the right instruments to go ahead and deploy the strategy.
In the world of options, there are endless possibilities for a trader to enter into a trade as there are thousands of strategies that use different instruments to create the same desired output.
For example , if a risk-averse trader has a bullish view and therefore decides to take a bullish position has 2 choices.
Take a bullish position by buying a call option or also sell a put option. Buying an option has limited risk and unlimited profit potential but selling a put option has the exact opposite risk-reward ratio.
For a trader who is risk averse, taking a bullish position by selling a put option would not make sense as the risk of selling options may not suit his ability to manage his risk.
Besides, there’s a high chance if there is high volatility in the markets, higher fluctuations may bring fear onto a traders mindset and the trader would exit the position in spite of having the desired results.
Thus, choosing the right instrument in options trading is the most important.
Things to keep in mind while choosing instruments in Options Trading:
1. Underlying Asset
Understand the underlying asset that the option is based on. It could be a stock, index, commodity, or currency.
Make sure you’re familiar with the market dynamics of that asset and any potential events that could impact its price.
2. Liquidity
Choose options with sufficient liquidity. High liquidity means there are more buyers and sellers in the market, making it easier to enter and exit positions without significantly affecting the option’s price.
If a trader is trading bigger position sizing, then the trader has to ensure that there’s enough liquidity in the strike price chose to trade with. Low liquidity could result in higher impact costs.
3. Strike Price Selection
Depending on your strategy, select strike prices that align with your outlook on the underlying asset’s movement. Different strike prices can offer varying risk-reward profiles.
For example, the strike prices closer to the spot prices of the underlying asset (ITM and ATM), will have higher volatility as compared to the strike prices which are far way or Out of The Money (OTM).
A trader should ensure that the strike price chosen is aligned with the risk that the trader is willing to bear with.
4. Expiration Date of the Contracts
Consider your trading timeframe and strategy when choosing the expiration date of the option.
Short-term traders might prefer near-term expirations, while long-term investors might opt for options with more time until expiration.
This is because as the options come closer to their expiration date, they tend to become more volatile and also theta decay is the maximum as the contracts come closer to expiry.
5. Impact of Implied Volatility on Option Premiums
Implied volatility reflects the market’s expectations of future price movements.
Higher implied volatility generally leads to higher option premiums and vice versa.
Depending on your strategy, you might prefer higher or lower implied volatility.
6. Strategy Alignment with Risk & Reward
Ensure that the options you choose align with your trading strategy. Different strategies, like covered calls, protective puts, straddles, and spreads, have varying risk-reward profiles and require different market conditions to be effective.
Thus, a trader has to ensure that the right strategy is deployed at the best possible time , for better chances of success.
7. Risk Tolerance
Evaluate your risk tolerance before entering any options trade. Options can magnify gains, but they can also lead to significant losses. Only trade with money you can afford to lose.
Risk can be quite subjective. That’s why it’s important for every trader to evaluate their own risk tolerance and choose the strategy and the right instruments that suits them the best.
8. Market Outlook
Have a clear view of the market’s direction. Are you bullish, bearish, or neutral? Your outlook will influence the type of options you choose and the strategies you implement.
9. Risk Management and Hedging
Although there’s no such thing as a perfect hedge, option traders can experiment and choose the best possible combinations of options to get the desired outcome.
11. Practice and Paper Trading
If you’re new to options, consider starting with paper trading or using virtual trading platforms to practise your strategies without risking real money.
Remember that options trading carries a level of complexity and risk, so it’s important to thoroughly understand the concepts and strategies before diving in.
Chapter 9: What is Going Long & Short in Options?
Similar to futures trading, options traders use various jargon to express their views in the market. They use terms like going long or going short whenever they have a bullish or bearish view respectively. Let’s decode these terms in this Chapter.
Going Long and Short in Options
In general, trading involves two main positions: “ Going Long ” and “ Going Short”.
Positions | Position type |
Going long | Long position |
Going Short | Short position |
These terms might sound confusing while trading in options at first, but they’re essentially bets on the price movement of a particular stock, index, or any other underlying assett.
In futures trading, going long and going short is fairly easy to understand but in options there are multiple ways to go long and go short.
To summarise, here’s a table that will show you how long and short positions can be created in options.
Trades | Bias | Long (By Buying Options) | Short (By Selling Options) |
Long Position | Bullish | Buy a Call Option | Sell a Put Option |
Short Position | Bearish | Buy a Put Option | Sell a Call Option |
- You can take a long position by either buying a call option or shorting/selling a put option.
- You can take a short position by either buying a put option or shorting/selling a call option.
Going Long vs Going Short
Going Short on the other hand, means having a bearish bias and your expectation is that the price of the underlying asset might fall. A trader can create a Short Position by either going long meaning buying a Put Option or by shorting a Call Option meaning Selling/writing a Call Option.
As you can see, the long positions and short positions on an options contract can express either a bullish or bearish sentiment depending whether the trader goes long in a call or put option or the trader also has an choice to go short and express the same bullish and bearish sentiments.
Lets take some examples to simplify this concept further. Just the next 5 mins and youll be absolutely clear with these terms.
1. Going Long with Options
- Buy a call option
- Sell a put option
Long Call
Imagine you’re optimistic about the future of Infosys aka “INFY” a tech company, and you think its stock, currently trading close to 1400 levels, will rise in the next few months
You decide to go long by purchasing a call option with a strike price of rs 1400 and an expiration date three months from now by paying a premium of lets say 50 rs.
This call option gives you the right to buy Infys’s stock at Rs. 1400 at expiry.
If Infys’s stock price indeed rises to Rs. 1600 at expiry, you could buy the stock at 1400 (as per the option contract ) and then immediately sell it at rs 1600 in the market, pocketing a 150 profit per share. (Spot Price Rs 1600 – Strike Price Rs 1400 – Premium paid Rs 50 = 150/- Net profit * lot size 400 = Rs 60,00/- profit)
Heres how the transaction will look like:
Infy CMP = 1400
Infy 1400 call option (3 months expiry) = Rs 50
Spot at expiry = Rs 1600
Lot size = 400 shares
Profit on expiry = (Spot price at expiry – exercise price – premium paid)* Lot size
= (1600 – 1400 – 50)*400
= Rs 60,000 profit on 1 lot of infy.
Short Put
Another way of creating a long position is to Short a put Option. Instead of buying a call option of infy you can sell a Put option to create a long position in Infosys.
Lets say the spot price of infy is the same , trading at 1400. You can sell an ATM put of 1400 strike price trading at rs 55. Now since your shorting a put option , your profit potential is restricted.
Heres how the transaction will look like:
Infy CMP = 1400
Infy 1400 put option (3 months expiry) = Rs 55
Spot at expiry = Rs 1600
Lot size = 400 shares
Profit on expiry = (Exercise Price – Spot price – premium received) * lot size
And as we have learnt Chapter 3 – Option premium pricing , since the difference between exercise price and spot price cannot be negative , therefore the premium is the profit for the option seller.
Profit on expiry = Premium Received* Lot size
= 55*400
= Rs 22,000/- profit on 1 lot of infy
Remember we had discussed that the reason why option sellers make profit is that when an option expires OtM , the time value that an option premium has goes down to zero and the seller gets to keep it as profits.
And since Infys 1400 put option became OTM ( since spot price > strike price ) as an option seller , you made a profit of Rs 22,000/-
Summary:
View | Position Created | Instrument | Maximum profit | Maximum loss |
Bullish | Long Call Option | Bought Infy 1400 Call @ 50 | Unlimited. | Limited to the extent of the premium paid |
Bullish | Short Put Option | Sold Infy 1400 Put @ 55 | Limited to the extent of the premium sold. | Unlimited. |
2. Going Short in Options
There are 2 ways of taking a long position with options.
- Buy a Put Option
- Sell a Call Option
Going short with options can indicate 2 things.
- Going short can mean your bias is bearish (here we are referring to as taking a bearish bias on the underlying asset)
- You can only make profits when the price of the underlying asset “Falls“
Let’s take some examples on how you can create short positions with options.
Long Puts
Imagine you have a bearish view on HDFC Bank, the largest banking stock which is currently trading 1500 and you are expecting a fall in the stock prices on the coming months.
So you can create a Short Position by Going Long in Put Options
You decide to Long Put meaning, to buy a Put Option of the strike price of 1500 which will expire in the next 2 months, at a premium of let’s say Rs. 30. This Put option gives you the right to sell the HDFC bank stock at the same price of Rs. 1500 at expiry.
Now, say you view was right and the stock price goes down to Rs. 1300.
So the put option you bought gave you the right to Sell HDFC bank at rs 1500. And since the price at expiry has fallen as anticipated , you can exercise your put option so that you can buy HDFC Bank at Rs 1300 from the market and sell it to the put option seller at Rs 1500. Thus pocketing Rs 93,500/- Rs profit.
Here's how the transaction looks like:
HDFC CMP = Rs 1500
HDFC 1500 Put ( 2 months expiry ) = 30 rs
Spot at expiry = Rs 1300
Lot size = 550 shares
Profit on expiry = ( Exercise price – Spot price at expiry- premium paid )* Lot size
= ( 1500 – 1300 – 30 ) * 550
= Rs 93,500 /- on 1 lot of HDFC Bank.
Maximum loss potential = premium paid rs 50 * lot size 550 = 27,500/-
Similar to the infy example where we had the choice to short put option to go long , there’s another way by which you can also take a short position in HDFC Bank ie. by selling a call option.
Short call
With the same bearish view in mind , instead of buying a put option, you can create a short position by selling a Call Option.
Here the strike price is the CMP which is 1500 and the premium is let’s say Rs 30.
The transaction will look like this:
HDFC CMP = Rs 1500
HDFC 1500 Call (2 months expiry) = 30 Rs
Spot at expiry = Rs 1300
Lot size = 550 shares
Profit on expiry = Premium Received* Lot size
= 30 * 550
= Rs 16,500/- on 1 lot of HDFC Bank
Summary:
View | Position Created | Instrument | Maximum profit | Maximum loss |
Bearish | Long Put Option | Bought HDFC 1500 Put @ 50 | Unlimited ( until the price goes down to 0 ) | Limited to the extent of the premium paid |
Bearish | Short Call Option | Sold HDFC 1500 Call @ 50 | Limited to the extent of the premium sold. | Unlimited. |
Option Buying Vs Option Selling
Now one can argue which is best , option buying or option selling. Both have their pros and cons.
Option buying seems to be a safer choice since the profit potential is unlimited while the loss is always limited.
Option Selling on the other hand is risky but the probability of sellers making is higher (as we learnt while studying the option premium pricing Chapter).
When you go Short in options, you have the potential to make limited profits, or the prices fall sharply or if the price goes up, while your risk is unlimited as you are selling options.
Conclusion
Traders, all the above examples discussed, show various ways of going long and short involving option buying as well as option selling to execute the trades.
The only thing that is different was the risk reward ratios which is:
Option buyers will always have limited risk and unlimited return potential. By selling options, a trader will always have a limited profit potential whereas the loss potential can be unlimited.
As you can see in our examples discussed above:
View | Position Created | Instrument | Profit | Maximum loss |
Bullish | Long Call Option | Bought Infy 1400 Call @ rs 50 | 60,000/- | 27,500/- |
Bullish | Short Put Option | Sold Infy 1400 Put @ rs 55 | 22,000/- | Unlimited |
Bearish | Long Put Option | Bought HDFC 1500 Put @ rs 30 | 93,500/- | 27,500/- |
Bearish | Short Call Option | Sold HDFC 1500 Call @ rs 30 | 16,500/- | Unlimited |
While taking a Long or Short Position , Option Buying seemed to rationally a better choice since profitability indeed seems better given the fact that the risk was limited.
But theres always an inherent risk to option buying which we all know pretty well by now , which is – ( you guessed it right ) “theta decay“.
If the prices remained sideways , option buyers will loose the premium that has been paid to the option sellers.
While option sellers have the risk of having a strong momentum which could go against them. Hence forcing them to exit their short positions ( short squeeze ) and hitting their stop losses, ultimately leading to losses!
So which is better , both option buying and option selling have the potential to make money but the fact is , it totally depends on the risk profile of the trader and also how well a trader follows risk management.
If you are someone who is risk averse then option buying could be better choice. Whereas if you are someone who wants to take high probability trades and is willing to take calculated risk , then Option Selling is a better choice.
A gentle disclaimer here, although option selling is one of the most lucrative forms of trading, it’s indeed challenging. This is mainly because option selling has unlimited risk potential, remember we have discussed this in our earlier we explained why traders sell options.
Remember, options trading involves risks, and the potential for profit comes with the potential for loss.
It is therefore important to have a good understanding of the market, strategies, and risk management before engaging in options trading.
Always start with small positions if you’re a beginner and gradually increase your exposure as you gain more experience.
With this we come to an end of this Chapter. In the next Chapter we will learn how can we use Option Greeks to our advantage while trading in options.
See you in the next one!
Chapter 10: How to Use Options Greeks to Trade Better?
Options trading can be a powerful tool to manage risk, enhance returns, or speculate on market movements.
However, to become a successful options trader, it’s essential to grasp the concept of “Options Greeks.”
These Greek letters represent a set of metrics that help traders better understand and manage their positions.
In this Chapter, we will break down what Options Greeks are and how they can be used to trade options more effectively.
What are Options Greeks?
Options Greeks are a group of risk metrics that quantify various aspects of an options contract.
They help traders evaluate and predict potential changes in an option’s price with factors such as underlying asset price movements, time decay, implied volatility changes, and interest rates.
Each Greek letter corresponds to a different aspect of options pricing and risk management:
- Delta
- Gamma
- Theta
- Vega
- Rho
1. Delta
Delta measures how much an option’s price will change in response to a 1 Rupee change in the underlying asset’s price.
Put options have negative delta whereas call options have positive delta and It ranges from -1 to 1 for put and call options, respectively.
A higher delta means the option’s price moves more closely in line with the underlying asset.
For example, if you have a call option with a delta of 0.70 and the underlying stock increases by Rs. 10, the option’s price would rise by ~ 7 rupees.
2. Gamma
Gamma measures the rate of change of an option’s delta concerning changes in the underlying asset’s price.
It tells you how delta itself changes as the stock price moves. Gamma is highest for options that are near the money and close to expiration.
For example, if your option has a gamma of 0.05, its delta will change by 0.05 for every 1 rupee move in the underlying asset’s price.
3. Theta
Theta quantifies the rate at which an option’s value decreases with the passage of time, also known as time decay.
It’s particularly crucial for traders holding options contracts, as time decay can erode the value of the option.
For example, if your option has a theta of -0.50, its value will decrease by Rupees 0.50 (50 paise) per day, all else being equal.
4. Vega
Vega measures how much an option’s price will change for each percentage point change in implied volatility.
It reflects sensitivity to changes in market sentiment and can be crucial during volatile times.
For example, if your option has a vega of 0.5, it should increase by Rupees 0.50 (50 paise) for every 1% increase in implied volatility.
5. Rho
Rho indicates how much an option’s price will change for a 1% change in interest rates.
This Greek is less critical for short-term traders but can be relevant for longer-term options.
For example, if your option has a rho of 0.05, its price should increase by 0.05 rupees Or 5 paise for every 1% increase in interest rates.
How Can Options Greeks Help in Options Trading?
One can argue over the fact that option Greeks are quite different in theory than in practice.
However, it’s really important to understand these concepts in theory and then apply the logic behind these concepts to improve your trading.
Having said that, option Greeks can have multiple applications and can be used to design various option trading strategies too.
The most common usecase by understanding and applying Options Greeks like Delta and Gamma is – you may be able to protect your portfolio during a market downturn and capitalize on the changing dynamics to enhance your hedging strategy.
Here are some examples on how each one can be used to enhance your options trading strategies:
1. Delta for Directional Trading Or Option Selling
Delta can help you select options that match your market outlook. For bullish views, choose call options with high positive delta values. For bearish views, select put options with high negative delta values.
You also need to keep in mind that higher delta values could have higher fluctuations in your MTMs.
If the underlying asset is volatile, the higher delta value option premiums will also be volatile compared to the lower delta options.
So it’s important to choose a right strike price which is aligned to your risk reward matrix.
Delta can also help you in strike selection. For example, if you are an option writer, selling call or put options but your strategy is designed to handle minimum risk, then you might want to sell OTM options with lower delta values.
That’s because there is lesser volatility and thus, you could have a higher probability of making profits in your strategy versus selling higher delta value options.
Options with higher delta values indicate that the option’s price is more sensitive to changes in the underlying asset’s price, meaning it will move more in sync with the stock’s movements.
2. Gamma for Risk Management
Gamma is crucial for managing your delta risk. If you want to keep a specific delta, you’ll need to adjust your position regularly as gamma changes. This is especially important when hedging or managing a portfolio of options.
For example, if you know the gamma values of your positions, it’s easier to predict how fast the option prices can move incase of a sharp move in the prices of the underlying asset
3. Theta for Time Decay Strategies
Theta can guide you in selecting the right time horizon for your trades.
If you’re trading options with limited time to expiration, you need to be aware of theta’s impact.
Options with high theta can be suitable for short-term trades, while those with low theta might be better for longer-term strategies.
4. Vega for Volatility Trading
Vega can help you gauge market sentiment and adapt your strategy accordingly.** In times of expected volatility, you might favour options with higher vega to capitalise on potential price swings.
5. Rho for Interest Rate Sensitivity
Rho is most relevant when interest rates are expected to change significantly. If you anticipate interest rate movements, consider options with higher rho values to potentially benefit from these rate changes.
Let’s put it all together in an example
Option Greeks in Practice
Successful options trading involves a combination of these Greeks, depending on your strategy and market conditions.
Let’s explore another example of how to use Options Greeks to trade better. Imagine you’re a trader expecting high volatility in Bajaj Finance stock due to an upcoming earnings report.
This quarter has been good for the company and you are expecting that the results to be exceptionally good. The CMP of Bajaj Finance is 7400 and you are expecting a sharp move in the coming days before the quarterly results.
To navigate this, you analyze the Options Greeks.
1. Using Delta for Guidance
By looking at the option strikes available, you plan to choose a call option having a Delta of 0.70.
This implies that for every 10 Rupee increase in the stock, your option’s value should go up by around 7 Rupee.
Thus, it aligns with your bullish outlook as if the spot price of the stock will see a spike, the option you choose will see some great momentum.
2. Analysing Option Time Sensitivity by Theta
Recognizing that Theta of the same call option -0.03, and you are okay with this theta since you are anyway expecting some momentum in the shorter term.
A higher theta value would mean that time decay may impact your option premium prices in case there is no momentum during the holding period.
But in our case, since we are banking on the price of Bajaj finance to increase quickly (within some days), the above theta value seems fair to us and probably your call option will be less impacted by time decay.
3. Gauging Volatility with Vega
Seeing a Vega of 0.15, you anticipate a potential spike in implied volatility around the earnings report. This insight encourages you to hold onto the option, expecting an increase in its value.
4. Hedging with Gamma
Later, the stock starts moving. Keeping the Gamma of 0.07 in mind , you adjust your position as the stock price shifts. This helps maintain your desired Delta, preventing overexposure.
By incorporating Options Greeks into your strategy, you’ve strategically chosen an option that aligns with your outlook and risk tolerance.
As the stock behaves, you use Gamma to fine-tune your position, maximizing potential gains while managing risk.
This example showcases how traders use Options Greeks to make informed decisions and adapt to market dynamics.
Chapter 11: Important Tools & Indicators for Options Trading
Options trading is like a chess game within the financial markets, requiring a strategic approach and a keen understanding of the tools at your disposal.
These tools and indicators serve as your compass, guiding you through the complexities of the options landscape.
Whether you’re a novice or an intermediate-level trader, having the right instruments at hand can make a world of difference.
In this Chapter, we’ll explore the fundamental tools and indicators that can help elevate your options trading journey, empowering you to make more informed decisions and navigate the market with confidence.
1. Options Chain
Imagine the options chain as your menu in a restaurant, offering a selection of options contracts to choose from.
It displays various strike prices and expiration dates for a particular underlying asset.
This tool allows you to quickly assess the available options and their associated premiums, enabling you to select contracts that align with your trading strategy.
It’s like having a birds eye view of the different strike prices at once glance.
2. The Greeks
As we have learnt in our earlier Chapter, option Greeks are a set of metrics that provide insights into how options prices are likely to change in response to different factors.
Delta is your directional compass as it measures how much an option’s price is expected to change for a one-point move in the underlying asset.
Quite helpful to decide on stop losses and you can anticipate probable move in option price with respect to the change in the underlying.
Similarly all the other Greeks will help you to make smarter decisions while trading in options. <Read about all Greeks here>
3. Implied Volatility (IV) and Historical Volatility (HV)
These are like weather forecasts for the market. Implied volatility reflects the market’s expectation of future price swings.
High IV suggests greater anticipated volatility, potentially leading to higher option premiums.
Historical volatility, on the other hand, looks at past price movements, providing context for current market conditions.
4. Technical Analysis Indicators
While options trading often involves predicting short-term price movements, technical analysis tools can be invaluable.
They include indicators like moving averages and oscillators like:
- Relative Strength Index (RSI)
- Moving Average Convergence Divergence (MACD)
These tools can help identify potential entry and exit points and sometimes reveal potentially lucrative trading opportunities.
5. Fundamental Analysis
For traders dealing with options on stocks, understanding the underlying company’s financial health is crucial.
Earnings reports, news releases, and financial ratios (like the price-to-earnings ratio) provide vital insights in spotting a good trade using option strategies.
6. Option Pricing Models
Tools like the Black-Scholes Model and the Binomial Model help estimate the fair value of options.
While they provide theoretical values, they can be used as a benchmark to evaluate whether options are overpriced or underpriced.
7. Open Interest and Volume
These metrics reflect the level of activity in a particular options contract. High open interest and volume suggest liquidity and interest in that contract.
Particularly helpful to judge market sentiments, as change in open interest of strike prices along with rising or falling volumes can indicate bullish or bearish market sentiments.
As an option trader, you should try to use a combination of tools available and see what works for you, based on your strategy, risk appetite, and other factors. “ Try and try until you succeed“. Indeed, your hard work can reward you exponentially.
On this note we come to the end of the Chapter.
Futures Trading Guide
Learn futures trading the right way through chapters that will help you progress from a beginner to a well-informed futures trading enthusiast.
Chapter 1: Introduction to Futures Trading
History of Futures
There are many theories as to how Future Contracts started, some believe that in the year 1967 – The Dojima Rice Exchange, in Osaka, Japan is considered to be the first futures exchange market, to meet the needs of samurai who were being paid in rice as they needed a stable conversion to coin after a series of bad harvests.
Later, The Chicago Board of Trade (CBOT) listed the first-ever standardized “exchange-traded” which started getting known as futures contracts. After the CBOT, the Agri commodities trading trend started picking up momentum.
Now, there were futures contracts for not only grain trading but for different commodities. Also, a number of exchanges are starting to emerge across the world.
From the year 1875, cotton futures were being traded in the financial capital of India, Mumbai ( earlier known as Bombay ) and within a few years, this had expanded to futures on edible oilseeds complex, raw jute and jute goods and bullion. In the 1930s two thirds of all futures were in one single commodity which was Wheat.
Financial futures were introduced in 1972, and fast forward to now, there are futures contracts to trade in currencies, stock market indexes, interest rate futures and even in cryptocurrencies where they have perpetual futures contracts which are increasingly popular with traders across the world.
History Of Derivative Market In India
Derivative markets have been evolving in India for a long time. Derivative Markets gained popularity in the year 1875 when the Bombay cotton trade association started future trading in India.
However, the Government of India banned cash settlement and options trading and so derivatives trading shifted to an informal forward market.
Fast forward to the year of Y2K, derivative trading commenced in India in June 2000 after SEBI granted the final approval to this effect in May 2001 on the recommendation of the L.C.Gupta committee.
SEBI permitted the derivative segments of 2 stock exchanges NSE and BSE and their clearing house/ corporation to commence trading and settlement in approval of derivative contracts.
In recent times, the F&O market made record high turnover crossing over 200 lakh crores, and is growing at a much faster pace. By the way, do you know who brought forward the concept of Derivatives to the world? A bunch of farmers!
Here is the story behind it! It all started In the 19th Century when farmers in the US had two issues:
Finding Buyers for their commodities and de-risking themselves in case of price fluctuations. To solve this, they created a joint market called the Chicago Board of Trade (CBOT) which later evolved into the first-ever derivatives market called the Chicago Merchantile Exchange.
They standardized the contracts here, where buyers & sellers traded at a fixed price on a future date, which we call the ‘Futures’ contract today. And BOOM! The derivatives market exploded since then.
Chapter 2: What are Futures Contracts?
Most people start trading futures to speculate and maximize their profits. Why? Because futures involve leverage, which is the ability to have exposure to a large contract value with a relatively small amount of capital.
Even then only a handful of traders succeed and the rest may not be as fortunate – they might make losses and some may completely exit the market Nevertheless, the ones who become successful and profitable seem to have a common trait -they get their basics right.
This includes understanding the risks involved and developing risk management skills even before they start trading futures. This is what we’re going to help you with. But that’s not all – we’re going to walk you through the entire journey of becoming a smart futures trader, starting with what is futures trading.
1.1 What are Futures?
A futures contract is a derivative financial instrument that derives its value from an underlying asset. To understand futures, let’s look at what derivatives are.
By The Way...
If you already know the basics of derivatives, you can skip to chapter 1.3.
1.2 Basics of Derivatives
A derivative is a financial instrument whose value is derived from the value of an underlying asset. The underlying can be a wide variety of assets like:
- Agri Commodities: wheat, rice, sugar, cotton, etc.
- Metals: gold, silver, aluminium, copper, zinc, nickel, tin, lead, etc.
- Energy Resources: Crude Oil, Natural Gas, Electricity, etc.
- Currencies: US Dollars, Pound Sterling, Japanese Yen, Euros, etc.
There are mainly four types of derivatives:
- Forwards
- Futures
- Options
- Swaps
We shall focus on forwards and futures for now. Forwards is a customized contractual agreement between two parties to buy or sell an underlying asset at a future date for a price that is pre-decided on the date of the contract.
Since these contracts are usually directly traded between the two parties, trade is carried out "Over-the-Counter", meaning there are no centralized exchanges involved.
1.3 Example of Forwards Contract
Mr. Nivesh, a renowned businessman, owns Niveshy which is the best bakery in town. He’s able to sell quality products consistently at a reasonable price for decades.
What's fascinating, he is consistently profitable despite fluctuations in the price of wheat, which constitutes 90% of his business’ total raw material consumption. Wondering how?
Mr. Nivesh gets a set supply of wheat from Mr. Kisaan at a fixed price at the start of the financial year via a forward contract. As we discussed earlier, forwards are a customized contractual agreement between two parties.
In this instance, the “parties” are Mr. Nivesh & Mr. Kisaan. They have agreed to buy and sell wheat, which is the “underlying” with a customized expiry date and price. Under this contract, both parties are obliged to honor their commitments:
- Making payments on time: Mr Nivesh
- Timely delivery of Wheat: Mr Kisaan
Mr. Nivesh requires 100 kgs of wheat for his products every month. The current market price is Rs. 16 per kg. He is well aware that demand for wheat increases during the festive season, which will directly impact his profit.
To avoid this price risk, he enters into the forward contract with Mr. Kisaan, where he agrees to buy wheat for a fixed price of Rs. 18/- per kg, which Mr. Kisaan will supply for the term of one year. Once both parties enter the contract, they are obligated to honor the above terms and conditions.
You must be thinking, why would Mr. Nivesh pay a premium price to Mr. Kisaan even though the current market price is lower? It's because Mr. Nivesh hedged his price risk by ensuring that he would get his supplies at a fixed price irrespective of market fluctuations.
With his experience, he knows that wheat prices can go upwards up to Rs. 20 per kg during festivals due to high demand. But now, Mr Nivesh is not worried. He will get wheat at a fixed rate of Rs. 18 per kg.
Mr. Kisaan, on the other hand, doesn't have to go and find multiple buyers in the market. Thus, this is a win-win situation for both.
To conclude, Mr Nivesh and Mr Kisaan find the forwards contract to be a great way to hedge their risk. Both had the same intent and requirements which they agreed to and executed the deal between them smoothly.
Imagine if Mr Kisaan’s capacity to produce wheat was lesser than Mr Nivesh’s requirement. Or, Mr Nivesh’s business slows down and he defaults on payments. In such a case, who would hold both parties accountable for the financial losses caused? Nobody. That’s why futures contracts exist.
1.4 The Problem with Forwards Contracts
Forward Contracts became popular and became widely accepted amongst buyers and sellers. They proved to be a great tool for hedging. But with the advent of globalization, traders began to increase their horizon and looked beyond geographical borders for trading.
This led to them buying or selling their products in the domestic markets and, at the same time, they started importing and exporting goods worldwide. That’s when traders found it difficult to utilize forward contracts. Some of the common limitations were as follows.
1. Lack of Standardisation & Liquidity Risk
Mismatch in requirements of buyers and sellers was the most common problem with forward contracts. That’s why it was difficult for a buyer to find a seller (and vice versa) who could fulfill the requirements of their terms and conditions.
Buyers would have to deal with multiple sellers for the same goods and sometimes buy the same products at a premium which impacted their profitability. That’s not all.
Most of the time, buyers had to hire professional investment banks or third parties who would create liquidity. As they say, there are no free lunches and the buyers & sellers have to pay from their pockets, thus impacting profitability in trading.
2. No Regulatory Control Over Settlements
There was no central authority to regulate and protect the interest of buyers and sellers who entered into forwards, which ultimately gave rise to default risks. A seller could do nothing if the buyer takes the delivery of raw materials but refuses to pay.
3. Default Risk
No regulatory control over forward contracts coupled with adverse market conditions often created huge volatility, potentially causing uncertain price fluctuations. Imagine a black swan event like a lockdown.
Mr Nivesh could run out of business sooner than anticipated and will default on payments. Mr Kisaan would have no doors to knock on! Hence, default risk was a major hurdle to the mass adoption of forward contracts.
Traders had to find out a way to reduce these risks. The need for a more standardized and regulated market gave rise to ‘Futures Contracts’. Let's look at how futures contracts work and helped overcome the limitations of forwards.
Chapter 3: How Futures Contracts Work
Future contracts are almost the same as forwards. The significant difference between them is that futures are exchange-traded. The deal is made through a regulated exchange which acts as a centralized platform, often known as an intermediary between the buyers and the sellers).
Where are Futures Traded?
In India, equity futures contracts are traded on the National Stock exchange (NSE) and the Bombay Stock Exchange (BSE) Unlike forwards, futures can be bought or sold in lots. A ‘lot’ is a bunch of securities clubbed together under one contract.
In fact, futures contracts are traded in lot sizes only. In the case of stocks, the exchanges decide on the number of shares to be traded (known as the F&O lot size). Similarly, commodity and currency lot sizes are defined by the respective exchanges.
Here comes the most exciting part about futures! Futures trading involves leverage. To buy a futures contract, the buyer does not pay the full contract value. Instead, the buyer needs to deposit margin money to the broker or exchange.
This margin acts as collateral, to cover the credit risk that the broker or the exchanges may face in case the buyer does not honor the contract. Similarly, a seller also has to pay a deposit to the broker or exchange, so that the buyer can be compensated if the seller fails to meet the obligations to the contracts.
There’s one more difference. Futures contracts have an expiry and after the expiry date of the futures contract after which either the contracts have been settled in cash or physical delivery. Any of the two options is compulsory, unlike forwards which are customized contracts for requirements specifications.
2.1 Why Trade Futures?
Why do some of the most successful traders or companies in the world remain profitable consistently? They are good at managing their risk consistently. Risk management is the foundation of the trading futures contract.
In fact, futures contracts evolved primarily to help traders manage risk. Why? Because the price of assets is never linear. Over time, prices are influenced by macro economic changes like increase or decrease in demand and supply or geopolitical tensions. Sometimes, this even includes wars or natural calamities.
That’s why traders or large companies have to deal with so many fluctuations. Hence futures contracts are a great tool for risk management. However, uncertainty leads to volatility, which means there’s sharp price movements in the spot prices of the assets.
This welcomed a new genre of market participants known as the speculators or short term traders. They had no interest in taking physical delivery of the assets. Instead, they wanted to benefit from price movements and make gains by forecasting market trends and analysing price movements.
So to answer the question, why futures? The objective is clear:
- Risk management
- Speculation
Opportunity to satisfy biases in the markets are the two main reasons traders choose to enter into the world of Futures Market.
2.2 Who Trades Future Contracts?
Now you know why traders, groups of individuals running medium and small enterprises, or large corporations use futures contracts. They need to manage risks and uncertainties to become successful.
Some people who aren’t running their businesses are speculating in an asset by trading futures in the short term. They all are basically Market Participants of the Futures Market and can be categorised into 3 types depending on their rationale.
1. Hedgers
Individuals or companies hedge against various market variables or any other uncertainty pertaining to demand supply mismatch, price fluctuations of the assets they use for production. They enter into a futures contract to reduce their exposure and hedge against volatility.
2. Speculators
These are traders who buy and sell futures contracts before its expiry. It is easier for a trader to create a speculative position using futures contracts than by actually trading the underlying asset or commodity.
Instead of buying and storing the underlying asset and selling it later, a trader can hold a long position by paying margins and sell when the price goes up.
3. Arbitrageurs
An arbitrage is a deal that produces risk free profits by exploiting a mismatch in market pricing. Arbitrageurs are traders who purchase an asset at a cheaper price from one place and sell the same asset at another place where the prices are higher.
2.3 Example of Futures Contracts
We saw how forwards work with our example of Mr Nivesh and Mr Kisaan. We also established that futures contracts are similar to forwards. Now, let’s see how a future contract works with a practical example.
Assume Mr Nivesh started trading in the stock market. Mr Nivesh is bullish on the company Reliance Ltd and wants to go “long”, which simply means he wants to buy and hold the stock for a period of time.
Since he has been a successful businessman and understands how to trade in forwards, he seems fairly confident that he can speculate his views on the stock. His sole intention is to maximize returns by speculating in the market.
The current market price (CMP) in cash markets also known as the Spot Price of Reliance is let’s say Rs. 2000 on September 1st. Mr Nivesh has a capital of Rs. 4,00,000 with which he wants to invest in Reliance shares and hold for a period of 1 month. He has 2 choices.
Choice 1
He can buy the stock from the cash markets segment of NSE through a broker, which would cost him INR 4,00,000 (200 shares *2000 per share). The amount is paid to the broker, who will pay to the exchange and give the delivery of shares to Mr Nivesh in his demat account (brokerage and taxes that are ignored in this choice).
Choice 2
He can buy 5 lots of Reliance futures September near month expiry from the NSE F&O segment, which is traded at Rs. 2100 (1 lot of Reliance futures has 250 shares per lot) and pay only 15% of the contract value as “margin money” to the broker. The broker has to deposit this margin on Mr Nivesh’s behalf to the exchange. Now, he has to pay INR 3,93,750 (1250*2100*15%) as the margin.
At the expiry of the contract, he has to make the balance payment to the exchange and the exchange will ensure that Mr. Nivesh gets 1250 shares credited in his demat account.
Mr. Nivesh now has to decide which choice will give him maximum returns, given the fact that he understands all the risks that are involved in trading and is willing to speculate in the futures market.
Both the choices have their pros and cons, but which one do you think is more profitable for him? Take a minute to think about it.
Done? Let’s analyse.
Either option would have made him profits if his view was right or else he would book losses at the end of the month or expiry of the futures, depending on which instrument he chooses take his position.
Choice 1 Vs Choice 2
| Choice 1 | Choice 2 |
|---|---|
|
Reliance in cash markets |
Reliance September Futures |
|
Holding Period - Month End |
Holding Period - until expiry |
|
TOTAL INVESTMENT =
Paid in cash |
TOTAL INVESTMENT =
Margin Money Paid to Broker |
|
200 shares * 2000 cost price
= 400000 full amount paid to Broker |
1 lot (250 shares) 5*250*2100*15%
= 393750 |
|
Selling Price = 2500 |
Selling Price = 2500 |
|
Profit = Selling Price - Cost
= 2500 - 2000
= 500 rs per share * 200 shares held Total Profit = 100000 |
Profit = Selling Price - Cost
= 2500 - 2100
= 400 rs per share*1250 shares held Total Profit = 500000 |
In both choices, similar capital was used to fund the investment. Since futures contracts allow leverage, Mr Nivesh got exposure to larger contract value by deploying the same capital that he had planned to. As a result Mr Nivesh’s ROI was higher on the futures contract vs the cash market returns.
| Choice 1 | Choice 2 |
|---|---|
|
Reliance in cash markets |
Reliance September Futures |
|
TOTAL INVESTMENT = 400000 |
TOTAL INVESTMENT = 393750 |
|
ROI = Net income / Cost of investment x 100 |
ROI = Net income / Cost of investment x 100 |
|
ROI = 100000/400000*100
= 25% |
ROI = 500000/393750*100
= 126% 10x more than Choice 1 |
Clearly Choice 2 is more profitable than Choice 1. But what if the price goes down?
2.4 The Power of Leverage
We assume that an exchange has a mandatory 20% margin requirement from both parties to enter into the contract. They will need to deposit INR 2,00,000 (20%*10 lacs) as the initial margin.
A futures contract allows them to take INR 10,00,000 worth of exposure just by paying INR 2,00,000 with essentially a leverage of 5x (Leverage = Contract Value/Margin amount ).
That’s the beauty of futures contracts, as they allow you to execute trades at a future date just by paying an upfront margin money, which is a small fraction of the total contract value.
Let’s get back to Mr Nivesh’s example. A ~20% increase in the price of Reliance Industries helped him get 126% returns on his investments. Compared to the cash market position where he deployed his entire capital and even a 5% extra movement in prices, he could manage to get only 25% returns on his investment.
As they say, with great power comes greater responsibility – trading in futures comes with a disclaimer. High risk, high returns. Returns on investments indeed can be compounded exponentially. But what if the trade goes against you? That’s the risk that needs consideration and caution.
Let us consider another example , an extension to the previous one which would express the caution which we referred in our disclaimer above.
What If Mr Nivesh had the same options, but this time he choose to increase his position sizing to 5 lots, by deploying his entire capital in his margin account and the price goes down by 15%. What happens now ? Here’s how leverage works.
| Choice 1 | Choice 2 |
|---|---|
|
Reliance in cash markets (Holding Period - Month End) |
Reliance September Futures (Holding Period - until expiry) |
|
TOTAL INVESTMENT =
200 shares * 2000 cost price = 400000 full amount paid to Broker |
TOTAL INVESTMENT = 1 lot (250 shares) 5*250*2100*15% = = 393750 paid to Broker as Margin |
|
Selling Price = 1800 |
Selling Price = 1800 |
|
Loss = Selling Price - Cost Price |
Loss = Selling Price - Cost Price |
|
= 2000 - 1700 = = 300 rs per share * 200 shares held |
= 2100 - 1785 = = 315 rs per share*1250 shares held |
|
Total Loss = 60,000 |
Total Loss = 3,93,750 |
As you can see, a 15% down move could have easily wiped out Mr Niveshs’ capital due to a higher leveraged position.
Although leverage does increase the ROIs, if there is no risk management system in place, the risk of going All In could be an expensive bet. In the next chapter we shall discuss the various types of futures contracts traded in India.
Chapter 4: Types of Futures
You’ve more or less understood what are futures and how they work. Let’s see the various types of futures contracts that are traded.
3.1 Commodity Futures
Commodity futures contracts are standardised contracts in which buyers and sellers agree to buy/sell physical assets like wheat, rice, crude oil, gold silver, and more at a predetermined date.
These futures are either settled in cash or physical delivery has to be given to the buyer of the contract on expiry.
Commodity futures are traded on an exchange (NSE, MCX, NCDEX) that guarantees the settlement of the underlying commodity and ensures both parties honor their commitments. Commodity futures are generally known to provide a hedge for the price risk.
3.2 Currency Futures
Currency futures are a contractual obligation to exchange one currency for another at a specified date in the future at a price. The price at which the buying and selling is done is called the exchange rate. The most commonly traded currencies are USD, EUR, JPY, and GBP.
Currency futures can also be used to speculate and profit from rising or falling exchange rates or to hedge against any potential exchange rate volatility by someone who is expecting a payment from a foreign buyer.
In India, currency futures are cash-settled. This means that foreign currency is not delivered to your demat account when the contract expires.
3.3 Interest Rate Futures
An interest rate future (IRF) is a financial derivative that allows exposure to changes in interest rates. Investors can use IRFs to either speculate on the direction of interest rates with futures or use them to hedge against changes in rates.
In most countries, government backed securities/treasury bills are used as the underlying asset. The IRF contract allows the buyer and seller to fix the price of the interest-bearing asset for a future date. Hence, they hedge themselves from changing interest rates.
3.4 Stock & Index Futures
Stock futures are derivative financial instruments wherein traders agree to buy/sell a particular stock which is the underlying asset. Stock futures are used by speculators and arbitrageurs to speculate their views on a particular stock.
Unlike the stocks traded in the cash markets, where even one share is traded, stock futures are traded in lot sizes and the number of shares in 1 lot is determined by the exchange.
In India, there are currently close to 198 stocks which are traded on the NSE which is the most liquid exchange. Similar to the stock futures, there are index futures which are available to trade in the F&O markets.
An Index future is a derivatives contract wherein the underlying financial instrument is the stock index and it replicates the movement similar to that of the underlying index.
An index is an indicator of the performance of the overall market or a particular sector. Examples of some of the popular which are traded in the futures market in India are the Nifty Futures, Bank Nifty Futures, FinNifty futures etc.
Chapter 5: How Much Money is Required for Futures Trading?
The minimum amount of money required to start futures trading is the “Margin Money”, an amount that is a portion of the futures contract calculated and fixed by exchanges.
Remember, futures are standardised exchange-traded contracts and the exchange plays a major role in clearing and settlement to counter the risks of default.
To eliminate such a risk, the exchange has amechanism where a futures trader must maintain a minimum balance deposit with a broker or the exchange as Margin Money.
In case one party to the contract defaults, the exchange will deduct the losses from the margin deposit of the other party and compensate the other party. That’s how the exchange risk management mechanism works.
Since margin calculations are established on the future contract value, any change in the volatility of these contracts could increase the risk of default. This leads to exchanges increasing margin requirements.
It is, therefore, crucial for every trader entering the F&O markets to understand how margins are calculated. Let’s tackle the entire concept of margins step by step.
4.1 What is Margin?
An exchange demands Margins (initial + exposure margin + VaR margin) that can vary from 10% to 20% or even more, depending on how volatile is the underlying asset, plus a Daily Settlement of MTM – marking the profits or losses to the market prices at closing ( Daily MTM ) from both parties. All of this is required to manage risk.
We shall see how exchanges use tools for risk management in the coming chapters. For now, let’s dig into how margins are calculated mathematically and derive the margin prerequisites for a trader who wants to start futures trading. This will solve the most important question – How much money is required to trade a futures contract.
4.2 Margin Calculation for Stock & Index Futures on NSE
NSE has a comprehensive risk containment instrument which defines the margin requirements in a stock or index based on its volatility and some defined standards for the F&O segment.
The most crucial component of a risk containment mechanism is the online position monitoring and margining system.
The actual calculations of estimation of margins and positions monitoring is done on a real time basis. NSE Clearing uses the SPAN (Standard Portfolio Analysis of Risk) system for the purpose of margining, which is a portfolio-based system.
For Dhan users, the app calculates the required margin as per the exchanges on a real-time basis. Thus, instead of getting into the complex calculations, let us show you how margin requirements work.
Let us assume that you are bullish on companies making EVs in India and have an eye on Tata Motors.
Suddenly the management of Tata Motors launches 4 to 5 new EV models. That’s the trigger you were looking for, sufficient to create a directional bullish view of the stock.
That’s why you decide to buy Tata Motors Futures. Here’s how much margin you need in your trading account to take a position.
Margin for Trading Futures
1 Lot = 1,425 shares
Margin Required = 26.84%
Contract Value = Lot size * CMP of Futures
= 1,425 * 397
= 5,65,275
Margin amount = 5,65,275 * 26.84%
= 1,51,840
Leverage = Contract Value/Margin Amount
Leverage = 4x
To buy a futures contract of Tata Motors stock, you will need INR 1,51,840 as a minimum balance in your trading account as a margin.
Another example we can take is Index Futures. RBI indicates that they are about to increase interest rates in the economy to curb inflation.
Direct beneficiaries of the increase in interest rates are banks, as now they will charge higher interest rates to their clients. This would increase their profits and share prices too shortly.
You are bullish on the banking sector and decide to buy Bank Nifty futures since shares of all banks are the underlying asset. Hence, instead of choosing a particular banking stock, you take a long position in the Bank Nifty futures. Here’s how much money you need for the trade.
Margin for Bank Nifty Futures
1 Lot = 25 shares
Margin Required = 14.86%
CMP = 39,290
Contract Value = Lot size * CMP of Futures
= 25 * 39,300
= 9,82,250
Margin amount = 9,82,250* 14.86%
= 1,45,962.
Leverage = Contract Value/Margin Amount = 6.73x
Let’s take another example, suppose you want to buy gold from MCX which is a leading commodities exchange in India, the CMP Gold futures traded on MCX is 50,200.
Margin for Commodity Futures
1 Lot = 100 shares
Margin Required = 7.26%
Contract Value = Lot size * CMP of Futures
= 100 * 50,200
= 50,20,000
Margin amount = 50,20,000* 7.26%
= 3,64,452
Leverage = Contract Value/Margin Amount
= 13.78x
As you can see, different future contracts have dissimilar margin requirements set by the exchanges with varying methodologies.
This demonstrates that margins are set by the exchange based on the volatility of the underlying asset.
Chapter 6: Pricing of Futures
Have you wondered why some listed shares have different prices? Usually, this happens when a stock is traded simultaneously in cash and the futures market. Let’s look at the example of Mr Nivesh.
He was bullish on Reliance Industries Ltd and prefered to buy Reliance futures even though they were trading at a premium to the spot price in the cash markets.
One explanation for this Mr Nivesh could be that he had no other choice.
He was tempted by the lucrative returns by taking a “long position” in the futures, instead of buying in the cash markets. But is this the only explanation for the price difference? Not necessarily.
The pricing of futures contracts depends on the price of an underlying asset. But that’s not all. Different assets have different demand and supply patterns, varied characteristics, and cyclical cash flows.
Based on such differences, futures contracts may have different pricing than their underlying asset. These factors mentioned above make it even more complicated to design a single methodology for price calculation.
Market participants like traders, investors, and arbitrageurs use various models for pricing futures contracts. Let’s dive into the most popular futures pricing models.
5.1 Cash and Carry Model
According to the Cash and Carry Model, the pricing of a futures contract is a simple addition of the carrying charge the asset to the spot price.
Futures Price = Spot Price + the Cost of Carry
where,
Spot price refers to the current market price of the underlying asset;
Cost of Carry refers to the cost incurred to carry the underlying asset from today to a future date of delivery.
Costs for a financial asset may include finance costs, transaction costs, custodial charges, etc. For commodities, the cost may also include warehousing costs, insurance etc. Known as the non-arbitrage model, the cash and carry model is based on certain assumptions.
The model assumes that in an efficient market, arbitrage opportunities cannot exist. Because, as soon as there is an opportunity to make money due to the mispricing of an asset, arbitrageurs will try and take advantage to make profits.
Traders will continue to benefit from such an arbitrage opportunity until the prices are aligned across all the markets or products. The other assumption is that contracts are held till maturity.
Meet Mr Sonawala, a second-generation jewellery store owner, keeps buying gold from the bullion market.
Mr Sonawala decides to purchase gold. The spot price of gold is Rs. 50,000 per 10 grams. He buys the gold at the spot rate.
He notices that the 3-month futures contract is currently trading at Rs. 50,200 per 10 grams. He finds an arbitrage opportunity and instantly sells the future contract at that price.
Mr Sonawala figures that the cost of financing storage and insurance for carrying the gold for three months is Rs. 150 per 10 grams. The fair price of the futures contract should be Rs. 50,150 per 10 grams.
- Spot price = Rs. 50,000 per 10 grams
- Fair Price = Rs. 50,150 per 10 grams
- 3-month futures contract Price = Rs. 50,200 per 10 grams
Thus, Mr Sonwala bought gold spot price of Rs. 50,000 and after three months.
Mr Sonawala's Net Profit
Price of Futures – Cost Price (incl. cost of carrying) = Net Profit
50,200 – 50,150 = Rs. 50 net profit
More and more sellers will find such opportunities until the cash market prices and future contract prices are aligned. Similarly, if the futures prices are less than the fair price of the asset, it will trigger reverse cash and carry arbitrage.
This means Mr Sonawala will buy gold futures and sell gold in cash markets. Even if he doesn’t have the gold to sell, he may borrow gold and sell in the cash markets to benefit from such an arbitrage.
5.2 Extension to the Cash and Carry Model
The model can also work on the assets generating returns by adding the inflows during the holding period of the underlying asset.
Assets like equity or bonds may have certain inflows like dividends on equity or interest payments on bonds during the holding period.
Thus, these inflows are adjusted in the futures fair price which can be calculated as follows.
Fair Price = Spot price + Cost of Carry – Inflows
In Mathematical terms, we can calculate the pricing of futures as follows:
F= S(1 + r-q)^T
Let us apply this formula to calculate the fair price of 3-month index futures.
Fair Price of 3-Month Index Futures
Spot price of the index (S) = 5,000
Cost of financing = 12%
Return on Index = 4%
Time to expiry = 3 months
= 5,000(1+0.12-0.04) ^90/365
= 5,095.79
The Cash and Carry model has certain assumptions, some of which are not known to be practical.
For example, the underlying asset being available in surplus in cash markets, having no transaction costs, no taxes, and no margin requirements. All these assumptions don’t work in the real world.
5.3 Convenience Yield
This concept influences the pricing of a futures contract. To understand it better let us look back at the formula for the fair price of futures contracts.
Fair Price = Spot price + Cost of Carry – Inflows
Here, inflows for assets like equity and bonds may be in the form of dividends and interest.
However, sometimes, inflows may be intangible that effectively means the values perceived by the market participants just by holding these assets.
It shows the perceived mental comfort of people holding such assets. For instance, if there is a natural disaster like earthquakes, floods, or a pandemic like Covid 19, people may start hoarding essential commodities like food & food products, vegetables and other products like oil etc.
Imagine if every person starts to behave similarly, which suddenly creates a temporary demand for the underlying asset in the cash markets. We will see a meteoric rise in prices.
In such situations, people derive convenience just by holding the asset. Thus, it is termed as convenience return or convenience yield. Convenience yield may sometimes overpower the cost of carry which leads futures to trade at a discount to the spot price of the underlying asset.
5.4 The Expectancy Model
According to this model, the price of a futures contract should be based on the expected demand for the underlying asset at a future date. The model argues that futures pricing is nothing but the expected spot price of an asset in the future.
Futures can trade at a premium or discount to the spot price of an underlying can indicate the expected direction in which the price of the underlying asset may move.
If the futures price is higher than the spot price of an underlying asset, traders may feel that the spot prices may go up. They usually refer to it as a “Contango Market”.
Similarly, if the futures prices are trading at a discount to the spot price, traders may feel that the spot price is anticipated to move downwards. This falling market is generally referred to as the “Backwardation Market”.
Chapter 7: Futures Terminologies
6.1 Spot Price
The current market price (CMP) at which an asset or a commodity is traded in the cash markets is called the Spot Price.
For example, the price of Reliance Industries is closed at 2,377.35 which is the spot price of Reliance as of 26th September 2022.
6.2 Future Price
Future price applies to an asset or a commodity which needs to be delivered at a future date. Since the transaction is done at a future date, costs for storage, finance, etc will be borne by the seller to store the asset or commodity and carry them until delivery.
Thus, the pricing of a futures contract is usually at a premium to the spot prices since it is based on the spot price of an underlying asset plus the cost of carrying that asset until the delivery date.
As you can see, the spot price of RIL is trading at INR 2,377.35 as of 26th Sept 2022. The September futures, which is the current month’s futures contract, is trading at INR 2,380.05.
The October contract is trading at INR 2,492.20 and the far month November contract is trading at INR 2,406.20.
If you notice all the monthly contracts are trading at a premium, that is because the pricing of futures is based on various factors and they can trade at a premium or discount to the spot.
6.3 Cost of Carry
The cost of carry is the relationship between spot and futures prices. Cost of carry refers to the cost incurred to hold an asset or a commodity until the expiry of the futures contract.
In the case of commodities, these costs include storage costs, plus financing costs i.e. the interest paid to finance or carry the asset till the delivery date minus any income earned on that asset during the holding period.
In the case of shares, the cost of carry refers to the interest paid to finance the purchase less any income like dividends earned during the holding period.
6.4 Contract Cycle
The contract Cycle refers to the monthly cycle in which the futures contract are traded.
Futures contracts have a maximum 3-month trading cycle:
- The near month (one)
- The next month (two)
- The far month (three)
New future contracts are launched on the trading day following the expiry of the near-month contracts. The new contracts are introduced for a three-month duration.
As you can see, there three months contracts of Reliance Futures available
- The Near month – September Series
- The Mid month – October Series
- The Far Month – November Series
Similarly, Nifty 50 Index Futures, Nifty Financial Services Index and Nifty Midcap Select Index will have 7 weekly expiration contracts (excluding monthly contracts) and 3 monthly expiration contracts.
At a given time Nifty Bank index will have 4 weekly expiration contracts. This excludes the monthly contracts. In total , 3 monthly expiration contracts are available for Bank Nifty Index.
Additionally, Nifty 50 Index options and Nifty Bank Index options will have Three quarterly expiries (Q1 March, Q2 June, Q3 Sept, and Q4 Dec cycle).
Nifty 50 index will also have long-term index option contracts i.e. after the three quarterly expires, next 8 half-yearly expiries (Jun, Dec cycle) will be available for trading.
6.5 Contract Expiry
To overcome the issue of lack of standardisation of forward contracts, futures contracts have an expiry date, on which the futures contract compulsory settlement either in cash or physical delivery has to be done.
In the Indian share market, the expiry of futures contracts are as follows.
For Individual Securities, expiry is on the Last Thursday of the month. If last Thursday of the expiry period is a trading holiday, then the expiry day is the previous trading day.
The Nifty 50 and Nifty Bank indexes have an expiry on the last Thursday of the expiry period. These indexes also have a weekly expiry which is on a Thursday of the trading week.
If the last Thursday is a trading holiday, then the expiry day is the previous trading day in both cases.
For the Nifty financial services index (Finnifty) and Nifty Midcap Select Index, the expiry is on the Last Tuesday of the expiry period.
The Nifty financial services index (Finnifty) also has a weekly expiry period. If last Tuesday of the expiry period is a trading holiday, then the expiry day is the previous trading day.
6.6 Contract Specifications
Contract specifications specify the exact parameters on which future contracts are traded.
Details such as what is the underlying asset, the permitted lot sizes, tick size, trading cycles, expiry date of the contracts, settlement types, etc are mentioned by the exchange and may change from time to time.
6.7 Tick Size/Price Steps
A tick in financial markets refers to the minimum difference between the bid and ask price. Tick sizes are set by the exchange and are mentioned in the contract specifications.
The minimum movement of a futures contract has to be as per the tick size only which means if the tick size is 10 paise, the price minimum price movement of a futures contract can be 10 paise.
6.8 Contract Size and Contract Value
A lot size in F&O trading refers to the minimum number of shares that you can trade in the F&O markets. When trading F&O markets, you can only buy and sell contracts in a minimum of one lot or multiples of the lot size.
For example, the lot size of Nifty is 50 units so you can only trade Nifty in multiples of 50.
The lot size is determined by the exchange on which the futures contracts are traded and may be revised by them from time to time based on their contract value, volatility and various other criteria set by the exchanges.
In F&O markets Contract Value (CV) refers to the contract size multiplied by the current market price:
CV = lot size * Current Market Price (CMP)
6.9 Margin
The account where margins are deposited act as a collateral against the open position in a futures contract.
Margin requirements can range from 10% to 20% based on the asset. Along with the margin, brokers will require daily MTM settlement for profits and losses at the market prices during a day’s close.
Types Of Margins
Initial Margin
It is the margin which an exchange decides which is percentage of the contract value. to account for the possibility of the worst intraday movement.
Margins are a great tool for exchanges for their risk management as they provide a cover against the viable risk of adverse price movements.
Exposure Margin
It is the additional margin than the initial margin which acts as a cushion to manage price risk by an exchange. Typically exposure margin may vary between 3% to 5 % of the contract value in Index Futures and can extend more in case of stock futures which are volatile.
Onto the next one…
VaR Margin
Value At Risk (VaR) is a technique used to estimate the probability of loss of value of an asset or group of assets based on the statistical analysis of historical price trends and volatility.
Stock Exchanges collect VaR Margin (at the time of trade) on an upfront basis because this margin is collected with an intent to cover the largest loss (in %) that may be faced by an investor for his / her shares on open positions on a single day.
A VaR statistic has three components: a time period, a confidence level and a loss amount (or loss percentage). Based on these 3 components , what is the maximum value that an asset or portfolio may lose over the next day is estimated and VaR margin is calculated.
In Indian F&O markets also known as the SPAN Margin is basically a VaRmargin that is set via a system which calculates an array of risk factors to ascertain the potential gains and losses for a contract under varied conditions.
Additional Margin
Additional margin is typically called for by an exchange incase there is extreme volatility in the price of the futures contract.
When markets experiences high volatility , risk increases in trading and hence exchanges demand for additional margin as an hedge against the increased risk.
6.10 Mark to Market ( MTM )
Mark-to-market is a great accounting tool used to record the value of an asset with respect to its current market price. What it simply means that the value of the asset is determined at its closing price of the day.
In India, futures contracts are marked to market on a daily basis at closing prices. This makes it easy for the exchanges to track margin requirements for every trader.
The exchange credits the trader’s margin account if he makes profits and debits the losses. That said, MTM settlement is a notional adjustment.
The final settlement happens only after the expiry of the contract. Exchanges make sure that at all times, traders maintain their margin requirements and MTM settlement is their way to curb the risk of defaults.
6.11 Margin Call
As we discussed before, margins are collateral deposits demanded by stock exchanges to hedge against default risk that may occur if any party fails to honor their obligations.
A margin call is a demand for more money as collateral incase the deposits deplete on account of MTM Losses.
Let’s get back to Mr Nivesh’s example in chapter 2 where he had Rs. 4,00,000 as margin money to buy Reliance futures.
Just when futures price of the stock dropped by 15%, returns on his investments dropped to zero. In such a case, Mr Nivesh has 2 choices.
Choice 1
If he wants to continue holding his long position, he would get a margin call from his broker and then has to replenish his margin account with the appropriate margin requirements
Choice 2
If Mr Nivesh Fails to fulfill the margin call, the broker will liquidate his long position and book his losses and payout to the exchange from his margin account.
6.12 Open Interest
Open interest (OI) is a measure of the flow of money into a F&O market. An open interest is the total number of contracts that are Open Positions, meaning they are yet to be settled.
Increasing open interest indicates new or additional money coming into the market while decreasing open interest indicates outflow of money from the markets.
In the futures market, for every long future contract there has to be a short future contract, that’s the only way exchanges can standardised futures contract and guarantee settlement.
By understanding the Open Interest data along with price action in a particular stock, a trader might be able to interpret whether a stock is on an uptrend or downtrend or a possible reversal in price.
6.13 Price Band
Price bands determine the range within which price of a security can move. Price bands are set by exchanges, to prevent erroneous order entry by market participants.
To illustrate, a 10% price band implies that the security can move +/- 10% of its previous day close price.
The downward revision in the price bands is a daily process whereas upward revision happens bi-monthly and is subject to certain conditions and can only be revised when certain criteria are met.
There are no day minimum/maximum price ranges applicable in the derivatives segment where future contracts are traded.
However, in order to prevent erroneous order entry, operating ranges and day minimum/maximum ranges are kept as below:
- For Index Futures: at 10% of the base price
- For Futures on Individual Securities: at 10% of the base price
- For Index & Stock Options: A contract specific price range based on its delta value is computed and updated on a daily basis
In view of this, orders placed at prices which are beyond the operating ranges would reach the exchange as a price freeze.
6.14 Long Position
Long Position is a buy position. When a buyer expects price to rise in future , he would go long or the buyer is said to have a long position in that asset meaning he buys the asset at current market price and sells when the price increases.
6.15 Short Position
As opposed to a long position (bullish position), a short position is the exact opposite. A short position is referred to as a sell position.
A trader who wants to hedge his price risk against a probable drop in price in the underlying asset can create a sell position in the futures of the same underlying and if the price falls, he would buy it again at a lower price.
Thus, the trader is said to have a short position in that asset. A short position indicates a bearish view and is widely used in futures trading since it allows traders having a bearish bias , to sell the underlying asset first and make money if the value of the contract decreases.
6.16 Open Position
In futures trading, a buyer or a seller speculates their view on the price of the futures contract. Based on their conclusions they develop a bullish or a bearish view.
Once this is developed, traders execute their long or short positions. This is referred to as an Opening of a Position in the markets.
For example, a trader can have the following positions:
- Long: 1 lot Reliance Futures Contract
- Short: 2 lots TCS Futures Contract
- Long: 2 lots ICICI Bank Futures Contract
6.17 Closing a Position
Closing a position refers to setting off or squaring off an open position. While closing a position a trader has to take a contra trade to his original position.
For example, if a trader is long on HDFC Bank Futures Contract, then he has to take a short position in the same HDFC Bank October Futures contract to close his open position. The reverse can be true as well.
| Open Positions | Closing Positons |
|---|---|
|
1 Long HDFC Bank October Futures |
1 Short HDFC Bank October Futures |
|
1 Short Reliance October Futures |
1 Long Reliance October Futures |
In futures trading, a trader can either close an open positon anytime during the contract period or else by default, the position is netted/nullified at expiry by the broker or the exchange.
This is because exchanges have to make sure that for evey buyer there has to be a seller assigned.
6.18 Pay Off Charts
This is a graphical representation of probable profit and loss depending on the settlement price of the futures contract.
A pay off graph can display all the possible outcomes of profit or loss at a given settlement price, breakeven price, etc in one graph.
6.19 LTP
Last Traded Price (LTP) is the price at which the last trade was concluded. LTP , as the name suggests, is the most recent trade between a buyer and seller that has executed. In futures trading, LTP is used by the buyers and the sellers for price discovery and to speculate and place bids.
Chapter 8: What is Futures Expiry?
The date on which the contract period ends is known as the expiry date. After the expiry date, no further trades are allowed in the futures contract.
The expiry date is mentioned in the contract specifications by the exchange.
In Indian F&O markets, stock & index futures contracts expire on the last Thursday of the contract period. Index Future Contracts also have weekly expiry that happens every Thursday of the week.
7.1 What Happens Post-Futures Contract Expiry?
At the Expiry, all market participants in the F&O markets have to opt for physical delivery of the underlying from the exchanges or settle the contracts in cash.
If traders want to continue holding the long or short position, they can offset their trades and roll over their positions, to the next contract period of the same future contract.
Rollovers are done by traders who want to extend their expiry date from the current month to a future date so they can continue to hold their long or short position in a futures contract.
7.2 Possible Actions After Expiry of Futures Contract
There are three possible actions taken after the expiration of contracts.
1. Square-Off & Offset
A trader can square off positions and trigger cash settlement after offsetting their current positions. Liquidation or offsetting of a futures position is a widely used method of exiting an open position.
A trader can square up an open position by taking a reverse trade under the same futures contract, nullifying any obligations under an earlier opened position. Let’s go back to Mr Nivesh’s example.
He bought the futures at the start of the September but didn’t wait for the contract to expire to book Marked to Market (MTM) profits. He sold the same Reliance September futures, thus offsetting his long position by creating this short position.
Since he has booked MTM profits and his positions are nullified, he has neither obligation to purchase the shares nor make payments to the seller for the purchase. 99% of traders square up their positions on the F&O markets, the remaining 1% opt for physical delivery on the expiry of a futures contract.
2. Rollover Open Positions
Rolling over a futures contract position is a solution for traders who want to continue holding positions. Since future contracts expire every month, traders have no option but to carry forward their long or short position to the near month or far month contract.
Rollovers of F&O contracts are executed on days closer to the expiry date. When the futures position rollover takes place, a trader simultaneously executes an offsetting (reversing) trade for the current futures position and opens a new future position with the expiration date in the next contract month.
If the trader initially had a long position in the current month futures contract, he would initiate a short position to offset the current month futures contract. Simultaneously, he’d open a long position in the next month or the far month futures contract.
It’s important to take positions simultaneously so that one can avoid the time gap between the trades. The time gap between the current position closure and the new position opening could result in slippages and a potential loss due to market movements.
Let’s again get back to Mr Nivesh’s example. Say Mr Nivesh strongly believes that the share prices of Reliance Ltd would continue to rise. But the issue is the September series was nearing expiry.
If he wanted to resume his bullish position, he has to take physical delivery of shares and make full payment. This wouldn’t be acceptable to him as he would lose the margin benefit that the futures contract offered.
He decides to roll over his position, by selling the current September future contract and buying the October futures contract and he may continue to do so for the coming months until he achieves his target or hits a stop loss based on his views.
3. Settling the Futures Contract
When a few futures contracts remain open, what happens to them post-expiry? Well, open positions imply that buyers want physical delivery of the underlying asset and the sellers are obligated to deliver the underlying asset.
The exchange plays a key role in such a two-way process (transfer of funds and physical delivery).
Traders can trade in the futures contract and buy & sell anytime during the tenure of the contract period, which is 1 month for stock futures and weekly or monthly for Index Futures.
Traders who do not want the obligation of physical delivery need to square their long or short position by taking a reverse trade to their current open position before the expiry date.
If a trader fails to adhere to the timeline, it is understood that the trader will hold the contract until expiry and shall fulfil all the obligations to the contract as prescribed.
The above-mentioned actions are at the discretion of the trader, who has complete freedom to freely enter and exit (provided he has sufficient margin balance as prescribed by the exchanges) during the contract period of the futures contract.
7.3 Settlement Process in Stock Futures On Expiry
Buyers and sellers for every contract are automatically matched via an electronic matching system set by the exchange, which executes the Pay out and Pay In.
Payout
The exchange takes the money from the margin account of the buyer and gives it to the seller.
Pay In
The exchange takes delivery of the underlying stock from the seller and delivers it to the buyer’s Demat account.
The seller has to deliver the exact quantity of shares mentioned in the contract. Exchanges play a major role after the expiry of futures contracts as they are responsible for clearing and settlement of future contracts’ obligations.
Since they perform the clearing and settlement for all the market participants, the buyers and sellers have to deposit margins, which act as collateral if any of the parties fail to honour the contract obligations thus eliminating counterparty risk.
Chapter 9: How to Trade Futures?
Let’s dive into the trading journey and focus on how are futures traded. Plus, we’ll also answer the question of whether futures trading is profitable for speculators!
Steps to Start Futures Trading
This simple 5-step process will help you initiate the necessary set-up required to trade futures in India.
1. Choosing a Futures Trading Platform
Choosing the right broker for trading is the key to having a great trading experience. Brokers provide a trading platform on which you can execute trades entirely online. A few things to keep in mind before you choose a broker is:
Browsing the Futures Trading Platform: A good platform can ease your trading journey as the execution of trades becomes faster and easier.
Check Customer Service: Great customer service is another very important characteristic while choosing the right broker/platform.
Awesome Features: A platform should have amazing features like creating multiple watchlists, snapshots of future contracts, various charting tools for technical analysis, easy payments and withdrawal systems.
2. Complete Your KYC
Once we choose a broker/trading platform its time to open a trading account. Nowadays opening a trading account is as simple as opening a bank account. All you need to is go through a simple Know Your Client process (KYC).
KYC processes involve submitting personal details like name, age, address proof (Aadhar Card, Passport, etc), contact details, bank details, and income proof. Once submitted and verified your account is ready for trading.
3. Submit Proof of Income
As a part of the KYC process , its necessary to submit proof of income. The latest bank statement of the last 6 months has to be submitted as proof of income , to open a futures trading account.
4. Deposit Margin
Once our trading account is active, you’ll have to deposit margin money. By now, you know that exchanges ask for upfront margin as collateral which is a standard practice to trade in futures.
This margin has to be deposited with the broker who will then credit your trading account with a position limit to your trading account. The broker is responsible to deposit the margin money to the exchange on behalf of the trader and maintain a margin account with the exchange.
5. Start Trading Futures
After depositing margins, you are ready to start trading in futures. Futures trading is a zerosome trade and so a trader needs to understand the risks involved and then focus on trading.
Not to forget, hard earned money is at stake and its important to trade with caution, understand the risks involved and backtest your strategies to create a system that works for you as a trader.
Before we go ahead, remember there is no guaranteed process which can assure success in futures trading. There are a lot of futures traders out there who trade daily – they all may have different strategies and ways of execution.
One important note, there should be special focus on the process of trading since it will be more or less the same for generations to come. However, traders may choose their preferences on which futures they want to trade and where they want to trade.
The Futures Trading Process
Most skilled traders would agree that they follow a set process when it comes to trading any type of futures such as stock futures, currency futures, or commodity futures.
It is the trading system which they develop over time with their experience and follow a set designed pattern for any trading activity which starts with the following.
Lets have a look at a process that a trader can follow before a trader enters in the futures market.
Process of Trading Futures
- Developing a view
- Setting up a trading plan
- Choosing the right instrument for trading
- Selecting the right futures trading platform and tools
- Building the right strategy
- Managing risk
- Exiting or closing a position
Chapter 10: Going Long & Short in Futures Trading
Picture this, you’re watching a prime-time show on a business channel and there’s a panel of traders who are asked to share their views on stock markets in general and share a few trading ideas.
Mr Big Bull, a famous trader known for his bold opinions, says his view is bullish on the automobile sector.
He believes that the demand for electric vehicles is increasing and has an eye on Tata Motors, a market leader in the domain, he is building a long position on Tata Motors futures contracts in anticipation that prices of the underlying stock would go up. The anchor then asks another trader…
Mr Mandiram, a famous short seller, says his view is bearish on the aviation sector.
Mr Mandiram says he is extremely bearish on this sector as crude prices are soaring and hence the fuel costs for airlines will increase.
This may impact their profitability in this quarter results and hence, he wants to go short on the airline stocks.
He feels that falling profits would negatively impact the aviation sector and prices of airline stocks may tumble down from current prices.
You may be wondering what Mr Big Bull and Mr Mandiram are talking about.
- What is a long or short position in futures?
- How are they going to profit from a Bullish or Bearish position?
Traders often use these lingos. These terms are used as a reference to the views they are anticipating.
In any marketplace, there is a constant exchange of assets like commodities or any financial asset like stocks between the buyers and the sellers.
Buyers who buy any asset or a commodity from markets at current market prices are anticipating that the prices will go up and they don’t have to pay higher prices for the same underlying at a future date.
Similarly, sellers sell the assets they own assuming that if they don’t sell now , the prices may fall and they might incur losses.
With an intent to making profits speculate on market trends and they refer the phenomenon of prices going up or down trends, as, a Bull market or a Bear Market.
Interestingly traders are naming these market phases with a unique logic.
Just as a bull swings its horn up in the air from the bottom to the top, a trader is expected to have a bullish position meaning the trader would initiate a buy position, buy at the bottom when the price increases and the trader exits.
Hence in a bull market, a trader is said to have a Bullish View of the markets.
Whereas when traders who think prices will fall down consider the markets to be a bearish market and the trader is said to have a bearish view and is expected to have a bearish position in the markets, simply because a bear grabs his prey by pouncing
Hence futures trading is a constant fight between the Bulls vs Bears!
Step 1 – Building Biases to Develop a View in Markets
There is a very common saying that a trader has to first identify when and what to trade.
But if the why is not clear, meaning, why a trader chooses to buy or sell an underlying asset or a commodity is unclear, then there are chances traders might either book profits early or might even have to face losses.
Building biases is the first step for every trader. Knowing Why a trader wants to buy or sell a commodity or asset forms the base for figuring out how to trade futures.
And how to choose stocks or any underlying asset or commodity for futures trading is the counterpart in futures trading.
Before even deciding to start futures trading, a trader must develop a bias towards the underlying asset.
The bias can be a bullish bias in the underlying asset, meaning the trader is expecting that the prices are likely to be in an uptrend or a bearish bias in the underlying asset, meaning that the trader is expecting a downtrend in prices, in the near future.
Traders can develop such biases based on their understanding of how prices move in trends by studying and using tools like Technical Analysis or factors that affect the price of the underlying commodity or asset known as fundamental analysis or a combination of both.
Biases allow traders to sense direction in price trends and help traders to anticipate a trend in the markets and be able to predict price movements.
Once traders identify a trend in the prices of the underlying asset or commodity there are 2 ways to profit on a futures trade:
- Taking a Buy Position (Long Position) if the trader has a bullish bias
- Taking a Sell Position (Short Position) if the trader has a bearish bias
Let’s take an example of both long positions and short positions in futures. Mr Big Bull and Mr Mandiram have established their biases by studying the macroeconomic factors and fundamental analysis along with some sectorial analysis.
Then, they have identified the stocks and taken their positions accordingly. With the help of Pay Off Graphs. Let’s look at how much profit or loss can they make on their positions.
Pay-Off Graphs of Long Positions and Short Positions
As we’ve discussed in Chapter 6, Pay Off graphs are a great representation of an ongoing position and traders can use them to analyse their trades, set risk and reward ratios and help them in better decision-making.
Let’s take our previous examples of Mr Big Bull and Mr Mandiram and analyse their trades on a Pay Off graph.
1. Pay Off graph of Long Position
Since Mr Big Bull is anticipating a good rally in the automobile sector and has chosen to buy Tata Motors Futures , heres how the pay off graph looks like:
Assuming Mr Bull bulls holds a Long Position in Tata Motors November Futures currently trading at INR 435 , his break even cost is at 435 (plus brokerage & taxes).

If the price increases above his breakeven price , Mr Big Bull makes profits and if the price falls below his cost , he starts making losses. His maximum loss is defined but he has an unlimited profit potential.
2. Pay Off Graph of a Short Position
Mr Mandiram on the other hand has a bearish view on the aviation sector and has identified an airline stock Indigo airlines for short selling. Here’s how his payoff graph looks like:

Since Mr Mandiram has a short position in Indigo Airlies November Futures at 1776 (plus brokerages and taxes). His profits are defined as the maximum Indigo futures that can go down to zero but has an unlimited loss potential if the prices go up.
Chapter 11: How to Choose the Right Underlying for Futures
After you’ve established a view, bullish or bearish – it’s time to design a trading plan and choose the right financial instruments to be able to execute a trade. In this chapter we will walk you through how to develop a trading plan and then how to choose stocks for futures trading.
Step 2 – Developing a Trading Plan
As a futures trader, its good to have a trading plan before even thinking about trading. A trading plan can help you have a disciplined approach to speculating.
A trading plan is a detailed Plan of Action which defines a trader’s DNA and supports a trader through thick and thin throughout the journey of futures trading.
Consider a trading plan as a framework under which a trader designs his trading process and establishes certain ground rules and defines all the possible risk and reward for trading.
A trading plan for a trader should have the 4 “S” as a framework. This framework can work not only for futures trading but for all types of trading.
1. Structure
A trading plan for futures trading should be drafted in a way that explains the entire process of trading, right from how to choose a stock for futures trading to executing a trade. This also includes defining the entry and exit points and set targets and stop losses.
A. Study
Personal research using tools like fundamental or technical analysis or even observations backed by data crunching can help you develop and validate your conviction in the trading setup.
A study refers to an in-depth analysis of the underlying asset with respect to identifying overall trends in the sector/industry.
It also extends to analysing macroeconomic factors and its impact on the price movements in the futures contract with changes in the demand and supply of the underlying asset and any other aspect which needs some research.
This research can immensely benefit the selection of stocks , commodities or any other underlying asset for trading.
2. Strategy
Well after you have figured out your Structure and are done with your study , the next step is identifying a trading strategy that may work the best for you. There may be a thousand different strategies that may be making money.
But to become a successful and profitable trader, you must identify the strategy that suits your trading DNA. In order to identify a successful strategy, a trader must understand when the strategy works and when it doesn’t.
Holding period of a contract is yet another crucial factor that helps in choosing the right financial instrument (future contracts) since its important to define a measured holding period in order to choose the right contract in futures trading.
A strategy has 5 main parts to it.
- Timing: When a given strategy works and when it doesn't.
- Choice: Choosing the right contract for your expected holding period.
- Plan of Action: How to execute trades while implementing a strategy.
- Defining Risk-Reward: Understanding the potential P&L post-execution.
- Backtesting: To define the success rate of a strategy.
Pointer
You should choose a strategy that is best for you and suits your trading style, and is a best fit in your structure, Most importantly, it must designed by yourself. Blindly following someone else’s strategy could be a disaster.
3. Spectacular Execution
After doing all the hard work of designing a structure, in-depth study and analysis and then identifying the best strategy that works for you, all you need to do is master the art of execution.
It is preferable to have a plan for execution before you start trading while developing your trading plan.
The execution plan may consist of the selection of financial instruments for trading, choosing a broker/platform for trading, identifying capital adequacy and estimating margin requirements for deploying your strategies.
Now we know how to make a trading plan the next step is to know how to choose stocks for futures trading and the same logic can be applied to selecting various other underlying assets, commodities and currencies for futures trading.
Step 3: Choosing the right instrument for trading.
You have learnt how to develop biases for assets or commodities and also learnt how to develop a trading plan. The next move is the select the right instrument for trading futures in any asset class you decide to trade.
Consider financial instruments as tools for trading and a trader needs to understand which instrument has to be chosen to trade based on various parameters like the holding period of the trade, risk tolerance ability of a trader, capital adequacy for margin requirements and mtm settlement, for a trader to execute/deploy a strategy.
Once these parameters are fulfilled, it becomes much easier to choose the right instrument for trading.
Let’s get back to Mr Nivesh’s example from chapter 2 which will help you decide how to choose the right financial instrument for trading. Mr Nivesh was bullish on the company Reliance Ltd had 2 choices.
Choice 1
He could buy shares of Reliance listed on the Exchange in the cash markets, worth 10 lakh.
Choice 2
He could buy Reliance futures from the futures market just by fulfilling the margin requirements.
How could he decide which financial instrument cash or derivatives was a good choice for him. Here are some parameters Mr Nivesh must have considered.
If he chooses option 1, he gets the shares credited to him in his demat and he has the flexibility that he can hold the shares for a longer period and sell them whenever his target is achieved.
But if he chooses option 2, no doubt his returns will be maximized but his risk also increases since he is taking a leveraged position and has to manage his capital adequacy for any margin calls if the prices start falling.
Since the futures will expire at the end of the month, he has to either close his position or roll over which can be complicated for him to manage.
As long as Mr Nivesh is aware and is willing to accept the fact that taking a trade in futures is a high-risk high return trade, he should definitely go for choice no 2.
But if Mr Nivesh is risk-averse and is willing to hold the stock beyond the holding period decided by him if things go south, then taking a position in cash markets is a better choice for him.
While choosing the financial instruments a trader also has to make sure that the right asset class is selected while taking the trade. Since an exchange has thousands of stocks listed, chances of error are much higher during execution.
Once a trader has decided on the financial instrument that is to be traded, there are multiple ways to find a price quote for trading.
The best is to find quotes and probably the easiest is to look on a broker’s app which displays everything such as contracts price quotes (bid and ask, day high day low, OHLC, volumes, OI, margins, etc) in a single quote window within the same app.
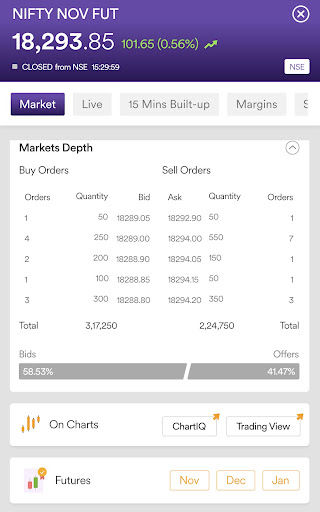
All a trader has to do is to make sure that the right instrument symbol is selected while the order is being punched online.
If online trading is not for you, some brokers also offer traders services wherein they can also call the brokers office and can place the trade on traders behalf on their platforms which connect to the exchanges.

Chapter 12: Tools for Futures Trading
We have discussed concepts that will help you to plan and provide an overall map for navigation in building a flow for futures trading. And now, let’s fasten your seatbelt as from this chapter onwards, we shall be focussing on the process of executing the trades.
Step 4: Tools for the Execution of Futures Trades
Traders deploy their strategies based the research that goes into their planning and with the help of future trading tools, traders can quickly refer to their findings, especially during live market hours.
Some of the best future trading platforms may have sophisticated technical analysis software or charting tools for traders. With just a click of a button, these tools help identify trading opportunities under their desired trading setup. Amazing, isn’t it?
With the advent of technology, nothing seems impossible and for traders, these tools have become an integral part of their trading system.Before discussing these various hybrid tools, a quick look at the modern tools made available to traders by brokers these days which enable traders to directly trade online on applications.
Earlier, futures trading took place at brokers’ premises, where these brokers had trading terminals on which trades were executed. A trader either used to go to a broker’s office or place the trade over a phone call.
The broker then punched the trades on the terminals which were connected to exchanges and bids were matched on these terminals. Things have changed now.
Brokers now develop trading apps that enable traders to place orders directly on the application and bids are matched online. In fact, a trader can use the app or platform from the comfort of their home.
These apps also allow traders to track the positions on a real-time basis and provide various statistical data points like open high low closing prices, technical analysis indicators many other analytical tools which a trader can use to track market movements.
All this with just a click of a button on a computer or laptop or even on a smartphone. This gives traders the freedom to operate from any location desired and allows a trade to never miss a trading opportunity on a real time basis.
Let’s get back to step 4 – Execution of trades using futures trading tools.
As we learnt that traders these days have all the latest future trading tools on smart applications and some brokers offer these at a upfront cost or subscription based model, besides the regular brokerage charged on trades.
Lets look at some of the tools which help can help traders in futures trading.
Live and Historical Charts for Technical Analysis Study
Trading apps are equipped with price charts which are a graphical representation of data showing the price movements of futures.
Typically, charts depict the price history in the form of a graph, showcased in different types of styles like bar charts, line charts, Japanese candlesticks, etc.
Professional future contract traders like to study and keep track of the price movements of the underlying asset or futures contracts (or both) to spot trading opportunities due to changes in price.
Charts make it easier to analyze price movements in multiple time frames which allows traders to understand and anticipate noticeable patterns in price movements. When it comes to technical analysis, it is believed that “history repeats itself”.
If any pattern is identified with the help of previous data on charts, traders can backtest their trading strategy to decide their risk to reward ratio before taking a trade.
Since these charts are being prepared tick by tick these days, it’s a bonus for every trader who trades in any segment of the market..
Technical Analysis Tools & Indicators
As mentioned earlier , professional traders use charts to monitor price movements. This study and monitoring of price movements on charts is known as technical analysis.
Traders analyze price movements with the use of data on charts and predict probable outcomes based on patterns discovered in the past, by studying price movements in the underlying assets.
On the flipside, charts that display only historical prices and limit traders with just the analysis of price movements, isnt it ? But what if we told you charts have much more to offer.
A genre of traders use charts along with technical analysis indicators have emerged, referring them as technical analysts. They can use these indicators to forecast future price movements.
Some of the examples of widely used technical indicators are Relative Strength Index (RSI), Bollinger Bands , moving average convergence divergence (MACD) and many more that help active traders to identify entry and exit points in the shorter term.
Traders inherently have the attribute of speculating and tools like technical indicators help them to identify trends in the markets and also time their entry and exit points on the charts.
Like other analytical tools, technical analysis requires a disciplined and a systematic approach minimising the impact of human emotions and any biases.
Many futures traders use technical research along with other analytical approaches, such as quantitative, fundamental, and macroeconomic methods to develop their trading plan and add depth to their trading career.
Popular technical indicators used by traders which can be directly applied live charts of future contracts that can indicate BUY OR SELL signals based on a defined logic that these indicators imply.
Many apps enable traders to use technical indicators on real-time charts and based on these indicators, traders decide when to trade and also define their risk and reward ratios. Dhan, for example, helps you access 100+ technical indicators on charts for free!
Besides technical indicators, features like multiple time frame analysis, open interest data (how many contracts are added in a particular futures contract), can be used by traders who are looking to make sustainable profits in the futures market.
This brings us to the end of this chapter. In the next chapter we shall discuss some widely used futures trading strategies featuring all the steps we have discussed until here.
Chapter 13: Futures Trading Strategies
Futures are one of the sophisticated financial instruments and quite exciting to trade because of their potential for magnified gains considering the role of leverage coming into play in futures trading.
Since futures trading is a zero sum game, meaning if one trader is making profits, theres always a counterparty that is losing money. Thus, a trader has to understand the risk involved and based on the risk profile develop a trading setup.
In chapter 8, we discussed the Steps to Start Futures Trading and also discussed the trading process elaborately in chapters 10 and 11.
And before we go ahead to discuss futures trading strategies, here’s a quick recap of the process which you can refer to as a trading guide.
Process for Futures Trading:
- Developing a view
- Setting up a trading plan
- Choosing the right financial instrument
- Tools for futures trading
- Selecting the right strategy
- Exiting or Closing a position
- Risk management
Hopefully, you now know the first 4 steps in the process well!
The next stage will empower you to execute your futures trade. Let’s get the party started, starting with how to execute trades with the most popular futures trading strategies.
Step 5: Execution of Trades – Selecting the Right Strategy
Besides discussing strategies lets also quantify the risks involved in these strategies along with some examples so that your learning curve shortens and skyrocket your futures trading journey.
What to Remember When Selecting a Futures Trading Strategy
A few things traders need to ask themselves before choosing futures trading strategies. These questions help traders to take mindful trades and will eliminate chances of panic square ups of trades due to volatility.
What is the strategy?
When to deploy a strategy?
How to deploy the strategy?
Risks involved vs potential profit estimation via payoff graphs
A disclaimer here is that every trader is unique in terms of parameters such as risk taking ability, capital deployed and also, there may be a vast difference in their trading styles while trading futures.
It’s important to understand that simply copying someone’s trading style can do more harm than good. Thus, please DYOR (do your own research) before entering into the futures market.
Popular Futures Trading Strategies
Strategies are a blessing in disguise for any form of trading as they ensure a disciplined and streamlined process for execution of trades.
Strategies enable traders to follow a set pattern for trading and professional traders focus on optimising some of the popular trading strategies according their own preference.
Some tweaking is done in the process of execution but the structure of the underlying defined logic remains the same. Here are some of the most popular futures trading strategies for your reference.
1. Going Long
- Time Period: Intraday or Positional
- Who: A trader having a bullish view on the underlying asset
About Going Long
This is one of the most basic strategies in futures trading wherein, a trader has a long position in a futures contract. This strategy is the most straightforward strategy wherein a traders buys a future contract, based on the assumption that the prices of the underlying asset will increase on or before expiration of the contract.
How to Use This Strategy?
As we saw in the case of Mr Niveshs example in chapter 1, he was bullish on Reliance Industries Ltd in the cash markets and chose to go long in Reliance futures contract.
His assumption was that share prices of Reliance industries in the spot markets may increase and so he decided to go long and bought Reliance futures contract.
The logic is simple, if spot prices of Reliance industries increases, its futures price will also have to increase. Thus, going long would work the best for Mr Nivesh in this case.
Risks Involved in This Strategy
The potential profit of this strategy is unlimited but loss is limited to the extent of the price going to zero from the purchase price.
Again coming back to Mr Nivesh’s example, he understood the risk involved in futures trading and was considering to buy and hold Reliance futures either until expiry or he has the option to close his position before expiry (a detailed chapter #15, is on how to exit a futures trade).
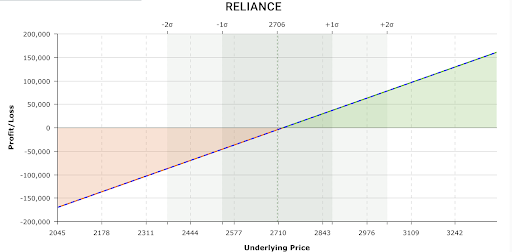
Conclusion
A simple buy and hold strategy – Going long is practically used by traders who want to buy and hold an underlying asset for short term.
Seasoned traders use skills such as fundamental analysis of the underlying asset, price action analysis or using technical indicators on charts, and more to determine entry and exit points.
The above practice, enhances the chance of success in this strategy and help a futures trader to minimise risk and maximise returns on investments with a disciplined approach.
2. Going Short
- Strategy: Going Short
- Time Period: Intraday or Positional
About Going Short
The flipside of going long is going short. Another widely used strategy wherein a trader is selling a futures contract first and then buy them later on or before expiration of those contracts. A trader sells a futures contract of the underlying asset in which a decrease in the price is expected on or before expiration.
When to Use It?
A trader having a bearish view of the underlying asset and is expecting a decrease in the price of that underlying asset, can use this strategy.
How to Use This Strategy?
Going short is the best way to make money in falling markets. Ideally, when a trader is anticipating a fall in prices of an underlying asset, he can sell the futures contract of the underlying asset and then buy those contracts at lower prices on or before expiry.
Going back to the example of Mr Mandiram , where he was bearish on the aviation sector as fuel prices were increasing.
Mr Mandiram could decide to go short on any of the listed airline stock assuming that rising fuel prices could impact the profitability of the airlines negatively impacting their share prices and causing the prices to fall in the spot markets.
Hence going short by selling futures of that airline stock would be a great way to fulfil Mr Mandiram’s speculation of the bearish bias.
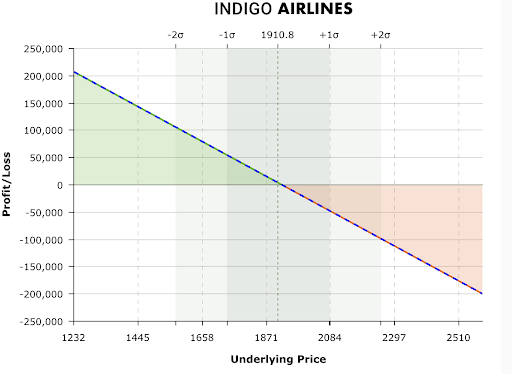
Risks involved?
The potential profit of this strategy is unlimited but loss is limited to the extent of the price going to zero from the purchase price.
Conclusion
Going short involves selling futures contracts with a view that the underlying’s price will fall. It is a bearish strategy that allows you to earn potential gains in falling markets.
However, it’s important to note that while the profit potential is unlimited, the risk is limited to the asset’s price going to zero from the purchase price.
This strategy, as shown by Mr. Mandiram’s bearish stance on the aviation sector, can be a valuable tool for speculators.
3. Bull Calendar Spreads
- Strategy – Going Long and Going Short
- Time Period -Intraday or Positional
About Bull Calendar Spreads
A calendar spread is a strategy wherein a trader is buying and selling contracts on the same underlying asset but with different expirations. In a bull calendar spread, the trader goes long in a short-term contract and goes short in a long-term contract.
Calendar spreads are used by traders to reduce the risk in a position due to volatility the underlying asset.
The goal of this futures trading strategy is to exploit the potential of an arbitrage due to the time decay in the pricing of futures.
Futures pricing involve cost to carry, the further the expiry more would be the cost for carrying the futures contract until expiry.
But when the current month contract is nearing to expiry, futures price tapers towards the spot price and at expiry futures is equal to the spot price.
The cost of carry of the near and the far month contracts also loose some time value but it may continue to trade at the premium as per the logic of cost of carry.
A bull calendar spread is therefore an opportunity for the traders to create a spread by buying a current month contract and selling the near month or the far month contract. Let’s take an example by first looking at a summary of Reliance Future Contracts available for trading.
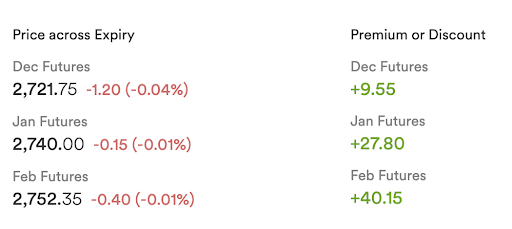
Let’s Assume Mr Nivesh spots a calendar spread opportunity. The December series has just started and our SuperTrader Mr Nivesh is still bullish on Reliance. But he wants to take less risk this time and is looking to hold is bullish view until January.
Thus, he decides to create a bull calendar spread by going long in December Futures and Going Short in Jan Futures. This is what his payoff graph looks like.
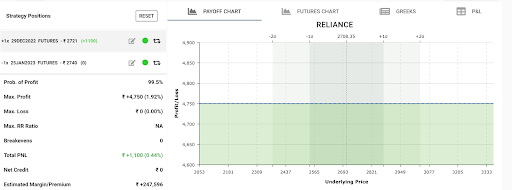
The spread value at the point of entry is currently at 19 points. Here’s how this strategy works.
| Particulars | Day 1 Closing MTM | Day 2 Closing MTM | Day 3 Closing MTM | Expiry Closing MTM | Net P&L at Expiry |
|---|---|---|---|---|---|
|
Long Reliance Dec Futures |
2,721 |
2,740 |
2,720 |
2,750 |
+29 |
|
Short Reliance Jan Futures
|
2,740 |
2,764 |
2,740 |
2,765 |
-25 |
|
Spread |
19 |
+24 |
+20 |
-15 |
+4 |
|
Lot Size
|
250 |
250 |
250 |
250 |
250 |
|
MTM |
=19*250
=4,750
(point of entry)
|
=24*250
=6,000 |
=20*250
=5,000
|
=-15*250
=3,750 |
=4*250
=1,000
|
|
Margin Required |
2,50,000 |
2,50,000 |
2,50,000 |
2,50,000 |
2,50,000 |
|
Profit/Loss (in Rs) |
0 |
+1,250 |
+250 |
-1,000 |
+1,000 |
|
ROI % on Deployed Capital
|
0 |
+0.5% |
+0.1% |
-0.4% |
+0.4% |
And now…
| P&L Days | Net P&L |
|---|---|
|
Day 1 |
+1,250 |
|
Day 2 |
+250 |
|
Day 3
|
-1,000 |
|
Expiry |
+1,000 |
|
Net Gain |
+ 1,500 (0.5%) |
Considering day 1 is the point of entry for the bull calendar spread. On day 2, due to demand and supply anomaly of the spread (the difference between the current month and the next month futures pricing), Mr Nivesh makes a profit of 0.5% which is credited to his margin account.
This goes on until expiry day and since futures settlement happen daily, the difference between the spreads will be either credited or debited to the margin account.
Yes, there are times when this parity between spot and futures changes and the spread might contract. But at expiry there’s a net gain 0.5%.
When to Use It?
A bull calendar spread is used when a trader has a bullish view and is expecting the price of the underlying asset to increase in the short term but wants to hedge his position by creating a spread. An assumption here should be that the spread has to widen or from the point of entry.
Risks Involved?
Although this strategy is almost risk free only if the basic assumption that the demand for stock will increase and therefore , the spread might increase.
However, the risk here is that if the demand for the stock decreases in the future, the spread is most likely to shrink.
What’s more, if the long term contract prices decreases and short term prices remains the same or decreases lesser, spreads may shrink and there may be negative spread which may arise due to demand and supply mismatch, ultimately hampering the ROIs in this strategy.
Conclusion
The bull calendar spread offers a unique approach for traders with a bullish outlook in the short term while seeking to hedge their position.
This strategy relies heavily on the daily fluctuations in the spread between current and next-month futures pricing. As a result, traders can make profits as seen in Mr. Nivesh’s 0.5% gain.
The continuous daily settlement ensures that gains or losses are consistently credited or debited to the margin account until expiry, resulting in a net gain of 0.5%.
While this strategy is relatively low-risk under the assumption of increasing demand for the underlying asset, there is the potential for losses if demand decreases because the spread will begin shrink.
4. Bear Calendar Spreads
- Strategy – Going short and Going Long
- Time Period -Intraday or Positional
About Bear Calendar Spreads
A bear calendar spread has the trader buying and selling contracts on the same underlying asset but with different expirations. The trader sells a short-term contract and buys the long-term contract of the same underlying asset. This strategy works on the notion the current future contract is trading at a premium to near month future contract.
And as we know , for any arbitrage opportunity , a trader must buy in the market where the price is cheaper and sell in the markets where the price is higher.
Similar to the bull calendar spread, a bear spread works when the current month future price is trading at a discount to the futures – Lets take the same example of Reliance but this time with a different prices.
| Particulars | Day 1 Closing MTM | Day 2 Closing MTM | Day 3 Closing MTM | Expiry Closing MTM | Net P&L at Expiry |
|---|---|---|---|---|---|
|
Short Reliance Dec Futures |
2,740 |
2,764 |
2,720 |
2,750 |
-20
|
|
Long Reliance Jan Futures
|
2,721 |
2,740 |
2,730 |
2,774 |
+53 |
|
Spread |
19 |
-5 |
-34 |
+14 |
+33 |
|
Lot Size
|
250 |
250 |
250 |
250 |
250 |
|
MTM |
=19*250
=4,750
(point of entry)
|
=-5*250
=-1,000 |
=-34*250
=-8,500
|
=+14*250
=-2,500
|
=33*250
=250
|
|
Margin Required |
2,50,000 |
2,50,000 |
2,50,000 |
2,50,000 |
2,50,000 |
|
Profit/Loss (in Rs) |
0 |
-1,000
|
-8,500
|
+3,500
|
+8,250
|
|
ROI % on Deployed Capital
|
0 |
-0.4%
|
-3.4%
|
+1.4%
|
+3.3%
|
And now…
| P&L Days | Net P&L |
|---|---|
|
Day 1 |
-1,000
|
|
Day 2 |
-8,500
|
|
Day 3
|
+3,500 |
|
Expiry |
+8,250 |
|
Net Gain |
+2,250 (0.9%) |
Notice that the current month futures price is trading at a discount and this discount prevails until expiry Hence a trader has to short December month contract and go long on Jan futures of Reliance to create a bear spread.
When to Use It?
A bear calender spread is used when a trader has a bullish view on the underlying asset in the short term but finds that the current month futures is trading at a discount to the near month futures contract , spotting an arbitrage oppportnity.
An assumption here should be that the spread has to widen or from the point of entry. For the spread to widen , the current month contract prices should decrease in value and the next month contract should increase in value.
Risks Involved?
Although this strategy is almost risk free similar to a bull calender spread, the risk here is that if the demand for the stock increases in the in the current month, the spread is most likely to shrink, ultimately hampering the ROIs in this strategy.
Conclusion
The bear calendar spread strategy is useful for traders who have a short-term bullish view on an underlying asset when the current month’s futures price is trading at a discount compared to the near-month contract.
By shorting the current month contract and going long on the next month’s contract, traders can create this bear spread to take advantage of arbitrage.
While this approach is relatively low-risk, similar to a bull calendar spread, it’s important to note that if demand for the stock rises in the current month, the spread may contract, potentially impacting the overall return on investment.
Spotting Spread Opportunities
To spot spread opportunites, a mathematical model can also be derived wherein one can calculate the mean of the spreads by subtracting the closing prices of near month prices from the current month prices.
This is because if everything remains the same , futures price of Near month contract is always higher than the previous month contract due to the cost of carry factor.
Then derive the Standard deviation and add and subtract it from the mean to define a range .If the spread is above either the defined upper or lower range , there will be a spread opportunity.
A bull calendar spread becomes profitable only when the upper end of the range is breached. SImilarly a bear calendar spread becomes profitable when the lower end of the range is breached.
The logic here is that one has to buy in the cheaper market and sell where the prices are higher based on this logic spreads can be created.
Chapter 14: How to Use Futures for Hedging?
What comes to your mind when you hear the word Hedging? If, “protection against any type of risk” is your answer, then your on track and this is exactly what we shall be discussing in this chapter.
Whether we like it or not , we all are prone to some kind of risks around us.
Our day-to-day business activities like buying and selling of goods and services or assets and commodities inherently has market risk involved, as price movements can be random due to demand and supply factors.
So how does businesses ensure that they remain profitable inspite of these fluctuations leading to price risks?
Most businesses try and mitigate their price risk by Hedging using derivatives.
As seen in the example in chapter 1 , Mr Nivesh the Bakery owner used derivatives to hedge his price risk for his raw material supply so that he is able to maintain the bottom line of his business.
Similarly, Mr Kisaan also used derivatives to get fair value of his produce ahead of time that too before even harvesting his crops. Thus creating a win win for both parties – the buyer and the seller.
In today’s world, hedging is almost a part of managing business activities by most of the major corporations and business houses.
In fact, with the development of futures market across the world , even small businesses have also started using futures to hedge their losses against adverse price movements impacting their profitability.
Hedging in the Futures Market
Futures market is one of the most rewarding markets for traders or investors as they enjoy the benefit of financial leverage, ulltimately helping them generate higher ROIs.
But what most traders or investors tend to ignore is the risk associated to using leverage in futures trading. Well the risk of leverage is real and its inevitable to completely avoid it.
However, risk can be managed through Hedging. Lets understand How can we use hedging as a tool to manage risk in futures trading with an example. This example is based on how to hedge your portfolio against adverse price movements.
Meet Mr Chintamani, a risk-averse cash market investor who is fairly conservative towards trading/investing and is constantly looking for ways to manage risk.
With constant news around of having a global recession, he’s worried that his portfolio will go in the red. Now Mr Chintamani has 3 choices.
Choice 1
He can either wait for the global recession to cause a market crash and hope that the market bounces back.
Choice 2
Completely exit the market by selling all the stocks he has in his portfolio and holding onto cash, waiting to re-enter the markets at lower levels.
Both are logical solutions to his problem but has their own consequences. If Mr Chintamani opts for the 1st choice, it may take years for the markets to recover and the drawdown on his investments may push him towards panic selling and ultimately may have to face losses.
If he opts for choice no 2 and what if the market scenario changes overnight? Recession fear vanishes and global markets witness a Bull Run.
Mr Chintamani, who was waiting for this bull run for years now, witnesses the opportunity of a lifetime just pass by right in front of eyes.
FOMO (Fear Of Missing Out) is bound to hit him hard, and mind you, there is nothing more dangerous than investing out of FOMO.
The thought of FOMO puts Mr Chintamani to do some research and find out a way wherein he can continue to hold his portfolio and find a hassle-free way to stay invested and to avoid any opportunity loss, due to non-participation in the markets.
And that’s when he discovers the concept of hedging with futures trading which gave him a 3rd choice.
During his research, he noticed that he had the option to remain invested and didn’t have to worry about the fall in his portfolio. Sounds amazing isn’t it?
Choice 3
Completely exit the market by selling all the stocks he has in his portfolio and holding onto cash, waiting to re-enter the markets at lower levels.
Mr Chintamani was blown away by the fact that he could protect his overall investments by hedging and immediately started to dig deeper into the possibilities.
The question now comes to mind is How can “going short” on Stocks or Nifty 50 be a hedge against the portfolio of Mr Chintamani?
The answer is simple, assuming that the economy is headed for recession is true, naturally, all the people who own stocks will start selling their existing holdings in anticipation that they shall repurchase them later when the dust settles.
Instead of selling the stocks that Mr Chintamani owns in his cash market portfolio, he can sell futures of the underlying cash market stocks that he owns.
Since we know the fact that, if the underlying stock prices decreases, its future contract value will also decrease and so Mr Chintamani will hedge his portfolio by selling stock futures.
Now, what if Mr Chintamani holds stocks which are not traded in the futures market?
He still has an option of selling the Nifty50 Futures which is a leading index that comprises of top 50 stocks by market capitalisation across all the sectors. Naturally, if a recession hits hard, indeed it will affect all the companies across all the sectors and hence the index will also fall.
Mr Chintamani can hedge by going short on Nifty50 Futures and even though his cash market portfolio is falling , he will benefit from the short Nifty position creating a hedge against the fall in value of his portfolio.
Hedging With Futures: How to Create a Hedge Against a Portfolio
With the example of Chintamani, we learnt hedging with futures is possible both in individual stock futures or hedge against the overall portfolio. However, there’s one limitation which arises due to the standardisation futures markets traded on stock exchanges.
Remember we have discussed that in the F&O markets, futures contract are traded in fixed lot sizes. Hence, the concept of a perfect hedge is a little difficult to find.
Let’s assume that Mr Chintamani owns a diversified portfolio of 10 stocks and the total portfolio value is INR 10 lakhs.
To create a hedge for his portfolio against selling Index futures, Mr Chintamani needs to figure out the following factors which can help him create a full or partial hedge.
- Correlation of stocks with respect to the portfolio
- What is the beta of the portfolio versus the index
We’ll help you understand both.
Correlation
In the world of stock markets, correlation refers to as the comparison price movements between assets or commodities. It helps us understand the mutual relation between two things.
If the prices of one asset moves in the same direction as the other asset , they are said to have a positive correlation.
If the prices of both the assets move in the opposite direction , the correlation is negative.
So correlation will help Mr Chintamani choose the right asset for hedging.
But finding out the correlation isnt just isnt enough for Mr Chintamani to derive a full or partial hedge against the portfolio.
Correlation will help him, filter the asset needed to choose for hedging in case of cash stocks to stock futures.
But to find out how a full or partial hedge between cash stocks and index futures , another variable know as beta has to be considered.
Beta
Beta is the calculation is used to help investors understand whether a stock moves in the same direction as the rest of the market. It simply provides insights into how volatile a stock is relative to the rest of the market. Beta effectively describes the price movements of a stock’s returns, as it responds to swings in the market.
Beta will help Mr Chintamani identify how much the overall portfolio might decrease compared to the decrease in the index.
- Beta = 1: Fall is almost equal in stock portfolio and index.
- Beta < 1: Stock portfolio will decrease lesser than the index.
- Beta > 1: Stock portfolio will decrease more than the index.
Mr Chintamani can either apply these mathermatical model to calculate a perfect hedge ratio which is required or he can use this hack.
Let’s say the beta of his cash portfolio is almost equal to 1. With a basic observation, Mr Chintamani arrives at an approximation that if the markets declines about 1% his portfolio value also declines by 1%.
Hedge Trade
Portfolio Value = 10 lacs
Hedge Trade = 1 lot Nifty December Futures Short @ 18000
Based on the beta, if Nifty 50 falls by 1%, Mr Chintamani’s portfolio will also fall by 1%.
Lets compare the profit and loss of the above trade and see how this trade will act as an hedge for Mr Chintamani.
1% Fall in Value
Cash portfolio = 10 lacs * -1% = -10,000
1 lot short Nifty December Futures = 18000*-1%*50 (shares in 1 lot) = +9000
As you can see that with the hedge trade taken Mr Chintamani has made a 1% gain against the loss on the overall cash portfolio creating a good hedge for himself with the down move.
However, the hedge is not perfect and thats because of the fact that futures are traded in fixed lot sizes but more or less his portfolio is almost saved from the damage.
Hedging in futures market is a tool used by traders for risk management. Some of the most successful and profitable traders have some kind of a risk management system in place and this is exactly what we shall be discussing in the next chapter.
Chapter 15: Risk Management in Futures Trading
Futures Trading is one of the most lucrative markets but has its own challenges. After facing streaks of losses, most traders quit. Traders often lose because they ignore the risks involved in futures trader.
New entrants in the futures market tend to focus on developing skills to enhance their ability to time the markets by trying to hunt for accurate entries and exit points, rather than an understanding of the concept of risk and risk management.
This is one of the main reasons why most traders end their trading career in a very short span, as they end up losing more than they could afford.
Moral of the story here is, to be a pro trader in the futures market , indeed you need to master the art of trading but to become a successful and a profitable trader , you have to learn the art of risk management and this is exactly what we shall be discussing in this chapter.
Risk Management in Futures Trading
Imagine a scenario where a pro futures trader all set to start trading and when the market opens, his stock future open long positions have tanked more than 20% due to an unfortunate fall in the overall markets.
A few days back, his trader friends had warned him about his over leveraged positions in volatile market conditions and suggested that such an aggressive style of trading in futures could be lethal in such choppy markets.
Recalling the advice of his trader friends, he takes a minute to get out of this dreadful picture and suddenly he gets a call from his broker.
It’s a margin call said the broker and is asking for additional margin money which needs deposited right away or else the broker will square up all his loss making open positions before the expiry of those future contracts.
The fall has led to a complete wipeout of his capital.
What’s worse, he has deployed his entire capital on the trades executed and does not have a dime more left to give as margin money.
As horrifying it may sound, this is the exact reason why most traders have to quit futures trading as they don’t have a risk management system in place.
Remember our discussion on how “leverage is a double-edged sword” and as the same sword that can used for wealth creation, has the ability to wipe out practically the entire capital deployed for futures trading as we saw in the above example.
Could this situation of a complete wipeout of capital be avoided? Could Mr Pro trader escape the margin call if he had noted the most genuine advice given by his friends?
The answer to these questions lies in Risk Management and thats the next step in the process of futures trading.
Step 6: Risk Management in Futures Trading
This is the most crucial step in the process of futures trading and has to be given supreme priority by each and every trader in the futures market.
A good risk management planning can save a trader from having a rough day at markets.
Here’s the most simplest and easy to implement plan for risk management which can help you to become better at managing risk. Before we focus on an effective risk management plan.
Consider these points as the pillars of risk management. A disclaimer here is that some element of risk will always be there in futures trading.
There’s no holy grail that will save you 100% from risk but with time and practise, one can definitely master the art of managing risk to get rewarded from futures trading.
Understanding Risk
The most important aspect of risk management is what if the view goes wrong? A trader who cannot quantify the defined risk versus the expected returns is believed to have no understanding of risk management.
Whenever a trader develops a view for any asset or commodity, bullish or bearish, the next question that should be answered is if the view goes wrong, what % of loss is acceptable to the trader?
Since we know that highly leveraged positions has the ability to amplify gains but also has has the power to destroy the capital base of a trader and therefore a trader always has to take calculated risks on every trade and work out on a defined risk to reward ratio.
Always remember since leverage is an integral part of futures trading , money management skills of every trader is constantly tested, especially during volatile price fluctuations in the markets.
Money Management to Avoid Margin Calls
The easiest way to avoid a margin call is , to follow a risk management system which is great money management.
A trading plan should clearly define what % of capital has to be deployed as a margin for trade or trades in the futures market before every single time a trader takes positions.
It is always recommended to keep some balance money as cash or cash equivalents as a backup, so that any sudden margin calls can be taken care of.
Never Overtrade!
Overtrading occurs when you have too many open positions or risk a disproportionate amount of capital on a single trade as we saw in our example of Mr pro trader who had exposed his entire portfolio to undue risk.
To avoid over-trading, a trader must adhere to a trading plan and exercise strict discipline by sticking on to a pre-planned strategy.
Markets are unpredictable, full of surprises and thus every trader is exposed to market risk during trading.
A trader has to restrict its position sizing based on the risk appetite defined in the trading plan.
Over exposure in volatile markets is the most dangerous. To eliminate over trading a trader pays greater attention to position sizing.
Capital Protection Vs Profits
By now you must be aware of all the potential risks in futures trading. Capital protection in futures trading refers to a strategy or investment vehicle designed to protect a trader’s initial capital investment.
For every trader , the goal of capital protection should be to minimize the potential for losses and maximize the potential for gains.
Profits will follow but the main aim of a trader should be to protect his capital so that a trader survives the volatility and is able to continue trading.
Price discounts everything and everything is priced in the pricing of futures.
This is the golden rule for every trading.
Price discounts everything, whether any unusual demand supply mismatch due to any event or any uncertainty about to hit the markets smart traders start building positions based on the anticipation of price movements in a particular direction by the outcome of such events.
And the best part, by using technical analysis which is the study of price action, traders can spot trading opportunities and execute entry and exit points based on a risk management plan.
Hence, big moves can be anticipated and potential defined losses against those adverse price movements.
The above-discussed concepts forms the pillars of an effective risk management plan for every trader.
And how exactly can a risk management strategy be executed?
Here are a few steps that can help you draft and execute an effective risk management strategy.
Guide for Risk Management in Futures Trading
- Develop a comprehensive risk management plan that includes strategies for risk identification, assessment, and mitigation.
- Set clear risk tolerance levels and establish stop-loss orders to limit potential losses.
- Use diversification and hedging techniques to reduce overall risk exposure.
- Regularly monitor and review the effectiveness of the risk management plan, and make necessary adjustments.
- Stay informed about market conditions and potential risks, and adjust trading strategies accordingly.
- Seek out professional guidance and support from experienced traders and risk management experts.
- Avoid over-leveraging and maintain a healthy balance between risk and potential rewards.
- Maintain strict discipline and adhere to the risk management plan, even in the face of market volatility and uncertainty.
- Continuously educate oneself on the latest developments in risk management and futures trading.
- Embrace a risk-aware and cautious mindset when making trading decisions.
Conclusion
Risk management in futures trading is the process of identifying, assessing, and controlling potential losses that may arise from trading futures contracts.
This typically involves setting up stop-loss orders to limit potential losses, and using tools like risk-reward ratios and position sizing to manage risk and maximize potential gains.
It is an essential part of successful futures trading, as it helps traders avoid excessive losses and protect their capital.
Chapter 16: How to Exit a Futures Contract?
We now come to the end of the trading process wherein we shall learn how to exit a futures contract.
The process of trading starts at the very moment a trader spots a trading opportunity and develops a view which can be either bullish or bearish and then as we discussed in detail, every step that a trader has to go through while trading in futures.
Closing a futures contract is the last step that we shall focus on in this chapter.
Step 7: Exiting a Futures Trade
To understand how to exit a futures contract , let us first understand the concept of positions in the futures market.
Once this is clear , the process of exiting a future contract will be much more simpler.
Positions in Futures Market
Positions refers to trades that are currently live for a trader. In the futures market, a trader can enter into two types of positions based on the view developed by the trader.
Long Position
A long position is one in which the trader has bought a futures contract, with the expectation that the price of the underlying asset will rise.
Short Position
A short position, on the other hand, is one in which the trader has sold a futures contract, with the expectation that the price of the underlying asset will fall.
Both long and short positions have their own unique risks and rewards, and traders can use a variety of strategies to manage these positions and maximize their potential gains.
Long and Short positions indicate the biases of a trader, so what does opening and closing of positions mean?
I am sure every trader must have come across these jargons as they are commonly used in the futures market.
But what are traders referring to when they mention that they have open positions or they are closing their positions in the futures market?
Opening and Closing Positions in Futures Market
Open Position
A trader is said to have an open position whenever a trade is taken irrespective of a long or short trade in a particular future contract. An open position is a live trade, and it is subject to the fluctuations in the market.
It can either result in a profit or a loss, depending on the price movements of the underlying asset and the trader’s ability to manage their position effectively.
Open positions are a common feature of the futures market, as traders often hold their positions for varying lengths of time in order to take advantage of market conditions and potential price movements.
A trader is said to have multiple open positions if the trades taken are in more than 1 future contract.
Closed Position
Closing a position refers to the act of ending a trade by taking the opposite position to the one you currently hold. To close a position in the futures market, traders must take the opposite position to the one they currently hold.
For instance, if they are long (i.e., they have bought) a futures contract, they will need to sell a futures contract the same contract , to close their position.
Conversely, if they are short (i.e., they have sold) a futures contract, they will need to buy a futures contract to close their position.
Positions can be closed by placing an order with a broker to take the opposite position, and the position will be closed when the trade is executed.
It’s worth noting that closing a position in the futures market can result in either a profit or a loss, depending on the difference between the price at which the position was opened and the price at which it was closed.
Closing a position is important because it allows traders to exit and limit their potential losses to protect their capital. It can also result in a profit if the price moves in their favor.
While its obvious when a trader has open a position in markets , its because a trading opportunity is spotted with an anticipation of making profits. But there can be multiple reasons to close a position by a trader.
Closing a Trade to Book Profits
A trader can close his open futures position anytime on or before expiry of that contract.
Hence if a trader opens a position and price moves in his favour significantly, he has a choice of exiting so that he can take profits home.
Closing a Trade to Book Losses
Similar to booking profits , a trader can close a position when his stop loss is hit. if the trade goes against the direction that he was anticipating, he can close the open position to block his drawdowns further anytime on or before expiry day of that futures contract.
Compulsory Closing of Trades on Expiry
On Expiry of a futures contract, all open positions in a particular futures contract has to be closed as the exchange has to make sure that for the buyer there is a seller matched. Hence, a trader has to close all open positions on expiry.
If a trader still wants to keep an open position since his view remains intact, then he has to close the current month’s position and rollover over his positions and open a new position in the next month or the far-month contracts available in the futures market.
Forcefully Closing a Trade (Margin Shortfall)
As traders, we all tend to avoid that dreadful phone call known as the Margin call from our brokers. When a trade goes against a trader , MTMs start getting negative and the broker deducts the traders margin account upto the amount of losses incurred by the trader.
If the losses exceed the margin amount deposited by the trader, the broker shall demand to top up the margin account in case the trader wants to keep his position open.
If the trader fails to deposit the margin amount on time , broker has the authority to close all open positions and recover the losses incurred by the trader from the deposited margin.
Completion of a Trade
A trader is said to have completed a trade post closing the trade. Closing of positions indicates the completion of all the 7 steps of the process of futures trading.
- Developing a view
- Setting up a trading plan
- Choosing the right financial instrument
- Tools for futures trading
- Selecting the right strategy
- Risk management
- Exiting or Closing a position
This process is the same and is repeated everytime a trader spots an opportunity in the futures market.
And with this, we conclude this Futures Trading guide.
After thoroughly reviewing this guide on futures trading, its should be clear that futures contracts are a valuable tool for hedging against market risks and for taking advantage of price movements.
Futures trading indeed offer many benefits compared to other financial instruments, such as high liquidity and the ability to leverage positions.
However, it is important to carefully consider the risks involved and have a solid understanding of the mechanics of futures trading before entering into any contracts and this guide is curated with an intent to cover every possible aspect of futures trading.
With a clear strategy and disciplined approach, futures trading can be a profitable addition to an investment portfolio.
Mutual Funds Guide
Learn why and how to invest in mutual funds for long-term wealth creation.
Chapter 1: History of Mutual Funds in India
"Mutual Funds Sahi Hai"
This campaign has been running on all media platforms for years now. We all must have seen celebrities like famous cricketers and movie stars promoting the concept of mutual funds as a great tool for wealth creation for investors in the Indian markets.
In fact, in recent years, the adoption of mutual funds has played a pivotal role in mobilizing the savings of an average Indian investor. Retail investors have been accepting mutual funds as a part of their overall investment portfolio.
This is evident as we examine mutual funds’ rapidly growing AUM (Asset Under Management).
If we look at the data for the past decade, the AUM of the Indian Mutual Fund (MF) Industry has grown from ₹8.26 trillion as of December 31, 2013, to a whopping ₹50.78 trillion as of December 31, 2023.
That’s roughly more than a sixfold increase in 10 years.
Out of this astonishing growth that the mutual fund AUM has witnessed, more than a twofold increase in the AUM was witnessed in just the past five years.
The AUM in December 2018 was around ₹ 22.86 trillion, which grew to ₹50.78 trillion as of December 31, 2023, just in the past five years. Incredible growth, isn’t it?
This shows that the Indian mutual fund industry is growing much faster, thanks to the increased awareness of retail investors who believe in India’s growth story and are adopting mutual funds to fulfill their financial goals.
But this journey has been quite interesting!
Role of Mutual Funds in Shaping the Financial Markets of India.
There is enough evidence that, across the globe, in almost all the major economies, mutual funds have played a dominant role in mobilizing household savings to be invested in the growth of the macroeconomy. No exception for the Indian Economy as well.
In fact, the government took great initiatives in the early 1960s, introducing the concept of mutual funds to Indian investors, which enabled them to participate in the stock markets.
The introduction of mutual funds in India was a great way for small investors to mobilize their savings and get the opportunity to invest in large businesses with small capital.
Not only this, but it gave investors access to a safer way of investing in the markets since mutual funds offered diversification’s core benefit and an opportunity to earn higher returns on their investments.
Credits to all the participants of the Indian mutual fund industry, industries such as the asset management companies (AMCs), mutual fund distributors, financial intermediaries like brokers, and last but not least, our regulatory body SEBI (Securities and Exchange Board Of India), who have played a significant role in establishing one of the most sophisticated ecosystem that we have today.
An individual can invest their savings, which can help them achieve financial freedom,
“Just with a Click of A Button.”
This guide attempts to simplify the complex concepts of mutual funds so that you can use them to mobilize your savings into an asset class. This is by far one of the most lucrative and systematic ways of investing.
But before we dive deeper into the world of Mutual Funds, let’s take a look at the Journey of the Indian mutual fund industry—a glimpse of how this industry has evolved in India.
History of the Indian Mutual Fund Industry.
The Indian Mutual Fund Industry was established to promote financial inclusion and boost the Indian Economy at large.
With this aim, the MF industry has grown in phases. Here’s how the Indian Mutual Fund industry grew over the years.
Stage I: The Starting Point of MFs in India (1963 - 1987)
For the first time, investors in India were introduced to the concept of mutual funds by India’s first mutual fund scheme – UTI 64, in 1964, governed under the UTI Act of 1963 and the purview of the Reserve Bank Of India (RBI).
By 1988, this fund had amassed around 6,000 crores of AUM, helping various investors mobilize their savings.
Stage II: PSUs entering the Mutual Fund Industry (1987 - 1993)
This phase was during the era of globalization. It was a time when the Indian Economy opened its doors to world institutions, which increased attention to the stock markets.
1987 marked the entry of government-sector units such as various public-sector banks, the Life Insurance Corporation of India (LIC), and the General Insurance Corporation of India (GIC).
Key Highlights during this phase:
SBI Mutual Fund was the first ‘non-UTI’ mutual fund established in June 1987, followed by
Canbank Mutual Fund (Dec. 1987)
Punjab National Bank Mutual Fund (Aug. 1989),
Indian Bank Mutual Fund (Nov 1989), Bank of India (Jun 1990),
Bank of Baroda Mutual Fund (Oct. 1992).
LIC established its mutual fund in June 1989, while GIC set up its mutual fund in December 1990.
At the end of 1993, the MF industry had assets under management of ₹47,004 crores.
Stage III: Grand Entry of the Private Players in Indian MF Space (1993 - 2003)
This phase was the most volatile in the Indian markets. After witnessing the biggest bull run, the markets crashed after the famous Harshad Mehta scam. Investors’ confidence was shaken badly, and investors lost their life savings.
However, with the establishment of SEBI, the body responsible for regulating the securities market, investors’ confidence returned. It was also the time when many private sector funds in 1993, and that’s when a new era began in the Indian MF industry, giving Indian investors a wider choice of MF products.
As time passed, SEBI set up some regulations, which were also changed in 1996, making the MF industry robust and deeply regulated.
Stage IV: Phase of Consolidation, Lack of Confidence in MFs post the Sub Prime Crisis (2003 - 2014)
Some major structural changes, such as the government bifurcating two separate entities earlier known as UTI and UTI fund coming under SEBI, led to many mergers by private players.
The entire MF industry was undergoing structural change, and hence, there needed to be more focus on promotions and hardly any growth in AUM in these years. Besides that, many investors almost lost faith in mutual funds after the global financial crisis, which led to a massive fall in the Indian markets.
Now that Indian investors have started redeeming their mutual funds, the future of the MF industry remains uncertain. AMCs also suffered as SEBI abolished the entry load on mutual funds.
All these factors were responsible for slow AUM growth, especially during 2010 and 2013.
Stage V: The Current Phase of MF (2014 - Present)
Fast-forward to this phase, when SEBI introduced several progressive measures in September 2012. These measures started to “re-energize” the Indian Mutual Fund industry and increase MFs’ penetration by early 2014.
Since 2014, the Indian Mutual Fund industry has grown tremendously. Also, the MF industry crossed several key milestones year after year.
As mentioned earlier, the AUM has grown more than sixfold in 10 years, which shows that Indian Investors are adopting mutual funds as a crucial part of their portfolios.
You will be amazed to know that, on average, 14.10 lakh new folios were added every month in the last 5 years since December 2018.
Not only this, but in April 2016, the number of SIPs ( Systematic Investment Plans ) crossed over 1 crore, and as of 31 December 2023, the total number of SIP accounts is 7.64 crore, with a total AUM of ₹50.78 trillion.
And that’s not all. Every single year, on a month-by-month basis, mutual fund AUMs grow much faster.
This only shows that Indian investors believe in the narrative of “ Mutual Fund Sahi Hai,“we have all the reason to believe that in the coming years, every household will have at least one SIP or may be invested in mutual funds.
Chapter 2A: What are Mutual Funds?
Picture this –
Four friends are heading for dinner and are super hungry. On their way, they discussed and mutually agreed to spend roughly 400 to 500 per person on this all-inclusive meal. Setting up a total budget of around 2000/- all incl, they reach the most famous pizza joint around the street, selling the best pizzas in the city.
They decide to enter the restaurant, and to their surprise, they find out that they only sell a large 12” loaded pizza, which costs around 2000 rupees for the entire pizza, including a 10% service charge that the restaurant levies for all dinners.
Now, although all 4 friends were super hungry, they knew that ordering one loaded pizza per person wouldn’t make sense as they wouldn’t be able to finish all alone, and ordering multiple pizzas would be out of budget as well.
So they decided to order one large pizza and ask the restaurant owner to cut it into four equal slices. This way, all four would get an equal share, and they could enjoy the pizza without wasting food. This would fit their budget, too.
After they finished their meal, they split their bill equally. All four agreed to share the cost and went back home with the satisfaction of having a great, affordable meal without any hassle of wasting food.
This is exactly how mutual funds work!
Definition of Mutual Funds
A mutual fund is an investment alternative in which money from many investors is pooled together to buy various stocks, bonds, or other securities like gold, silver, etc.
This mix of investments is managed by a professional money manager, who provides individuals with a portfolio structured to match the investment objectives stated in the fund’s prospectus.
Let’s break this down –
Mutual funds are a budget-friendly way to collectively invest savings into shares, bonds, debentures, and other asset classes.
Mutual funds are ideal for investors who either lack a large corpus for investing or those who desire to create a meaningful corpus but lack the skill, expertise, or the time to research the market yet want to grow their wealth systematically.
The pool of money created by asset management companies (AMCs) by collecting small amounts of investments from multiple investors is then invested by these AMCs by professional fund managers in various schemes. Each scheme has certain objectives, and the fund managers choose different asset classes and create an optimum portfolio mix that aligns with the scheme’s stated objective.
For this, the fund house charges a small fee, which is deducted from the investors’ investments. The fees charged by mutual funds are regulated and subject to certain limits specified by the Securities and Exchange Board of India (SEBI).
Fund managers are qualified/expert money managers who showcase their talent and expertise to generate returns on behalf of investors who have shown their faith in trusting them with their hard-earned savings.
We shall dive deep into how mutual funds work, but before we do, let us understand…
Why should you consider investing in mutual funds in India?
Globally, India has one of the highest saving rates in the world ( Gross savings rate is approximately 30% on average per year). Now, these savings need to be deployed somewhere.
Most Indians who saved had a deep inclination towards traditional investments, such as Fixed Deposits (FDs) or fixed-income instruments, which gave assured returns.
This bias towards fixed instruments was mainly due to high interest rate regimes, where a bank FD was typically up to 12% per annum in the 1990s. (Yes! That is true.) However, as interest rates start declining, normally reaching a point where FDs or any fixed instrument can barely beat the high long-term inflation rates, Indian investors are looking for better alternatives to compound their wealth in the long term.
That’s where mutual funds come in, empowering Indian investors to participate in India’s growth story. As we all know, India is the world’s third largest economy (close to 3.73 trillion USD, 2023), growing at roughly 6% ( GDP ). It’s impossible to achieve all this growth without Indian companies increasing their earnings and profits, isn’t it?
Mutual funds help naive investors seek professional help and invest in stock markets. They can also invest in these growing corporations and get better/higher returns than traditional investments.
Of course, the risk is higher, considering stock markets are more volatile, but as the saying goes, “ Higher the Risk, Higher the Returns .“
But a word of caution here, and maybe you must have heard it a million times,
In quote box: “Investing in mutual funds is subject to market risk. Please read all scheme-related documents carefully before investing!”
Although higher risk could probably enable investors to get higher returns, there’s always the risk of losing money since mutual funds invest fully or partially in stock markets, varying depending on the schemes you choose to invest in.
Some Other Key Benefits
Diversification
Mutual funds let you access a wide mix of asset classes, including domestic and international stocks, bonds, and commodities, thereby reducing your overall portfolio risk. If one asset class falls, the other might outperform, offsetting the losses. Mutual Funds, in a true sense, help investors gain exposure to a multi-asset portfolio, thereby diversifying unsystematic risk ( risk related to a specific company/industry/asset class, in general).
Professional Management at Low Cost
Where else would you get a professional fund manager hired to invest on your behalf like a pro!
The cost and capital required are significantly more if you hire a Portfolio Manager or subscribe to Portfolio Management Services versus investing in mutual funds, which is quite cheaper since multiple investors hire a common money manager, and the costs are split amongst all.
Convenience / Ease of Investing
Mutual Fund Investing is nowadays as easy as online shopping. Just register, complete your KYC (Know Your Customer), select a scheme, choose the fund house you want to choose, and decide the amount you want to start with.
These days, financial intermediaries like banks and brokers like Dhan offer mutual fund investing on their platforms/apps, which almost instantly enable you to get started.
One additional benefit mutual funds offer is Rupee Cost Averaging through SIPs—Systematic Investment Plans! This superpower, if understood well, can work wonders for investors.
We shall discuss this soon in the coming chapters. For now, you know what a mutual fund is and how it works.
Before we learn in-depth about how Mutual funds work ( technically ), here is some jargon we should know! ( This will help you in the coming chapters )
See you in the next chapter!
Chapter 2B: Mutual Fund Jargon
Following are some keywords (Jargon) used daily in the Mutual fund world. These aren’t just jargon; some are concepts every MF investor should know.
AMC - Asset Management Companies
AMCs are the companies vested with the responsibility to collect money from investors and hire asset managers, who deploy these funds by investing through various schemes with a stated objective for investments and investing on the investors’ behalf.
AUM - Asset Under Management
The total amount of money the AMC manages and invests in various schemes of the Mutual Fund House on behalf of its investors is referred to as AUM ( Asset Under Management ).
Mutual Fund Scheme
The AUM is collected under a specific scheme or multiple schemes an investor chooses to invest in. The AMC has multiple schemes that invest in various asset classes, such as stocks, bonds, or a mix of both.
Each scheme, declared at its launch, has a predetermined objective and a set mandate. An Asset Manager appointed by the AMC is responsible for making all investment decisions based on the set objectives and managing the buying and selling activities of securities on behalf of the investors under that scheme.
Face Value
Face value is the default value at which any new fund offering of a Mutual Fund in India launches its schemes for subscription to retail investors. In India, the default face value of any mutual fund scheme starts with Rs 10/– as its face value.
Face values normalize the per-unit base value for subscriptions for retail investors and fund houses during the schemes’ initial launch. Later, based on the increase or decrease of the scheme’s AUM, the per-unit price also changes.
NAV - Net Asset Valeu
In simple words, a scheme’s NAV is the price at which investors buy the Mutual Fund Units.
NAV = Total Market Value of the Scheme at a given date divided by the total number of units issued under that scheme. The performance of a mutual fund scheme is denoted by its NAV per unit.
For example –
Market Value of a Mutual Fund Scheme = 10 Crores
Total Number of Units Issued under the scheme = 50 Lakhs Units ( each units having a face value of rs 10/– )
Therefore, NAV = Total Fund Value / No of Units issued
= ₹100 Cr/ 50 Lakh units.
= ₹20 per unit
Unlike stocks, where the price is driven by the volatility based on minute-to-minute trading, NAVs of mutual fund schemes are declared at the end of each trading day after markets are closed, following SEBI Mutual Fund Regulations.
The NAV of a scheme also varies daily because the market value of the securities also keeps varying during trading hours, hence the variation.
Cut Off Timings
Unlike in stock markets, mutual funds have defined cutoff timings, which decide the price at which the investor is issued the mutual fund units of a scheme.
As we learned, a mutual fund’s NAV is declared at the end of the stock market. According to SEBI regulations, Mutual Funds have to update their NAV based on closing prices.
Cut-Off Timings In Indian Mutual Fund Industry:
| Cot off Timings for | Liquid & Overnight Funds | All Other Schemes |
|---|---|---|
|
Subscriptions |
Before 1.30 pm on a working day |
Before 3 pm on a working day |
|
Redemptions |
Before 3 pm on a working day |
Before 3 pm on a working day |
Applicable NAV
This is an important concept to understand because the NAV applicable to you when you buy or sell mutual funds may not be the same as the NAV of the scheme that you may see on a closing basis.
Every investor who subscribes or redeems their mutual fund schemes should understand which day NAV shall apply to you, meaning –
The same-day NAV will apply if an investor buys (subscribes) or sells (redeems) within the cut-off timings.
If an investor exceeds the time limit to buy (subscribe) or sell (redeem), the next working day will apply. This is what we refer to as the ”applicable NAV “
Sale Price
From an MF investor’s standpoint, the sale price is the price payable per unit by an investor for purchasing units (subscription) and/or switch-in from other mutual fund schemes.
In case of a New Fund Offering, the sale value is the Face value per unit at which the scheme is being issued to investors (usually it’s ₹10/-) mentioned in the Scheme Information Documents – (SID and KIM – we shall study them in detail too in our guide).
Redemption / Repurchase Price
The Repurchase/Redemption Price is the price per Unit at which a Mutual Fund would ‘repurchase’ the units (i.e., buy back units from the investor) upon redemption of units or switch-outs of units to other schemes/plans of the Mutual Fund by the investors. It includes exit load, if / wherever applicable.
Here’s how the redemption price is calculated:
Redemption Price = Applicable NAV*(1- Exit Load, if any)
For Example: If the Applicable NAV is ₹20 and Exit Load is 2%, then the Redemption Price will be = ₹20* (1-0.02) = ₹19.60
Expense Ratio
The expense ratio is the percentage of fees that a mutual fund takes to manage the fund, its schemes, and all administrative expenses that are required to run the mutual fund company. The expense ratio comprises – sales & marketing/advertising expenses, administrative expenses, transaction costs, investment management fees, registrar fees, custodian fees, and audit fees as a percentage of the fund’s daily net assets under management fees. All such costs for running and managing a mutual fund scheme are collectively called the ‘Total Expense Ratio’ (TER).
As an investor, consider the expense ratio as the cost of hiring professional management to manage your investment portfolio systematically.
As per MF regulations by SEBI, every mutual fund house has to mention its expense ratio categorically on the Offered documents for complete transparency. There’s also a cap on the maximum expense ratio that can be charged by a Fund House. The Expense Ratio may vary from scheme to scheme based on how the fund is managed by the portfolio manager.
Open Ended And Close Ended Schemes
Each scheme offered by the mutual fund houses is broadly differentiated by structure into two types: Open-Ended Schemes and Closed-Ended Schemes.
The differentiation indicates an investor has flexibility while subscribing to redeeming the mutual fund units.
Open-ended Schemes are schemes in which an investor can enter or exit at any time. Basically, open-ended funds are always available to investors for investments or redemptions.
whereas Closed-Ended Schemes are schemes in which an investor can buy the mutual fund units after the scheme’s launch (after NFO) and can exit only when the fund’s investment tenure is over. This means close-ended funds are open during the NFO period for investments and can be redeemed after a lock period decided by the Mutual fund AMC.
Entry and Exit Load
Entry and Exit loads are fees that mutual fund houses charge investors when they buy or redeem mutual fund units.
Entry load is a fee charged to an investor when entering into a mutual fund scheme. The Mutual Fund Regulator, SEBI, has banned all mutual fund houses in India from taking any entry load.
Exit load is a fee levied to an investor who redeems before the lock-in period of a particular scheme. Fund management charges exit load to protect their overall return performance, as sudden redemption pressure can severely impact mutual fund performance.
Most investors avoid panic redemption of mutual fund units to avoid exit load fees, which seems like a win-win situation for both the investors and the mutual fund houses.
Lock-In Period
Some Mutual fund schemes are designed to attract a lock-in period. A lock-in period is a stipulated time period within which mutual fund investors are restricted from redeeming their units.
There’s usually a trade-off for investors, for example, tax-free returns on ELSS schemes after 3 years of lock-in. Hence, investors also agree to such lock-ins.
SIP / Lump Sum Investments / STP / SWP
There are 4 ways investors can invest in mutual fund schemes.
1. Systematic Investment Plan (SIP)
The most famous is the SIP, a systematic investment plan that allows an investor to set an amount to invest at regular intervals, be it monthly, quarterly, semi-annually, or annually.
Investors can start with as low as Rs 500 per month, every month on a fixed date, which automatically gets debited from their account (after providing a bank mandate to their bank authorising the AMC to auto debit the fixed SIP amount).
2. Lump Sum Investments
As the name suggests, the lump sum mode enables investors to invest a large amount at once in the selected mutual fund scheme.
3. Systematic Transfer Plan (STP)
This is a hybrid way to invest in mutual fund schemes, combining Lump Sum Investments with SIPs.
An investor first invests a lump sum amount in a particular scheme of a mutual fund house. Then, at each defined regular period/interval (monthly, quarterly, semi-annually, or annually), a fixed amount of capital is directed to another mutual fund scheme of the same fund house.
For example, if Mr. X, CEO of a tech company, receives a bonus of ₹1 crores from his company and wants to invest this bonus in mutual funds, he does not want to invest a lump sum. So, he can choose to do an STP, wherein he can park his 1 Cr in a liquid or any debt fund of a particular AMC and choose a monthly SIP of, let’s assume, 1 lac per month in a large cap fund scheme of the same AMC.
This way, he can systematically invest his savings while still earning some returns on the lump sum amount. A Game changer for investors, isn’t it?
4. Systematic Withdrawal Plans ( SWPs)
An SWP is quite similar to an STP, but there’s one major difference. In the SWP mode, an investor can withdraw his/her funds from an accumulated corpus that is still invested in a particular scheme on an installment basis periodically (monthly, semi-annually, annually).
Let’s take an example: Mr. Y has been investing in mutual funds via SIP mode for over 30 years and has managed to accumulate a corpus of around 2 cars. The goal of his savings is to retire comfortably and support himself when he doesn’t have any source of income post-retirement.
Now, after retirement, Mr Y needs a monthly income of Rs 1 lac to survive. Since he has a lump sum of 2 crores, he can achieve this goal by choosing an SWP mode.
So the 2 cr lumpsum remains invested in, let’s say, a balanced fund that has a mix of debt and equity. Out of that 2 crore corpus every month, some units amounting to 1 lac rupees will be sold, and the amount will be credited to Mr. Y for him to use for his expenses. This is how a SWP works.
All the above modes of investing in mutual funds are smart solutions that deploy savings into mutual funds systematically. They are suitable for different investors and cater to their individual personalized requirements.
Fund Category
As per the SEBI guidelines on Categorization and Rationalization of schemes issued in October 2017, mutual fund schemes are classified into the following categories–
Equity Schemes – funds that invest in equities suitable for higher risk appetite and longer time horizons.
Debt Schemes – Also known as income funds, debt schemes invest in bonds and other debt securities and are suitable for investors seeking income generation and capital protection.
Hybrid Schemes – a mix of equity and debt securities.
Solution-oriented Schemes – invest in a mix of equity and debt securities. They usually involve a lock-in period, and some schemes have withdrawal limitations. These schemes are designed for specific goals, such as Retirement, children’s education, marriage, etc.
Other Schemes – index Funds, ETFs, and Funds of Funds—are basically passive funds that invest in indexes or replicate any underlying.
Every mutual fund must launch its schemes under the above-mentioned categories. Each category has defined permissible allocation limits, which the mutual fund managers must abide by. SEBI has levied strict regulations for any violations by AMCs who fail to obey.
Asset Allocation
Asset Allocation in Mutual Funds refers to the strategic distribution of the pooled money collected from investors into various asset classes, such as equities, debt instruments (including corporate bonds and government securities), and commodities like gold and silver. This allocation is done in predetermined proportions to balance risk and return according to the investment objectives of the mutual fund scheme.
Annual Return
Represents the percentage increase or decrease in the value of the investment over a one-year period. This figure includes all earnings from capital gains, dividends, and interest income, giving investors a comprehensive view of the fund’s performance over the year. Expressed as a percentage, annual returns are crucial for assessing and comparing the performance of various mutual funds.
Benchmark
Benchmarking is a standard or reference point used to measure the fund’s performance in the context of mutual funds. Usually, a specific market index, such as the Nifty 50 or the BSE Sensex, represents the market segment that the mutual fund aims to replicate or outperform.
The benchmark is a yardstick to evaluate the fund manager’s effectiveness and help investors understand how well the fund performs relative to the broader market or a specific sector.
Chapter 3: Understand This Before Investing in Mutual Funds
Whether you’re a beginner or an existing investor, you should know a few fundamental things about mutual fund investing.
Investing in mutual funds offers a lot of adaptability
Mutual funds (MFs) are an incredible tool for wealth creation for long-term investors looking to participate in stock markets and generate some alpha over returns. That’s not all; MFs also provide a full array of opportunities for short-term investors as they offer various schemes that invest in short-term debt instruments.
There’s always something for every investor in the mutual fund world, provided that the investor is well-equipped to participate and is willing to explore! – the endless opportunities/solutions that mutual funds have to offer.
MF schemes come with a cost
Although mutual funds are very simple, useful, and by far the best tool for retail investors as they allow them to participate in various asset classes, access to mutual fund schemes that provide these solutions comes with certain costs involved, such as the expense ratio.
As we have learned, the expense ratio is deducted from the returns, and the fund is generated over a given period. Certainly, suppose you compound this small percentage of the expense ratio over a longer time period. In that case, the result can be a significantly large portion carved out as expenses out of the total return generated.
But the flipside to this is that a retail investor who has very little or lacks knowledge of how to invest or doesn’t have the time to look into investment opportunities should look at mutual funds as a solution and the expense ratio as the cost of getting access to professionals who help these investors in their wealth-creating journey.
In our forthcoming chapter, we will discuss this in-depth and explain how to choose the best mutual fund for you. For now, it’s important to understand that there are no free lunches when it comes to mutual fund investing.
Currently, when an investor invests in any mutual fund scheme, the costs that an investor has to bear is
a. Expense Ratio – Every scheme’s expense ratio may differ depending on the fund type and plan type (Regular or Direct Plans). On average, the expense ratio ranges from 0.02% to 2-2.5% or even more in some specific schemes and is deducted from the NAV.
b. Exit Load – This is only applicable at the time of redemption if the redemption is before the lock-in period stated by the mutual fund scheme. On average, the exit load may vary from 1% to 2%, depending on the fund type.
c. Opportunity Cost – Technically, the concept of opportunity cost is theoretical and not applicable in reality, but there’s always an opportunity loss if an investor delays his/her investments in mutual funds (if he/she agrees with the risk associated with it). Most investors ignore this since this cost is not actually charged by the mutual fund house. Still, it would make great sense for an investor to do the maths and understand the cost of not investing early or at all, which can significantly impact your wealth in the future.
Risk Factors Associated with Mutual Fund Investing
By now, we know mutual funds have multiple benefits for investors, but investing in mutual funds comes with certain risks. These risks may vary depending on the schemes that an investor chooses to invest in.
There’s a standard risk that applies in mutual fund investing is –
“Mutual fund schemes are not guaranteed schemes.”
As the price or interest rates of the securities in which the Scheme invests fluctuate with any change in the market movements, the value of your investments in a mutual fund Scheme may go up or down. This basically means volatility in a core part of mutual fund investing, which every investor should know.
Since mutual fund schemes invest in various asset classes, such as equity/shares, debt instruments such as money market instruments, bonds, certificates of deposits, etc., and even precious metals like gold and silver, the risks that these individual asset classes carry are passed on to the investors directly.
For example, an equity-oriented mutual fund scheme that invests in shares has the inherent risks that are associated with equity market investing (loss of capital, price risk, systematic / event risk)
Similarly, any debt mutual fund scheme that invests in bonds, G-Secs, or money market instruments also carries the inherent risk associated with debt investing (interest rate risk, credit or default risk, liquidity risk).
Entry and Exit Loads and Lock-Ins
As we have learned, a ‘load’ is an additional fee levied by mutual fund houses (AMCs) on investments made by investors in various mutual fund schemes. These loads are adjusted in the NAV on redemption.
Although SEBI has banned all mutual fund AMCs from charging entry loads to any of the mutual fund schemes, AMCs are allowed to charge an Exit load, which they have to clearly specify in the Scheme Information Document that is offered to investors.
As explained in our jargon section, exit load is the cost charged if an investor’s funds are under management via any scheme and are withdrawn before the lock-in period.
Most mutual fund schemes levy an exit load on withdrawals, which are usually before 1 year. However, this may vary from scheme to scheme within a fund house and may also differ between various AMCs.
The exit load is deducted from the NAV after redemption. For example, if you bought 100 units of an MF scheme at a NAV of 10 rs per unit on January 1, 2024, the exit load is 1% applicable on withdrawals before 1 year. You decided to sell the units when the NAV increased to 15 rs per unit on March 31, 2024 (within 3 months).
So the applicable NAV for you would be = ₹15 – *(1-01) = ₹14.985/-
The payout would be = 100 units * ₹14.985 (applicable NAV after the exit load).
Knowing Your Risk Profile
As an investor, it’s always advisable to know your risk profile before investing in any asset class. Knowing your risk profile profoundly helps you accept volatility and also helps you make informed decisions while choosing an asset class.
Each mutual fund scheme has some risks involved, and therefore, an investor who is aware of his/her risk-taking ability is likely to choose the mutual fund scheme that suits him/her best. Moreover, that investor will also stay invested under extreme volatility.
Most investors panic when they invest in mutual fund schemes that do not suit their risk profile, and ultimately, they fail to meet their goals by cashing out early.
Knowing Your Goals
What’s a plan without a reason or an end goal? Defining your reason/goals for investing in mutual funds and setting the right timelines sets a realistic expectation of returns from your investments. Moreover, attaching your mutual fund schemes to a particular goal can help you stay focused on achieving the goals.
For example, if child education is a goal for an investor who has a 1-year-old child, he/she can start investing in mutual funds with the objective of funding his/her child’s education through SIPs. Investing small amounts every month for the next 18 -20 years is much easier than shelling out a lump sum after 20 years, isn’t it?
And since the time horizon is longer, the investor can take some risks and invest in an equity mutual fund or choose any fund that suits the risk profile and let compounding work wonders in the longer term. In fact, not only does the investor get the ease of building a corpus in installments, but the power of compounding can amplify the returns in the longer term. Thereby, the investor can save less and get more.
Selecting a mutual fund scheme based on your goals and time horizon
This is the most crucial aspect of mutual fund investing that many investors struggle to understand. Most investors start investing in mutual funds with a defined goal but fail to choose the right scheme to help them achieve that financial goal.
For example, an investor who has started saving via mutual funds to buy his dream car in a year’s time chooses a very aggressive mutual fund scheme and invests in volatile stocks.
As we all know, stock markets can be quite volatile in the short term. If the markets do not perform or crash within the desired time frame, chances are that the investor won’t be able to buy the desired car or might delay the purchase due to the shortage of funds.
Therefore, it is very important to select the right mutual fund scheme based on the goal and the time required to achieve that goal.
Past Performance of the Fund
Although the past performance of any mutual fund scheme does not guarantee future returns, it’s important to study past results to gauge the performance and pedigree of the mutual fund managers.
The average past returns of 1, 3, or 5 years can be studied to look for consistency and performance and establish trust and confidence in the mutual fund manager and the overall AMC.
However, past performance should never be considered in isolation. An investor should use various qualitative and quantitative measures to evaluate the fund’s performance over a long period and then make an informed decision before choosing the right fund scheme and fund house.
“Mutual fund schemes are not guaranteed schemes.”
We don’t mean to scare you, but it’s good practice to know what you are getting into, isn’t it? Thanks to our market regulator, SEBI, every mutual fund house that issues its schemes to invest in has to offer proper documents that have detailed descriptions of the mutual fund house, its managers, which assets the managers will invest in, and most importantly, all the risks associated with investing in that scheme.
Documents such as SID, KIM, and SAI, which are published by every mutual fund AMC on their websites, contain the above information.
These documents explain the nature of the schemes and give an in-depth understanding of where the MF fund manager has deployed money in the past and how he will invest in the future.
Why is this important? These documents will enable every investor to make an informed decision since they help to determine whether the scheme is suitable for them.
Chapter 4: How is a Mutual Fund Formed
By now, you must have understood how a mutual fund works. In this chapter, let’s dive deeper into how a mutual fund actually functions legally in the Indian markets. For this, we need to understand the key constituents of a mutual fund and its organizational structure to know how a mutual fund House is formed and how an AMC is appointed.
We then go on to understand the legal structure of a mutual fund, who the service providers are, and their role in ensuring every mutual fund transaction is carried out smoothly.
You may want to skip this chapter if you already know how a mutual fund functions technically and are aware of its legal framework.
But for those who are beginning their journey into MF investing, you should understand this very carefully as it will give you a lot of confidence and comfort in using MFs as a tool for investing.
A Mutual Fund is a Trust
So, as per the SEBI (Mutual Fund) Regulations, 1996, as amended to date, “A mutual fund” is defined as “a fund established in the form of a trust to raise monies through the sale of units to the public or a section of the public under one or more schemes for investing in securities including money market instruments or gold or gold-related instruments or real estate assets.”
Further, the regulation states that the firm must set up a separate asset management company (AMC) to run a mutual fund business.
The above definition clearly states that mutual funds are constituted as trusts and are governed by the Indian Trusts Act, 1882. An AMC should be a separate company that manages the money received by the trust through investors.
A trust deed, executed between the sponsors and the trustees, governs the operations of the mutual fund trust.
Sponsors - the guys who run the show
Since a mutual fund is a trust, there’s no owner, of the mutual fund company. A trust is run by a sponsor/s (could be more than one), and these are the main guys who run the mutual fund.
When a trust is formed, there have to be beneficiaries, don’t they? So here, the beneficiaries are the Investors who invest in various schemes of the mutual fund.
Trustees – responsible for protecting the interests of investors.
Any trust acts through its trustees. Trustees are individuals or a group of individuals (aka Board of Trustees) appointed to run the mutual fund company and play the most important role, protecting the interests of the beneficiaries (investors).
The trustees execute an investment management agreement with the AMC, setting out its responsibilities.
AMCs: Day-to-Day Managers
The AMC is appointed by the sponsor or the Trustees and handles the day-to-day management of the schemes for the mutual fund trust.
The record of investors and their unit-holding may be maintained by the AMC itself, or it can appoint a Registrar & Transfer Agent (RTA) to keep the records on behalf of the AMCs.
A very important point here is that although the AMC manages the schemes, the custody of the scheme’s assets (securities, gold, gold-related instruments, and real estate assets) is with a Custodian, who is appointed by the Trustees.
Custodians - Guardians of the Assets
A Custodian, appointed by the trustee, has custody of the fund’s assets. As part of this role, the custodian must accept and deliver securities to purchase and sell the fund’s various schemes.
All custodians need to register with SEBI under the SEBI (Custodian) Regulations 1996 and a custodial agreement is entered into between the trustees and the custodian.
Why a custodian ? to protect the interests of mutual fund investors. Independent custodians ensure that fair practices are adopted, the money is put to the right use and stays protected.
So you see, mutual funds are highly regulated, and the structure designed by our market regulators makes them a highly regulated business.
The 1996 MF regulations by SEBI have ensured that the mutual fund industry is highly regulated at all times. These regulations also lay down various criteria, right from forming a trust to the set of rules applicable while appointing the sponsors, trustees, AMCs, and custodians. Thus, SEBI has a complete regulatory watch on MFs.
The Silent Pillars of Mutual Funds & their Role - the Service Providers
Now that we have discussed the structure of how a mutual fund legally functions in the real world, it’s also important to know about some of the other key service providers, aka the pillars or the ancillary enablers, that aid the AMCs in the ease of doing business and also simplify the life of every investor in Mutual funds.
Fund Accountant
performs the role of calculating the NAV by collecting information about the assets and liabilities of each scheme. The AMC can either handle this activity in-house or engage a service provider.
Registrars & Transfer Agents (RTAs)
RTAs are essentially the backbone of the Mutual fund Industry. They maintain investor records for almost all the AMCs in India ( those without an in-house team). Basically, they are the fund accountants for the AMC, but they are outsourced.
They function through their Investor Service Centres ( ISCs) located in multiple cities across India, which serve the important role of documenting investors’ investments in mutual funds.
The main role of the RTAs is to record all the transactions ( purchase and sale of units, processing transactions, dealing with the funds received and payment made while investors transact and Updating the information in the individual records of the investor, called folios,
They are also responsible for keeping the investor informed about the status of their investment account and all the information related to the investments. Although an AMC can perform all the above activities themselves, they choose a SEBI-registered RTA to outsource this work for convenience. Indeed, it’s a smart choice as these RTAs are SEBI-registered companies that are professionals in handling customer data and processing large transactions smoothly and efficiently.
KYC Agencies – Central KYC Registry Agencies (KRAs)
If you are an existing investor in any of the securities market instruments, you probably know what a KYC (Know Your Customer). KYC is a mandatory process which establishes the complete personal details of an investor, its name and address to establish an identity of an investor.
To invest in a mutual fund , an investor has to be KYC compliant (under the provisions of PMLA – Prevention of Money Laundering Act).
Now, the issue here is that there are roughly 4 crore mutual fund investors currently investing in India ( as of 2024 ). Imagine if all them had to do a KYC every time they decided to invest in a mutual fund. Don’t you think it is a tedious process and a serious hassle for the AMCs to adhere to?
So, to eliminate this repetitive process, SEBI issued regulations for the registration of central KYC Registry Agencies (KRAs) in 2011, introducing a common/ central KYC ( CKYC ) for investors in securities markets.
These KRA firms are registered with SEBI, and they process various details and documents to establish the investor’s identity and assign a number through a letter. ( Referring to getting a CKYC done)
A copy of this letter can be submitted to any SEBI registered intermediary, specifically AMCs, in case of Mutual Funds, with whom the investor wants to transact.
This is a simple solution to a complex problem; kudos to our regulators once again for simplifying the ease of investing across all securities.
Depositories and Depository Participants (DPs)
Consider Depositories as electronic or digital banks of securities. A Depository is an institution that holds securities in dematerialized or electronic form on behalf of investors.
Dematerialization started with shares, and now folios of mutual funds can also be seen in your DEMAT statement issued by the depositories.
There are only 2 Depositories in India –
1. CDSL – Central Depository Services Limited.
2. NSDL – National Securities Depository Limited.
Both do a phenomenal job of digitalizing the investors’ experience and simplifying tracking and monitoring their investments by allowing them to hold all securities in a single consolidated space.
Now, DPs are essentially the branches of these depositories. To overcome the geographical challenges of reaching out to investors by opening offices at multiple locations, these depositories appoint DPs to help onboard the investor.
Investors contact these DPs, and these DPs help investors open a demat account with the said depository.
Auditors – the warriors protecting the investors!
Independent investigators are responsible for auditing the books of accounts of an AMC and raising any red flags if they see any after going through the auditing process.
The auditor appointed to audit the mutual fund scheme accounts needs to be different from the auditor of the AMC.
While the scheme auditor is appointed by the Trustees, another independent auditor ( not related to the AMC in any way ) needs to be appointed to audit an AMC and its operations. This auditor is appointed by the AMC itself.
I’m sure you understand why auditors are important—they constantly monitor AMCs and are responsible for protecting the interests of every mutual fund investor.
Mutual Fund Distributors (MFDs) – the support system for AMCs and Investors
They are in the hands of the AMCs and are responsible for distribution, which means selling mutual fund schemes to retail investors.
In India, an MFD must be certified by the NISM (National Institute of Securities Market) and compulsorily register with AMFI—the Association of Mutual Funds in India—and get an AMFI Registration Code (ARN code). This is a mandate under the regulations of SEBI for mutual funds, without which an MFD cannot perform any selling activity in mutual fund schemes.
After obtaining the certification and the ARN code, an MFD can empanel itself as a distributor with multiple AMCs.
Any individual or institution, such as distribution companies, broking companies, and banks, can be a distributor if it abides by the above-mentioned rules and adheres to a code of conduct, including fair practices, for selling mutual funds to retail investors.
Transaction Platforms / Stock Exchanges – the new age tools for digital India!
With technology disrupting almost every sector, recent tech platforms like Dhan have changed how we invest in mutual funds. From the era of physical filling out and submission of long forms, which took 2 to 3 working days or even a week, to now just uploading the documents, using a video verification and ADHAAR-based validation, opening a mutual fund account, and subscribing to any mutual fund scheme, all within minutes!! We have indeed come a long way!
In fact, Dhan allows its users to invest/purchase, redeem, switch, etc., into mutual funds directly without needing an MFD or the complicated hassle of going to an AMC. In fact, Dhan allows its users to complete any required transactions for multiple AMCs using just the Dhan App (everything in a single app).
Not only does the platform simplify the transaction process for investors, but it also provides great features to help investors make informed decisions.
Investors can also transact in certain closed-ended mutual funds and ETFs that are listed on recognized stock exchanges. Since all closed-ended funds must be listed on the stock exchanges by rule, an exchange allows investors to exit a mutual fund after the NFOs.
This concludes this chapter. In the next chapter, we will decipher mutual fund ads’ most important statutory warnings!
Chapter 5: Important Documents of a Mutual Fund
“Mutual funds are subject to market risk. Please read the documents carefully before investing!”
Have you heard this before? Why is this statutory warning clearly stated as a disclosure after every “Mutual Fund Investing” advertisement on television, print, or social media?
3 main scheme-related documents are mandatory to be offered to every investor, namely:
- KIM – Key Information Memorandum.
- SID – Scheme Information Document.
- SAI – Statement of Additional Information.
Both documents are prepared in the format prescribed by SEBI, and each mutual fund must submit them to SEBI. The contents must flow in the same sequence as the prescribed format. The mutual fund can add any other disclosure it feels is ‘material’ for the investor.
SEBI has made it very clear that by law, every mutual fund house has to share this disclosure mentioning the risks involved in mutual fund investing so that every investor who decides to invest makes an informed decision before they start investing.
Mutual fund AMCs have to offer these important scheme-related documents (which we shall discuss in this chapter), which contain all the possible information an investor “needs to know” or, let us say, “has to know” about mutual fund schemes and the Mutual Fund House/ AMC as well.
These scheme-related documents not only explain the risks involved in MF investing but also disclose where the AUM is being invested and all the information about the risks involved that can impact your savings through investing through the selected mutual fund scheme.
It’s great practice, isn’t it? Especially in finance, where it’s imperative to learn about all the possible risks involved before investing rather than losing money and then learning.
It’s worth noting that MF investing is governed by the “caveat emptor” principle, which means “ let the buyer beware.” Hence, an investor is assumed to have made an informed decision by carefully reading all the scheme-related documents offered before investing.
Since MF is a contractual arrangement, the investor signing the application form has legally accepted the terms of the offer by the Mutual Fund House. Therefore, an investor cannot claim in the future to be unaware of any information or that the information was not shared since all scheme-related information is disclosed in the scheme-related documents.
Therefore, it’s crucial to know what these offered documents are and decode them so that you know exactly what you are getting into the next time you choose to invest in MFs.
So, let’s decipher these scheme-related documents and understand how to read them.
Key Information Memorandum (KIM)
A Key Information Memorandum (KIM) sets forth the information a prospective investor should know before investing.

KIM is a comprehensive statement that provides all the basic information about a Mutual Fund, AMC, and scheme at a glance.
For any further details of the Schemes/Mutual Funds, like a due diligence certificate by the AMC, its Key Personnel, the rights of the investors, risk factors, etc., that investors should know before investment, investors can refer to the Scheme Information Document (SID) and Statement of Additional Information (SAI) available free of cost at any of the Investor Service Centres or distributors or from the website.
SID - Scheme Information Document
A SID is a detailed version of the KIM that explains everything about the Mutual fund, its AMC, and the scheme in detail.
The initial SID contains the following information:
- Name of the Scheme – Every scheme is given a name that usually precedes the AMC’s initials and the category under which the scheme can invest – For example, the HDFC Flexi Cap Fund is an MF scheme run by the HDFC AMC.
- Type of the Scheme – whether open-ended or closed-ended where the scheme will invest, in which securities, and type of categories within which the fund manager may choose those securities.
- Name of the Mutual Fund registered.
- Name of the Sponsor
- Name of the Asset Management Company
- Name of the Trustee Company.
- Registered Address, Website of the Entities.
- The Scheme Objective and its suitability for investors
- The Risk-O-Metre signifies the risk parameters/ levels of risk for mutual fund schemes based on the risk profiling of an investor.
- A standard disclosure, to consult a financial advisor for better clarity of the scheme.
Post this information, the SID further discloses all the information regarding the scheme –
- Highlights of the scheme which states
The Category of the Scheme (Large/Mid/Small Cap / Flexi / Hybrid / Debt / Balanced)
Its Investment Objective in detail
The Benchmark which the scheme shall be compared to
Standard disclosures regarding the scheme, its portfolio and the NAV, minimum application amount, transaction charges, dematerialization and transfer of units, liquidity of the scheme for its investors, etc. - An introduction to the scheme also includes standard or general risk factors that affect all mutual fund schemes (in detail), the requirement of Minimum Investors in the scheme, special considerations, if any, a Glossary containing “Definitions and Abbreviations,” and the due diligence by the Asset Management Company.
- Information about the Scheme – a detailed version that answers the following questions –
Type of the scheme
What is the investment objective of the scheme
How will the scheme allocate its assets
Where will the scheme invest
What are the investment strategies
How will the scheme benchmark its performance
Who manages the scheme
What are the Investment restrictions
How has the scheme performed
And how is this scheme different
- Information about its Units and whether there is any ongoing offer like an NFO and expenses for the same
- Any Ongoing Offer, if any (complete details of the NFO issuance)
- Periodic Disclosures, if any
- Calculations of the NAV for the scheme
- Detailed disclosures regarding the Fees and Expenses, including any Annual Scheme Recurring Expenses, Scheme Expense Structure, Transaction Charges and Load Structure, and any Waiver of Load for Direct Applications
- The SID also states the Rights of Unitholders
- Any pending litigations, proceedings, findings of inspections, or investigations for which action may have been taken or is in the process of being taken by any regulatory authority and penalties, if any
SAI - Statement of Additional Information
The Statement of Additional Information (SAI) contains details of the mutual fund, its constitution, and specific tax, legal and general information.
SAI is incorporated by reference (is legally a part of the Scheme Information Document)
Here’s what a SAI document looks like:

SAI contains the following information –
- Information about the Sponsor, the AMC, and the Trustee of the Mutual Fund
- Details about its Constitution and also about the service providers.
- This document contains condensed financial information about the scheme—its NAV at the start and end of the financial year, its performance relative to the benchmark it follows, and the date of the first allotment.
- Also states the information on the valuations of its securities and all the other assets.
- Details about taxation and other general information include nomination facilities, conditions for joint holders to a scheme, and other information such as the website address, email communications, disclosures of intermediaries, etc.
Why is it essential for every investor to read all the documents offered carefully before investing?
Well, we have covered all the points in the introduction section of this sector, and to summarise that for you, Here are some of the most important reasons why you should read them –
- MF investing is governed by the “caveat emptor” principle, which means “let the buyer beware.” You are investing your own hard-earned money, and therefore, you must make some efforts to make an informed decision before investing.
- It helps you build conviction! All the documents share crucial information about where the money is being allocated, and most importantly, complete details of the Mutual Fund, Its Asset Managers, and detailed information about the sponsors and the Trustees. This helps you build trust in the mutual fund company managing your investments.
- These documents can also help you select the best mutual fund scheme. All the risks associated with the schemes are mentioned, making it easier to understand which schemes best suit your risk profile.
On this note, we end this chapter here. In the next chapter, we will explore mutual funds in more detail and learn what types are available to investors.
Chapter 6: Why Should You Invest in Mutual Funds
Here’s a universal fact: Every individual who saves money, whether retail, high-worth individual (HNI), or ultra-HNI investor, seeks to invest their savings/surplus into various asset classes to grow their wealth.
However, the choice of asset class in which they might invest could depend on multiple factors, such as the capital to be invested, the individual’s risk profile, and, most of all, their knowledge about how every asset class works.
These key factors help individuals choose an asset class and the various instruments available to deploy their savings and generate returns for their future goals.
Some investors who understand equity markets and have the time and skill to invest in them could choose to invest in direct stocks. Some investors who are risk averse may choose debt market instruments to generate regular income from their savings.
Some investors might opt to seek professional help simply because they lack the time or knowledge or expertise to manage their portfolios.
For such investors, mutual funds are a perfect solution.
As we learned from our previous chapters about how mutual funds work, in this chapter, we shall now understand why an investor should invest in mutual funds.
Mutual funds are an excellent investment vehicle for beginners and experienced investors, offering a convenient way to build wealth over time. Here are some compelling reasons why investing in mutual funds makes sense:
Helps to deploy micro-savings through SIPs
Mutual funds allow you to deploy a small portion of your income and invest in various mutual fund schemes through the SIP Systematic Investment Plans feature.
This allows you to invest a fixed amount periodically, say, monthly or quarterly. You need not invest huge amounts all at once. This disciplined approach can help you take advantage of rupee cost averaging and benefit from market fluctuations.
Indeed, SIP is a superpower for small retail investors who can take advantage of starting with smaller amounts, as low as 500 rs a month, and gradually increasing their savings as and when their income increases.
In fact, according to the Association of Mutual Funds India ( AMFI ) data, the Indian mutual fund industry saw a staggering 27.5 million SIP accounts as of March 2023, highlighting the popularity of this investment approach.
Helps investors reap the power of compounding
In the words of Albert Einstein, “ The Power of Compounding is the 8th Wonder of the World.” He who understands it earns it … he who doesn’t … pays it.”
Mutual funds allow you to have a disciplined approach to regular savings. An investor who uses this approach can significantly compound his/her wealth in the long term.
To give you some context, an investor who invests just 5000 per month for 30 years and invests in a mutual fund that makes (assuming) a 12% per annum CAGR return could manage to accumulate a corpus of 1.54,04 866/-
SIP = 5,000/- per month.
SIP Period = 30 Years.
Total Invested Amount = 18,00,000/- (18 lacs)
Total Absolute Gain = 1,36,04,866/- (1.36 crores)
Total Wealth Created = 1.54,04, 866/- (1.54 crores)
It’s astonishing, isn’t it? That’s the power of Compounding. Every investor should consider starting as early as possible, using mutual funds to save early, and letting compounding work wonders in the long term.
Professional expertise to manage your money
As discussed in the beginning, not all investors have the skills, knowledge, or expertise to invest in various asset classes. Most investors invest in asset classes that are randomly recommended by any source, such as friends, family, relatives, or unsolicited recommendations on social media by the so-called Fin Fluncers.
Ultimately, investors invest in asset classes they don’t fully understand and end up making losses or generating returns on their savings, which doesn’t even beat inflation in the long term.
This is where mutual funds can help you. When you invest in a mutual fund, you gain access to a team of seasoned investment professionals who analyse market trends, research companies, and make informed decisions on your behalf.
This expertise can be invaluable, especially for those without the time or resources to conduct in-depth research. Moreover, the mutual fund manager must help you generate better returns and beat the benchmark in the long term.
Gives the benefit of diversification
We all have grown up listening to this advice: Never put all eggs in one basket!
Therefore, diversification is the best way to reduce your risk. The art of “diversification” is a risk management technique that mitigates/reduces the portfolio’s overall risk by allocating investments across different financial instruments in multiple sectors, industries, and asset classes.
A mutual fund manager diversifies risk by choosing hundreds of stocks or bonds in the mutual fund portfolio, which spreads the risk across various sectors, industries, and asset classes.
The Risk is usually higher if mutual fund funds limit their exposure to any single stock in a particular sector in their overall portfolio versus having a well-diversified portfolio with a large number of stocks in its basket.
So, instead of being exposed to one stock, asset class, sector, or industry, the mutual fund portfolio is exposed to multiple stocks and asset classes.
Even mutual fund managers choose to diversify: over the years, some stocks in the portfolio may outperform and give magnificent returns, and some may underperform and give losses, but overall, the goal is that the entire portfolio of mutual funds grows significantly, giving the mutual fund investors consistency in returns in the longer term.
For example, the HDFC Top 100 Fund, one of India’s largest equity mutual funds, invests in over 100 companies in sectors such as IT, finance, consumer goods, and more.
A cost-effective way of maintaining your portfolio
Investing in individual stocks or bonds can be expensive, with brokerage fees and other transaction costs adding up quickly.
Mutual funds, on the other hand, allow you to invest in a diversified portfolio with relatively low costs. As per data from the Association of Mutual Funds in India (AMFI), the average expense ratio for equity mutual funds in India is around 1.5%, generally lower than the costs associated with building and managing a comparable portfolio of individual securities.
Not only this, but where else would you find a Fund Manager who works for you, helps you select stocks after doing extensive research, monitors your portfolio on a regular basis, and does whatever is necessary to help your money grow at such affordable costs?
Mutual funds allow you to choose mutual fund schemes that give you that benefit.
Higher transparency and highly regulated
As we have already learned in our previous chapters, mutual funds in India are regulated by the Securities and Exchange Board of India (SEBI), which enforces strict guidelines and disclosure norms. This regulatory oversight ensures transparency and provides investors with security and accountability.
In fact, SEBI has done a commendable job protecting the rights of investors over the years. They also take up various initiatives and run many education campaigns to spread awareness about how mutual funds work and the risks involved in investing in them. Indeed, this is a blessing for all mutual fund investors.
Something for everything
Mutual funds come in various categories, such as equity funds, debt funds, hybrid funds, and sector-specific funds. We shall discuss these in detail in the coming chapters. This variety allows investors to choose funds that align with their investment goals, risk tolerance, and time horizons.
For instance, investors seeking stable income can opt for debt funds, while those with a higher risk appetite may prefer equity funds. Some may choose a balanced approach and a mix of equity and debt funds. There are endless permutations and combinations that an investor opts for to grow their hard-earned savings through mutual funds.
With the above-discussed advantages, mutual funds can be an excellent starting point for beginners to build an investment portfolio while also providing experienced investors with the benefits of professional management, diversification, and a wide range of investment choices.
By investing in mutual funds, individuals can achieve their long-term financial goals while leveraging the expertise of seasoned professionals and enjoying the benefits of a well-diversified portfolio.
On this note, we end this chapter here. In the next chapter, we shall dive deeper into the subject of Mutual Funds and learn what types of mutual funds are available for investors.
Chapter 7: Types of Mutual Funds
Mutual funds in India are proliferating, and there’s no doubt about that, as we discussed at the beginning of this guide. There are 44 AMCs registered in India as of 2023, a few more in the process of getting their mandatory licenses to operate in the industry, offering more than 2500+ schemes to an Indian investor.
These numbers are increasing daily, thanks to financial engineering done by the AMCs that allows them to launch newer ways to invest for all the mutual fund investors.
Naturally, when so many available schemes exist, how can one select a scheme best suited for investments?
Well, don’t worry we shall cover this in our guide, and as a step towards achieving this goal, we first need to understand what are the types of Mutual Funds that are available and also understand how each of the schemes is structurally designed to meet various investment objectives of an investor.
There are 4 ways we can determine the types of mutual funds available to investors in India.
- Types of Mutual Funds – Based on categorization by SEBI
- Types of Mutual Funds – Based on organization
- Types of Mutual Funds – Based on portfolio management style
- Types of Mutual Funds – Based on investment objective
Let’s understand each type of categorization step-by-step.
Based on Categorisation by SEBI
Mutual fund AMCs use financial engineering to design and launch various new products or mutual fund schemes for investors. The problem is not with innovation; innovation has been the catalyst for growth in any field, hasn’t it?
The problem is that these newly designed schemes were being packaged/ bundled with various combinations of asset classes with fancy names, catching the attention of the investors through various marketing gimmicks. Almost every AMC in the last decade has lured investors to invest in hybrid schemes. Still, little or no attention was given to investor education on the risks associated with investing in such schemes.
Now, as these hybrid schemes have a combination of various asset classes, these schemes are difficult to understand and have increased risk, which most retail investors cannot gauge while subscribing to these funds.
So therefore, with an ultimate goal of making investments more accessible and with an objective that these schemes should be easily understood just by looking at the naming conventions that the scheme is being marketed with, SEBI came up with guidelines on categorization and Rationalization of schemes in October 2017.
Based on the SEBI guidelines on the Categorization and Rationalization of schemes, mutual fund schemes are classified as –
Equity Schemes – investing in stocks.
Debt Schemes – investing in fixed market instruments such as government or corporate bonds.
Hybrid Schemes – investing in a combination of asset classes (mix of equity & debt or a combination within the equity schemes)
Other Specific Schemes – such as Index Funds & ETFs and Fund of Funds
Solution-oriented Schemes – for retirement, etc.
Each of the above has subcategories in which SEBI clearly states the asset allocation and conditions (explained in the table below).
Debt Schemes
All open-ended schemes are allocated to equity markets.
|
Sr No |
Name of the Scheme |
Investment Portfolio |
Defined Asset Allocation |
|
1 |
Large Cap |
Large Cap Stocks |
Minimum 80% of total assets in equity or equity-related assets of large cap companies |
|
2 |
Large and Mid Cap |
Large & Mid Cap Stocks |
Minimum of total assets in equity or equity-related assets in the following manner –
|
|
3 |
Mid Cap |
Mid-Cap Stocks |
Minimum 65% of total assets in equity or equity-related assets |
|
4 |
Small Cap |
Small Cap Stocks |
Minimum 65% of total assets in equity or equity-related assets |
|
5 |
Multi Cap |
Across Large, Mid and Small-cap |
Minimum of total assets in equity or equity-related assets in the following manner –
|
|
6 |
Flexi Cap |
Across Large, Mid and Small-cap |
Dynamic allocation wherein a minimum 65% investment in equity and equity-related assets out of the total assets. |
|
7 |
Dividend Yield |
Stocks that give dividend yields |
Minimum 65% of total assets in equity or equity-related assets companies have dividend yields. |
|
8 |
Value or Contra Fund |
Invests in stocks with fundamentally sound companies but are currently at cheap valuations. |
Contrarian strategy, wherein a minimum of 65% investment in equity and equity-related assets out of the total assets. |
|
9 |
Focussed Fund |
A Maximum of 30 stocks in either Large, Mid, or Small Cap. |
Minimum 65% investment in equity and equity-related assets out of the total assets. |
|
10 |
Thematic / Sectorial Fund |
Invests in stocks for a particular sector |
Minimum 80% of total assets in equity or equity-related assets in companies of a specific sector. |
|
11 |
Equity Linked Saving Scheme (ELSS) |
Has a lock-in of 3 years, invests across. |
Minimum 80% of total assets in equity or equity-related assets. |
Debt Schemes
All open-ended funds having exposure in fixed instrument markets.
Sr No | Name of the Scheme | Investment Portfolio | Defined Asset Allocation |
1 | Liquid Fund | Overnight debt securities | Only in overnight securities having a maturity of 1 day |
2 | Overnight Fund | Debt and money market securities | Only in overnight securities with a maturity of up to 91 days. |
3 | Ultra Short Duration Fund | Debt and money market securities | Only in debt Instruments with a Macaulay duration between 3 and 6 months. |
4 | Low Duration Fund | Debt and money market securities | Only in Short term debt Instruments with Macaulay duration between 6 and 12 months. |
5 | Money Market Fund | Money market instruments | Only in Debt Instruments having maturity up to 1 year. |
6 | Short Duration Fund | Debt and money market securities | Only in Debt Instruments having Macaulay duration between 1 year and 3 years. |
7 | Medium Duration Fund | Debt and money market instruments with Macaulay’s portfolio duration are between 3 years to 4 years. | The fund has to ensure that the Portfolio Macaulay duration under any adverse expected situation is 1 year to 4 years |
8 | Medium to Long Duration Fund | Debt and money market instruments with Macaulay’s portfolio duration are between 4 years to 7 years. | The fund has to ensure that the Portfolio Macaulay duration under any adverse expected situation is 1 year to 7 years |
9 | Long Duration Fund | Debt and money market securities | Only in Debt and money market instruments with Macaulay duration greater than 7 years. |
10 | Dynamic Bond Fund | Debt and money market instruments across durations. | No limitations in Durations. |
11 | Corporate Bond Fund | AA+ and above rated corporate bonds. | Minimum investment in corporate bonds shall be 80% of total assets (only in AA+ and above rated corporate bonds) |
12 | Credit Risk Fund | Invests in the category below the highly rated corporate bonds | Minimum investment in corporate bonds shall be 65% of total assets only in AA-rated. (excludes AA+ rated corporate bonds) and below-rated corporate bonds). |
13 | Banking and PSU Fund | Investing in debt instruments of banks, Public Sector Undertakings, Public Financial Institutions, and Municipal Bonds. | The minimum investment in such instruments should be 80% of total assets. |
14 | Floater Fund | Invests in floating rate instruments, including fixed rate instruments, converted to floating rate exposures using swaps/derivatives. | A minimum of 65% of total assets should be in such assets. |
15 | Gilt Fund | Invests in government securities across maturity. | Minimum investment in G-secs is defined to be 80% of total assets across maturities. |
Hybrid Schemes
Sr No | Name of the Scheme | Investment Portfolio | Defined Asset Allocation |
1 | Aggressive Hybrid | Invests predominantly in equity and equity-related instruments. | Invests between 65% and 80% of total assets in equity or related schemes, while investment in debt instruments shall be between 20% and 35% of total assets. |
2 | Balanced Hybrid | Invests in equity and debt instruments | Invests in equity and equity-related instruments are between 40% and 60% of total assets, while investment in debt instruments is between 40% and 60%.
|
3 | Conservative Hybrid | A hybrid scheme investing predominantly in debt instruments. | Investing in debt instruments is between 75% and 90% of total assets, while investment in equity and equity instruments is between 10% and 25%. |
4 | Dynamic Asset Allocation / Balanced Advantage | A scheme that changes its asset allocation based on market scenarios | Investments in equity/debt are managed dynamically. |
5 | Multi-Asset Allocation | A scheme investing in at least three asset classes | A minimum allocation of at least 10% each in all 3 asset classes. |
6 | Arbitrage Fund | Discovers opportunities for investing in arbitrage opportunities | A minimum investment in equity and equity-related instruments shall be 65% of total assets. |
7 | Equity Savings | A scheme investing in equity, arbitrage, and debt. | The minimum investment in equity and equity-related instruments shall be 65% of total assets, and the minimum investment in debt shall be 10% of total assets.
|
Solution-Oriented Schemes
Sr No | Name of the Scheme | Investment Portfolio | Defined Asset Allocation |
1 | Children’s Education Fund | A fund meant to be created for a child’s future needs. | Standard compositions are similar to any of the funds discussed, but a lock-in of at least 5-year period is mandatory. |
2 | Retirement Fund | A fund is meant for long-term planning to acquire a corpus for retirement. | Standard compositions are similar to any of the funds discussed, but a lock-in period of at least 5 years is mandatory. |
The names of each category suggest the investment objectives. The table also suggests allocating the money that will be deployed into which asset class or combination of asset classes, thus providing complete transparency to the investors.
SEBI has done a fantastic job of Rationalising the Naming Conventions of all the schemes. There is indeed better clarity in understanding a mutual fund scheme just by reading its name, which is now self-explanatory after the implementation of the guidelines.
Some of the initiatives taken by SEBI to rationalize some of the categories.
The equity schemes category is further bifurcated into large, mid, and small cap categories. SEBI has also mandated threshold limits on the allocation of funds on a percentage basis within the schemes. This was a step towards standardizing all schemes based on categorization across all AMCs launching the same or similar schemes.
Further, to protect investors’ interests, SEBI has also ordered some scheme naming conventions, especially debt schemes, to be changed based on the risk level of the underlying portfolio. For example, the erstwhile ‘Credit Opportunity Fund’ is now called ‘Credit Risk Fund.’
Also, all ELSS funds must incorporate “ELSS and TAX SAVER“ to ensure consistency and easy identification for investors.
Some other changes such as balanced / hybrid funds are further categorized into
- Conservative Hybrid Funds
- Balanced Hybrid Funds
- Aggressive Hybrid Funds.
These initiatives have brought about a complete shift in the mutual fund industry, and such steps have made a great deal of transparency possible.
This is one way of understanding the types of mutual funds available in the mutual fund industry. SEBI’s guidelines have structured the mutual fund industry at large and are an attempt to regulate AMCs for the benefit of investors.
But as a layman retail investor, the above categorisation is just information and it may need some deeper understanding of financial markets to understand these schemes.
Based on Organization
As we learned, many schemes are available, but not all are structured similarly. Some schemes are available for purchase or sale at any point on a perpetual basis at the convenience of the investors. Then, some schemes are launched for a specific period (with a fixed maturity period) to which investors can subscribe.
There are 3 types of structures that the schemes are designed for.
Open-Ended Funds
This allows the investor to invest in the mutual fund scheme anytime after the launch of its NFO. Investors are also allowed to purchase any additional units if they wish to buy them after the launch, and they can also redeem fully or partly from the scheme as and when they wish to.
The unit capital, meaning the funds in the mutual fund scheme, will fluctuate as some investors invest or redeem the scheme, but the fund continues to operate with the existing investors who own the units issued by the AMC.
Most mutual fund schemes issued these days are open-ended since they provide greater liquidity and comfort to investors.
Close-ended Funds
These are schemes issued by the AMC for a particular period (having a fixed maturity). After the maturity period, the units are canceled, and the money is returned to the investors (including any gains or deducting losses, if any).
Investors cannot transact with the fund once the NFO is closed. However, after the NFO is closed, the fund issuing close-ended funds must list them on a stock exchange to provide some liquidity to its investors.
Those who wish to redeem the funds can go to the exchange and see if there are any buyers for the same scheme. If there are, they can give their units to the counterparty buyer.
Interval Funds
These are funds that combine open-ended and closed-ended funds. Interval funds are largely open-ended, meaning they are open for investors to buy or redeem for a specific time interval, such as a few days in a month, and then they are closed for transactions.
The period when interval funds become open-ended is called the transaction period, and when the funds are closed for transactions, that period is termed the Interval Period.
Unlike closed-ended funds, interval funds provide better liquidity since investors need not depend on an exchange to look for potential buyers or sellers for entry or exit opportunities.
Based on the investment objectives
Mutual funds can also be classified based on the investment objective that an investor ought to seek.
There are three main objectives that an investor seeks while investing in mutual funds are:
- Growth – to compound their savings for long-term wealth creation.
- Income – to get regular income from their capital/savings.
- Liquidity – to park any excess funds for the short term.
Mutual funds help investors cater to all the above objectives that an investor is looking for, and there are various mutual fund schemes explicitly designed to achieve these individual goals. Indeed mutual funds offer a customized solution to fulfil every objective of an investor.
To seek the above-mentioned objectives, an investor can choose from the following categories of funds-
Growth Funds
These are funds that have higher exposure to equity markets since the objective of the fund is to create wealth in the long term. As we know, the power of compounding works wonders in the long term in the equity markets. Investors seeking wealth creation should consider investing in funds that have higher growth potential in the long term. ( you can refer to the equity schemes mentioned in the previous chapter for reference)
Income Funds
Income funds help an investor earn a regular, fixed income for the medium to long term. Investors seeking this objective should invest in medium—to short-term debt funds that have exposure to fixed money market instruments such as bonds, Gsecs, etc. A risk-averse investor can choose to deploy capital into Income funds, wherein a fixed return is generated on the invested amount, thereby creating a regular income for the investor.
Liquidity Funds
Liquidity funds are funds that have exposure to ultra-short-term money market instruments and are used by investors to park their surplus money or keep their emergency funds invested. A risk-averse investor who needs to park his/her money for a very short-term goal that they wish to fulfil or create an emergency fund value and keep it invested just to assure some liquidity can use liquid funds.
So you see the universe of mutual funds is vast, and the mutual fund houses cater to all the needs of an average retail investor so that every Investor can certainly plan the finances better.
Mutual funds do provide a great deal of flexibility to retail investors. They can use a combination of the above funds and create their own financial plan based on their risk profile.
In the next chapter, we will learn to evaluate how to a mutual fund.
Chapter 8: How to Evaluate a Mutual Fund
In the dynamic landscape of investments, mutual Funds stand out as a popular choice for both seasoned investors and newcomers seeking diversified portfolios.
But as we all know, like all investments, Mutual funds are subject to market risk. A mutual fund’s performance is based on the interplay of various factors that determine whether it will outperform the markets or underperform.
The performance of a Mutual Fund is not merely a result of chance or luck. Still, it is shaped by many variables, ranging from economic indicators to the strategies deployed by fund managers. From market trends and macroeconomic conditions to the fund’s asset allocation and management style of investing, each component plays a pivotal role in determining the fund’s trajectory.
By unraveling these factors, investors can gain valuable insights into how Mutual Funds operate within the broader financial ecosystem and make educated choices tailored to their investment objectives.
In this chapter, we’ll explore the complexities influencing Mutual Funds’ performance, shedding light on the different aspects of the fund’s performance matrix.
Factors that affect the performance of a mutual fund
Here are some key elements that influence how well or poorly a mutual fund performs:
Management of the Mutual Fund
The skill, experience, and investment philosophy of the fund manager(s) play a crucial role in a mutual fund’s performance. A skilled manager with a well-defined investment strategy can generate better returns by making informed decisions about which securities to buy or sell and when to make those transactions.
Consider a mutual fund manager as a Formula 1 driver. A well-trained F1 driver who manages to navigate the race track cautiously under all weather conditions will emerge as a winner at the finish line. Similarly, a fund manager capable of managing a fund under all market conditions has a better chance of outperforming the markets. A better chance, for lack of a better word, since no one can predict the market movements accurately and consistently every single time.
Therefore, it is important to know about the fund manager’s past track record in fund management before selecting a mutual fund, as the fund only performs if the fund manager performs well.
Prevailing Market Conditions
The overall state of the markets, including factors like economic growth, interest rates, inflation, and geopolitical events, can significantly impact a mutual fund’s performance. Funds invested in stocks tend to perform better during periods of economic expansion and market rallies, while debt funds may benefit from falling interest rates. It is, therefore, important to know market cycles and keep track of the overall economic conditions while choosing a fund based on the investment objectives.
A good mutual fund managed by an extremely talented and competent fund manager may still not perform if the market conditions are unfavorable. Similarly, a decent fund with a capable fund manager and a good track record may outperform the markets if the conditions are favorable.
Asset Allocation of the Portfolio
The asset allocation strategy of a mutual fund, which refers to the proportion of investments in different asset classes (e.g., stocks, bonds, cash), can affect its performance. Asset Allocation decides a mutual fund’s volatility and the potential return outcome for its investors.
Funds with a more aggressive asset allocation towards equities may experience higher volatility but potentially higher returns over the long run. In contrast, conservative funds with a higher allocation to fixed-income securities may be less volatile but generate lower returns.
How crucial is asset allocation for a mutual fund manager managing a mutual fund?
Since asset allocation determines the fund’s risk-return profile and its sensitivity to market fluctuations, different asset allocations can lead to varying performance levels under different market conditions. Choosing the right asset allocation saves the fund from higher volatility and gives these fund managers an edge against its peers (competing mutual funds).
Comprehending asset allocation is also crucial for investors seeking to gauge and optimize a mutual fund’s performance.
Sector/Industry Exposure
For certain sector-specific or industry-focused mutual funds, aka thematic funds, the performance of the underlying sector or the industry can significantly influence the fund’s returns. For example, an IT fund’s performance will largely depend on how well the technology sector performs during a given period.
Sector-specific funds are usually high-risk funds. Depending on the industry’s performance, they either outperform their investors or underperform for the longest period of time. That’s because markets move in cycles, and not all sectors may outperform at the same time.
Also, higher dependency on a sector attracts higher volatility since the fund is prone to Unsystematic risk, which is the risk of having higher volatility due to any negative news for the industry.
Expense Ratios, Excessive Churning & Impact Costs
As we have discussed, the expense ratio represents the annual fees charged by the fund for management and administrative expenses. These charges can impact the fund’s returns.
All else being equal, funds with higher expense ratios may underperform compared to those with lower expense ratios. Although expense ratios don’t have a major impact on a mutual fund’s performance in the short term, in the longer term, they can significantly compound, leading to vast differences in the performance matrix for investors.
Other expenses, like higher brokerages due to high portfolio churning, meaning a fund manager who keeps buying and selling stocks in the portfolio on a frequent basis, could lead to transaction costs. This can also impact the fund’s performance, as ultimately, the costs are deducted from the NAV, thus lowering the overall performance.
Higher impact costs are another variable that can impact a fund’s overall performance. A fund that invests in illiquid stocks or stocks with low volumes could face higher impact costs while investing in them. Low volumes could increase the “spread,” meaning the difference between the buying and selling prices, and the variance could be even more if the number of buyers and sellers is less in that stock. This ultimately impacts the purchasing or selling price, ultimately affecting the overall performance of a fund.
Tracking Error (for Index Funds)
For index funds, which aim to replicate the performance of a specific market index, the tracking error – the difference between the fund’s returns and the index’s returns – can impact performance. Funds with lower tracking errors are more efficient in replicating the index’s performance.
Tracking error is usually caused by factors such as a fund manager’s inability to buy the assets/stocks of the underlying index, sudden movements that increase the volatility in the stocks, or low liquidity in the stocks of the underlying index.
The best index funds have the least tracking error, showcasing the efficiency of the fund manager.
Fund Size and Cash Flows
The size of a mutual fund and the inflows and outflows of investor money can affect its performance too. Larger funds may find it harder to maintain their agility in buying and selling securities, while significant redemptions can force fund managers to sell holdings, potentially impacting performance.
So these are some of the factors that can affect the overall performance of mutual funds.
By understanding these factors, investors can make more informed decisions when selecting and evaluating mutual funds for their investment portfolios. Regular monitoring and analysis of a fund’s performance, considering these elements, can help investors ensure that their investment goals are being met.
Several statistical tools and metrics can help track and evaluate a mutual fund’s performance. Here are some commonly used tools…
Mutual Fund Evaluation Metrics
- Returns
- Risk
- Risk-Adjusted Returns
- Peer Group Comparison
- Portfolio analysis.
1. Returns
The simplest and greatest way to evaluate the performance of a mutual fund before investing is to evaluate and compare the returns. You can use the following to evaluate a mutual fund scheme with its peers:
- Annualized Returns: This measures the fund’s average annual return over a specified period, allowing you to compare its performance against benchmarks or other funds.
- Compounded Annual Growth Rate (CAGR): This metric shows the annual growth rate of an investment over a specific period, considering the compounding effect of reinvested dividends or capital gains.
Indeed, the greater returns a fund generates, the better it is for investors, but following only returns in isolation could be a mistake, simply because past performance may not guarantee future returns.
Therefore, we need to evaluate returns based on the risk that a fund is taking to generate returns for its investors.
2. Risk Metrics
These statistical tools will help us gauge how much risk a mutual fund manager is undertaking to deliver the overall performance or returns.
- Standard Deviation measures the volatility or risk associated with a fund’s returns. A higher standard deviation indicates higher fluctuations in returns and thus, higher risk.
- Beta: Beta measures the fund’s volatility about the overall market. A beta of 1 indicates that the fund moves in sync with the market, while a beta of less than 1 suggests lower volatility, and a beta greater than 1 implies higher volatility.
3. Risk-Adjusted Performance Metrics
As we discussed earlier, choosing a mutual fund solely based on past performance could be misleading since past performance does not guarantee future returns.
So, how do we evaluate which fund to choose? The answer lies in comparing the funds based on their risk-adjusted returns.
Risk-adjusted Returns simply means that in a given period , when you compare the performance of 2 funds, we need to understand which fund has taken the least risk to generate the same or more returns.
The fund that generates the same or more returns but takes lesser risks shows the efficiency of the fund management and the capability of the fund manager who is generating the returns for its investors. Therefore, a risk-adjusted performance metric can help investors make an optimal decision while choosing a fund to invest their savings.
Here are some of the risk-adjusted performance metrics that you can use –
- Sharpe Ratio: This ratio measures the fund’s risk-adjusted returns by dividing the excess returns (over the risk-free rate) by the standard deviation. A higher Sharpe ratio indicates better risk-adjusted performance.
- Treynor Ratio: This ratio is similar to the Sharpe ratio, but it uses beta instead of standard deviation as the risk measure, making it more suitable for diversified portfolios.
- Alpha: Alpha measures the fund’s performance relative to its expected return based on its level of risk. A positive alpha indicates that the fund has outperformed its benchmark, while a negative alpha suggests underperformance.
By using risk-adjusted performance metrics, you can gauge investment quality simply because they can allow you to filter riskier investments from less risky ones and help you invest without any uncertainty.
4. Peer Group Comparison
Peer group comparison is one way to evaluate a fund’s performance. It’s also a relative analysis tool that helps you gauge a fund’s performance.
- Category Returns: Comparing a fund’s returns to the average returns of its peer group (e.g., large-cap equity funds, mid-cap funds, etc.) can provide insights into its relative performance.
- Category Rank: This ranks a fund within its peer group based on various performance metrics, allowing you to assess how it fares against similar funds.
You may also use the risk metrics in the peer comparison method to refine your research.
5. Portfolio Analysis
This metric allows you to gain insights into the intricacies. It gives you insights into how the mutual fund portfolio is structured in terms of the asset mix and also allows you to determine the efficiency of the fund management.
Portfolio Turnover Ratio: This measures the frequency of a fund’s buying and selling of securities within a given period, providing insights into the fund manager’s investment strategy and potential impact on transaction costs.
Concentration Ratios: These ratios, such as the concentration of the top 10 holdings, measure the degree of diversification within the fund’s portfolio.
By analyzing these metrics, investors can understand a mutual fund’s performance, risk profile, and how it compares to its peers and benchmarks. These statistical tools can be found on Dhan’s mutual fund platform and in the fund fact sheets or reports provided by fund houses.
This concludes this chapter. In the next chapter, we will discuss how you can choose the best mutual fund for yourself!
Chapter 9: How to Choose the Most Suitable Mutual Fund
The Indian mutual fund industry stands among the world’s finest, boasting over 40 asset management companies (AMCs) and a rapidly expanding array of over 1500 schemes. With such abundance, the challenge for today’s investors shifts from mere participation to prudent selection.
It’s widely acknowledged that mutual funds offer substantial potential for wealth creation over the long term. However, the critical question remains: which fund suits your unique financial objectives?
Navigating this decision can be daunting, as your financial goals hinge on the performance and suitability of your chosen mutual fund. To mitigate this complexity and reduce stress, a data-driven approach is indispensable. By leveraging factual insights and key parameters, you empower yourself to make informed decisions that align with your investment goals.
This chapter delves into the essential considerations and methodologies that will equip you to select mutual funds effectively, ensuring your investments are tailored to your needs and aspirations.
When selecting the optimal mutual fund tailored to your needs, the initial step is assessing its historical performance. However, since mutual funds are subject to market risk, past performance can never guarantee future returns, and therefore, only using quantitative data such as past returns of the funds is not enough.
Therefore, we must adopt a methodical, data-driven process for filtering the best mutual funds based on certain approaches.
The Dual Approach
A dual approach to analyzing qualitative data, such as the integrity of a fund house, the track record of the fund managers, and quantitative data of risk vs. returns, will equip you to make a superior-quality and well-informed decision.
The best part is that you can use these approaches every single time in your selection process. They will aid you in making superior-quality decisions that cater to your needs. Additionally, applying these approaches will help you identify and steer clear of funds that may raise concerns.
Let us explore them first and then look at how we incorporate these data points in our research and design a selection process to choose the Best Mutual Fund for You.
Quantitative Measures :
This encompasses analysing the past performance of the chosen scheme, the level of risk undertaken to achieve returns, and a thorough examination of the fund’s associated costs.
1. Historical Returns
Using Historical returns shows us how well a fund has performed over time. They are typically categorized into:
– Short-term returns (1-3 years)
– Medium-term returns (3-5 years)
– Long-term returns (5+ years)
While past performance doesn’t guarantee future results, it can indicate consistency and the fund’s ability to weather different market conditions.
2. Risk Metrics
Using risk metrics like the following will help you understand the volatility and potential downside of a fund:
- Standard Deviation: Measures the fund’s volatility. A higher standard deviation indicates greater fluctuations in returns.
- Sharpe Ratio: Evaluates risk-adjusted returns. It shows how much excess return you receive for the extra volatility of holding a riskier asset.
- Beta: Measures a fund’s sensitivity to market movements. A beta of 1 means the fund moves in line with the market, while a beta greater than 1 indicates higher volatility than the market.
When you combine past returns with risk metrics, you learn how much risk the same category fund managers are taking to generate returns on the fund. This information helps you eliminate funds and assess the caliber of the fund manager managing the fund.
3. Expense Ratio
It helps you understand how much money is being invested and what charges you pay to the mutual fund AMCs that manage your money.
The expense ratio represents the annual cost of operating the fund, expressed as a percentage of its assets. It includes management fees, administrative costs, and other operating expenses. A lower expense ratio means more of your money is invested.
4. Assets Under Management (AUM)
AUM is a key data point when analyzing a mutual fund scheme. It represents the total market value of assets that a mutual fund manages. While a large AUM can indicate investor confidence, it may limit a fund’s flexibility.
Conversely, a very small AUM might suggest that the fund hasn’t gained widespread acceptance or lacks economies of scale.
Using this in your research process and all the above data points can help you navigate and narrow down on funds for further research.
Qualitative Measures:
This involves evaluating the mutual fund house managing the schemes, including their track record, investment philosophies, management pedigree, and overall credibility. Once you have filtered out the funds based on quantitative analysis, you should use this approach to fine-tune your decision-making process.
1. Fund Manager Experience
Just as a captain of a ship knows how to manage his ship in all weather conditions and reach his final destination safely, a fund manager’s expertise, track record, and tenure are crucial to know while selecting a mutual fund. After all, your financial goals are aligned with the performance of the fund, and a fund manager is the captain of your ship who is responsible for helping you reach your goals.
It’s always better to seek a fund manager who has seen it all, as this equips him to make informed decisions, especially during turbulent times.
An experienced fund manager is better equipped to navigate various market conditions and make sound investment decisions, which could generate higher returns while also handling volatility.
2. Investment Philosophy
The Investment Philosophy in mutual funds refers to the guiding principles that shape the fund’s investment strategy. It could be value investing, growth investing, or a blend of styles.
Understanding the investment philosophy is crucial when choosing a mutual fund to invest your savings since your financial goals align with the mutual funds in which you choose to invest. Indeed, this helps ensure that the fund’s approach aligns with your investment goals.
It’s important to board a flight that reaches your desired destination, isn’t it?
3. Fund House Reputation
As we have learned, Mutual fund Houses, aka AMCs, are the trustees that hire mutual fund managers to invest money on behalf of the investors. The Asset Management Company’s (AMC) reputation can provide insights into its reliability, consistency, and commitment to investor interests.
Factors to consider should include the AMC’s history, regulatory compliance record, and overall performance across different fund categories. This builds trust and fuels the confidence to be associated with the mutual fund house for the long term.
4. Portfolio Composition
Once you have considered all the above data points, it’s also important to check the portfolio composition of the mutual fund schemes you choose to invest in.
Portfolio Composition refers to the mix of securities within the fund. It includes the types of assets (stocks, bonds, etc.), sector allocation, and individual security weightings.
The portfolio composition should align with the fund’s stated objectives and your risk tolerance. Any variance in the composition is a red flag, so it helps you eliminate the universe you discover from the quantitative data analysis.
Based on the above-discussed approaches to data, here’s a framework that integrates both aspects to guide your decision-making process effectively:
Actionable Steps for Choosing the Best Mutual Fund
1. Define Your Investment Goals and Risk Tolerance
- Clearly articulate your financial objectives (e.g., retirement, child’s education)
- Assess your risk tolerance (conservative, moderate, aggressive)
- Determine your investment horizon (short-term, medium-term, long-term)
2. Research and Shortlist Funds
Apply the above combination of approaches to filter out schemes that stand out.
You may use online fund screeners to filter funds based on your criteria.
After which, create a list of 10-15 funds that match your investment goals and risk profile
3. Analyze Historical Returns
Now Compare the shortlisted funds’ returns over 1, 3, 5, and 10-year periods (if available). Check how the funds have performed compared to benchmark indices and category averages.
Pro Hack
Look for consistency in performance across different time frames and look for funds that have managed to outperform the industry average returns in the same category.
4. Evaluate Risk Metrics
Compare the standard deviation of shortlisted funds with category averages. Assess the Sharpe ratio to understand risk-adjusted returns. Look at the beta to gauge how volatile the fund is compared to the market.
Compare them with the industry average and look for funds that have managed to get above-average returns, considering the risk taken to achieve those returns.
5. Examine Expense Ratios
- Compare expense ratios within the same fund category. You need an apple to apple comparison while looking at the options.
- Calculate the impact of expense ratios on long-term return. Consider whether higher expenses are justified by superior performance.
6. Consider Fund Size (AUM)
Check if the fund size aligns with its investment strategy. Further, consider the fund size to understand whether the sheer size does not impact the fund returns. For example –
For equity funds, ensure the AUM isn’t too large to become unmanageable. On the flip side, for debt funds, a larger AUM might indicate better negotiating power for good deals
7. Assess Fund Manager and Team
Research the fund manager’s experience and track record
Look into the stability of the fund management team
Check if the same manager has delivered consistent performance across different funds
8. Understand the Investment Philosophy
Read the fund’s factsheet and investor communications
Ensure the fund’s investment approach aligns with your goals and beliefs
Check if the fund has stayed true to its stated philosophy over time
9. Investigate Fund House Reputation
Research the AMC’s history and standing in the industry
Check for any regulatory issues or investor complaints
Assess the overall performance of other funds from the same AMC
10. Analyse Portfolio Composition
Review the fund’s top holdings and sector allocations
Ensure the composition aligns with the fund’s stated objectives
Check for any concentration risks (e.g., over-reliance on a few stocks or sectors)
11. Check for Consistency
Look for funds that have performed consistently across different market cycles
Be wary of funds that show extreme performance swings
12. Consider Tax Implications
Understand the tax treatment of different types of mutual funds. Factor in the after-tax returns when comparing funds
13. Read Scheme-Related Documents
Go through the Scheme Information Document (SID) for detailed information.
Review the Key Information Memorandum (KIM) for a quick overview
14. Start Small and Monitor
As a general practice, begin with a small investment to test the waters. Once you get comfortable with your choice of fund, scale up as per your budget. Regularly review the fund’s performance and rebalance as needed.
15. Seek Professional Advice if Needed
If you’re still unsure, consult a financial advisor for personalized guidance. Remember that professional advice can be particularly valuable for complex investment decisions
Following these steps, you can choose mutual funds aligning with your financial goals and risk tolerance. Remember, the key is to make informed decisions based on comprehensive research and to regularly review your investments to ensure they continue to meet your evolving needs.
With this, we come to an end! In the next chapter, we shall learn and decode how to start investing in mutual funds, discussing the eligibility, onboarding process, and ways to invest in SIPs, SWPs, and lump sums.
Chapter 10: How to Start Investing in Mutual Funds?
We started our learning journey by understanding the history of mutual funds and how it has evolved in India. Later we learned how a mutual fund works and the types of Mutual funds available today to deploy your savings and invest them for wealth creation.
Mutual Funds allow you to kick-start your investing journey with relative ease since this instrument is so easy to understand. And the best part is, you can start investing in Mutual funds with as low as 100 Rs a month and increase it gradually as and when you can step up.
Yes, you heard it right! There’s no maximum limit but you can simply start your investing journey with as low as 100/- per month with mutual fund investing. Whether you’re a student or a salaried employee, a seasoned businessman or a homemaker – Mutual funds are the most affordable, efficient and systematic way to start with your financial planning journey.
By choosing a mutual fund you deploy your hard-earned savings into funds that invest in various underlying assets thereby diversifying your risk. The funds you choose to invest in are managed by professional fund managers who are highly trained and experienced and will be deploying your money after doing a lot of research and analysis.
All this and that too at a super affordable cost and now simply with a click of a button at the comfort of your home, office or any place in the world.
In this chapter, we are going to discuss how you can start your mutual fund investing journey.
Eligibility
If you are looking to apply for mutual funds, make sure you fulfill the following requirements for Mutual Fund investments of the platform/banks that you choose
Here is the eligibility criterion for mutual funds:
- The applicant can be an Individual, Non-Resident Individual (NRI), Hindu Undivided Family, or a Corporate Entity (rules and regulations and documentation process may differ)
- The applicant needs to be KYC-compliant
- Should have a Savings Bank Account & its status has to be Single or Either/Survivor.
- For all the non-individual categories – (certain rules and regulations are applicable which we shall discuss some other time)
KYC - Know Your Customer
What is KYC (know your customer), you may ask?
KYC or Know Your Customer is a customer identification process. The Securities and Exchange Board of India (SEBI) has laid down guidelines under the Prevention of Money Laundering Act 2002, which makes it binding for financial institutions and financial intermediaries like mutual funds to acquaint themselves with their customers.
The KYC process helps prevent money laundering and other suspicious transactions. With effect from January 1, 2012, all categories of investors irrespective of amount of investments in mutual funds are required to comply with KYC for carrying out any transactions in Mutual Funds.
Thus, all applicants investing into mutual funds would be required to be KYC compliant by any KYC Registration Agency (CAMS, KARVY, CVL, NSE or NSDL) without which the transactions may be liable to be rejected by the respective mutual fund houses.
Please note KYC norms are mandatory for ALL applicants/investors (including existing investors and joint holders) while investing with any SEBI registered mutual Fund, irrespective of the amount of investment.
Ways to Invest in Mutual Funds
Here’s how you can start.
Step 1
You can invest in mutual funds by submitting a duly completed application form along with a cheque or bank draft at the branch office or designated Investor Service Centres (ISC) of mutual Funds or Registrar & Transfer Agents of the respective mutual funds.
OR
You may also choose to invest online through the websites of the respective mutual funds.
OR
You may invest with the help of/through a financial intermediary i.e., a Mutual Fund Distributor registered with AMFI, or choose to invest directly i.e., without involving or routing the investment through any distributor.
A mutual fund distributor may be an individual or a non-individual entity, such as a bank, brokering house, or online distribution channel provider.
PS – To get higher returns you can choose direct investing of mutual funds through Dhan!

Dhan is one of the top platforms that offers more than 10000+ Direct Schemes that too with Zero Transaction Fee or Brokerage. With Dhan, you can generate higher returns by choosing direct funds which have very low costs.
Step 2
Let’s say you choose the Dhan to get started after submitting all the documentation as prescribed. You’re all set to getting started.
The platform gives you an array of options to choose from and not only this, the app also filters the 10000+ schemes into various categories for you which you can choose to narrow down on funds which suit you the best.
You can choose to invest in funds:
- That have generated higher returns in the past 5 years
- That are top rated schemes by various reputed agencies like Morning Star
- That are simple like index funds, large cap funds, or liquid funds
Just one click on these tabs and the platform sorts all the data for you at your disposal.
Dhan also offers you to explore. You can discover over 1000+ schemes that fall under various categories based on the underlying asset.
For example, the app filters all the equity funds for you. If you’re looking for funds that can help you to save taxes, just explore the Tax Saver category and the app will display all the fund options to choose from.
Similarly, you can filter funds in categories like Debt, Hybrid, etc., all in one single screen!
The app also allows you to discover which mutual fund companies are coming up with a New Fund Offering and you can also invest in them through the app itself. Gone are those days when you had to fill up forms and submit them to the nearest centers or your mutual fund distributors.
New Fund Offering
A New Fund Offer (NFO) marks the launch of a new mutual fund scheme, inviting investors to subscribe to its units at an initial price.
Some more Features – The app also Filters the mutual fund schemes by the Top AMCs so if you wish to choose your favorite AMC and look at all the schemes they have to offer, just click on the AMC tab and everything will be on display!
They say time is money and the app helps you save a lot of time as you can bookmark your favorite mutual fund scheme while you conduct your research and review it later. Not only this, but all the financial statements that you may need later are also seamlessly generated with just a click.
Let’s now understand the 2 ways in which you can choose to start investing in mutual funds.
Lump sum investing
Once you choose the fun , choose the amount you want to invest and then just make payments from your preferred mode of payment. Your transaction gets through and the app does the needful to process your transaction, at zero cost.

SIP (Systematic Investment Plan) investing
This is ideal if you wish to choose a scheme and invest in that scheme systematically at periodical intervals ( you can choose your SIP Interval – daily, weekly, monthly….)
Let’s say you want your money to be deducted every month and on the 10th day of every month – simply select the amount, choose the date of the month and choose the preferred mode of payment and it’s done.
The 1st instalment will follow through but what you will also need is a bank mandate.
The mandate allows the bank to automate your investments. A bank mandate is a process that allows the bank to auto-debit your monthly instalments.
Once you set the mandate – the app also shows your monthly upcoming installments and the total SIPs (if you have more than 1 schemes in which SIPs are active)
Conclusion
Investing in mutual funds has never been so easy, all thanks to these new age tools that seamlessly allows you to invest in mutual funds without any hassle.
In the next chapter we shall understand how to track your mutual fund post investing.
Chapter 11: How to Track Mutual Fund Performance?
Investing in mutual funds is akin to embarking on a financial journey. While we have learned in our previous chapter how to choose a vehicle (the fund) and a driver (the fund manager), your role as an investor doesn’t end at making the initial investment. Actively tracking your mutual fund’s performance is crucial.
When we say active tracking, that means tracking the performance of the mutual fund regularly. The ideal time frame for tracking the mutual funds you have invested in should be balanced meaning not too frequently and certainly tracking it at least once in your holding period.
Before we delve into how to track mutual fund performance, let us see why you should actively monitor your mutual fund investments.
Goal Alignment Check
Regular tracking helps ensure your investments remain aligned with your financial goals, which may evolve. Making sure that the mutual funds you have selected are on track to help you achieve your financial goal is a prudent act for your future financial planning.
Risk Management
By monitoring performance, you can assess whether the fund’s risk level continues to match your risk tolerance. Although shorter-term volatility can be ignored if your holding period is long-term, a sound check on the fund manager’s activity regularly can certainly alert you on how well the risk is being managed from time to time in different market conditions.
Learning opportunity for future investments
Tracking performance enhances your understanding of market dynamics and investment principles. Regular Tracking also means you get better at understanding which funds are best for you and which ones to avoid. So when there’s surplus cash/savings that you want to deploy in the future, decision-making becomes super easy for you.
Better and Informed Decision-Making
Tracking provides the data needed to make informed decisions about holding, selling, or buying more of a fund. Tracking the performance of your funds also gives you the confidence and the ability to invest in turbulent market conditions – that’s a superpower that you develop because you understand how the mutual fund performs in variable market conditions.
Regular monitoring can help you identify potential issues early, allowing for timely corrective actions, and making superior-quality financial decisions for the future seems quite easy.
Convinced on the fact that monitoring your funds could be super helpful for you. Now at the beginning of the chapter, we spoke about having a balanced time frame for tracking your mutual funds.
So the question is, how often should you track mutual fund performance?
The frequency of tracking should strike a balance between staying informed and avoiding knee-jerk reactions to short-term market fluctuations. Here’s a general guideline:
- Daily Tracking: Not recommended for most investors. Daily NAV changes can occur as most asset classes are volatile on an intraday basis. Therefore checking your mutual funds daily can lead to unnecessary stress or impulsive decisions.
- Weekly Review: Well, it’s suitable for more active investors or those in volatile funds. Still, these investors need to be cautious about overreacting to short-term movements.
- Monthly Review: A good frequency for most investors. It provides regular updates without encouraging over-analysis. A monthly review could work the best for investors having a 3 to 5-year time horizon, who are looking to accumulate a corpus for their shorter-term goals with mutual fund investing like vacation planning, buying a car, etc.
- Quarterly: Ideal for long-term investors. Quarterly reviews allow you to see meaningful trends while avoiding short-term volatility. Long-term investors using mutual funds as a vehicle to fulfill their long-term goals child education or marriage, retirement planning etc. can adopt a monthly review system.
- Annually: This is the bare minimum each investor should consider. At a minimum, at least once, all investors should conduct a thorough annual review of their mutual fund investments.
Very important to remember, that the appropriate tracking frequency may vary based on your investment strategy, the type of funds you hold, and your personal preferences. Long-term equity funds generally require less frequent monitoring compared to more volatile or short-term-oriented funds.
Regardless of your chosen frequency, it’s crucial to have a systematic approach to tracking. And therefore we now dive into how you can track mutual fund performance. This guide will provide you with the tools and knowledge to effectively monitor your mutual fund investments, ensuring you stay on course toward your financial goals.
Mutual Fund Tracking Metrics
Here’s a comprehensive and practical guide on how to track mutual fund performance.
Understand Key Performance Indicators (KPIs) of mutual funds.
Before diving into tracking, familiarise yourself with these essential KPIs:
- Net Asset Value (NAV): The per-unit market value of the fund.
- Total Return: Combines capital appreciation and dividend payments.
- Alpha: Measures a fund’s performance against its benchmark.
- Beta: Indicates the fund’s volatility compared to the market.
- Sharpe Ratio: Evaluates risk-adjusted returns.
- Expense Ratio: Annual fee charged by the fund.
These KPIs are the basis on which you can monitor your fund performance on a regular basis.
Using Online Tools and Platforms
Leveraging technology to simplify tracking is a smart way to be highly efficient, isn’t it? Here are some tools you can use to gather data, insights, and KPIs (as discussed earlier) that keep track of your mutual fund investing.
- Fund House Websites: Most AMCs provide detailed fund information.
- Financial Portals: Websites like Dhan which offer comprehensive data and comparison tools.
- AMFI Website: The Association of Mutual Funds in India provides official NAV and other data.
- Mobile Apps: Many apps offer real-time tracking and notifications.
Prepare a Regular Review Schedule
Establish a consistent review routine that makes your monitoring activity just another day at work :
- Weekly/Monthly: Review short-term performance and any significant changes.
- Quarterly: Conduct a thorough analysis of performance, holdings, and any strategy shifts.
- Annually: Perform a comprehensive portfolio review and rebalancing if necessary.
Compare Against Benchmarks!
How do you know whether your fund is outperforming? Compare it against the benchmark index!
Always evaluate your fund’s performance relative to its benchmark. That’s the only way you can gauge the fund manager’s ability to deliver superior performance amongst the competition.
Here’s what you need to do!
- Identify the correct benchmark for each fund (e.g., Nifty 50 for large-cap funds).
- Compare returns over various periods (1-year, 3-year, 5-year, etc.).
- Look for consistent outperformance over longer periods.
Analyze Portfolio Holdings
Regularly review the fund’s portfolio to check whether the fund you have chosen aligns with its stated objectives.
- Here’s what you should pay attention to:
Check top holdings and sector allocations – look out for any anomalies. - Ensure the portfolio aligns with the fund’s stated objectives.
- Look for any significant changes in investment strategy.
Monitor Fund Manager Changes
Every fund manager has a different approach to managing the fund. Therefore keep an eye on the fund management. Be aware of any changes in the fund manager managing your fund. In case there is a change, make sure you research the new manager’s background and the past track record.
Remember the Fund Manager is the driver and you should be sure that your driver knows how to drive well and that the vehicle is in safe hands!
Stay Informed About Market News
Context is crucial for understanding performance. Understanding how macroeconomic factors might impact your investments is going to help your entry and exit strategy.
Use Performance Metrics Wisely
There is no such thing as a perfect system strategy or approach that you can stick to while tracking your mutual funds. Don’t rely on a single metric instead use a combination of data points to conclude.
- Short-term Returns: Useful for gauging recent performance but can be volatile.
- Long-term Returns: More indicative of consistent performance.
- Risk-adjusted Returns: Consider metrics like Sharpe Ratio for a balanced view.
When you consider all this and evaluate your funds’ performance, you are more likely to make a better quality decision than using just one metric.
Setting Up Alerts
Use technology to stay informed. There’s no need for actively monitoring your portfolio, instead use alerts as an effective way for tracking!
Set up email or mobile alerts for significant NAV changes.
Create notifications for important fund-related news or announcements.
This way you will never miss an important update, negative or positive and you can choose to take the right action at the right time!
Maintain a Personal Tracking System
Although tools and technology can help you build an efficient system for monitoring your fund performance, a good practice can be to develop your method of record-keeping.
- By using spreadsheets or investment tracking apps.
- Recording purchase dates, amounts, and periodic performance.
A good method to actively manage your funds!
Regularly Reassess Your Goals
Performance tracking should align with your investment objectives. Periodically review if the fund still meets your financial goals and is up to your desired expectations. Assess if your risk tolerance has changed and if the fund still aligns with it.
Reassessing your goals at periodic intervals helps you in your long-term financial planning.
Seek Professional Advice When Needed
Don’t hesitate to consult experts if you’re unsure about interpreting data or making decisions based on performance. For complex portfolios or when significant life changes affect your investment strategy. Advisors are seasoned professionals who can be hired and you can easily delegate the responsibility to them. Seek periodic assessments of your portfolio and ask them to do all the research on your behalf to help you achieve your financial goals.
Remember, while regular tracking is important, avoid making impulsive decisions based on short-term fluctuations. Mutual fund investments are typically best suited for long-term wealth creation.
In the next chapter, we shall learn how mutual funds are taxed!
Chapter 12: How are Mutual Funds Taxed?
Navigating the world of mutual fund investments can be complex, and understanding their tax implications is crucial for both novice and experienced investors. This chapter demystifies the taxation of mutual funds in India, providing you with the essential knowledge to make informed investment decisions and optimize your returns.
Mutual fund taxation in India is multifaceted, varying based on factors such as the type of fund, holding period, and the investor’s tax bracket. Whether you’re considering your first mutual fund investment or looking to refine your existing portfolio, grasping these tax nuances can significantly impact your overall financial strategy.
In the following sections, we’ll explore the different categories of mutual funds from a tax perspective, delve into capital gains taxation for various fund types, and uncover the benefits of indexation. We’ll also discuss dividend taxation, securities transaction tax, and special considerations for famous tax-saving schemes like ELSS.
By the end of this chapter, you’ll have a comprehensive understanding of how mutual funds are taxed, enabling you to align your investment choices with your financial goals while keeping tax efficiency in mind.
We’ll also share tax-efficient strategies that can help you maximize your after-tax returns. The examples shared here are by no means to be considered any financial or tax advice and are solely for education. Do ensure you consult your financial and tax advisors who can help you with the subject.
Remember, while tax considerations are important, they should be balanced with other factors such as risk tolerance, investment objectives, and overall portfolio strategy.
This chapter will explain the key aspects of mutual fund taxation in India for the financial year 2024-25, catering to both beginners and experienced investors.
Let’s dive in and demystify mutual fund taxation!
Taxation Explained
Taxation Categories
Mutual fund taxation in India is primarily determined by the fund’s asset allocation. The three main categories for tax purposes are:
- Equity Funds: Funds with 65% or more investment in equity and equity-related instruments.
Examples: Most equity-oriented schemes, including large-cap, mid-cap, small-cap funds
Special inclusion: Arbitrage funds, despite their lower risk profile - Debt Funds: Funds with less than 35% investment in equity.
Examples: Gilt funds, corporate bond funds, liquid funds, ultra-short duration funds - Hybrid Funds:
These are further divided into three sub-categories:
Hybrid Fund Type | Equity Allocation | Tax Treatment |
Conservative Hybrid | Less than 35% | Same as debt funds |
Balanced Hybrid | Between 35% and 65% | Debt funds with indexation benefit |
Aggressive Hybrid | More than 65% | Same as equity funds |
Capital Gains Taxation
- Equity Funds:
Fund Category
Short-term Capital Gains (STCG): Held for ≤ 12 months
Long-term Capital Gains (LTCG): Held for > 12 months
Equity Funds
Tax rate: 15% + applicable surcharge and cess
Tax rate: 10% on gains exceeding ₹1 lakh per financial year (without indexation)
- Debt Fund:
Fund Category
Short-term Capital Gains (STCG): Held for ≤ 36 months
Long-term Capital Gains (LTCG): Held for for > 36 months
Debt Funds
Tax rate: As per the investor’s income tax slab
20% with **indexation benefit + applicable surcharge and cess
- Hybrid Funds:
As discussed in point 1 c) (you can refer to this )
**Indexation Benefit Explained
Indexation adjusts the purchase price for inflation, reducing the taxable gain. Applicable to debt funds and hybrid funds with 35-65% equity exposure when held for more than 36 months.Example: With Indexation
Example: Without Indexation
Investment: ₹100,000
Value after 3 years: ₹127,000
Inflation over 3 years: 15%
Indexed cost: ₹100,000 x 1.15 = ₹115,000
Taxable gain: ₹127,000 – ₹115,000 = ₹12,000
Tax payable (at 20%): ₹2,400
Investment: ₹100,000
Value after 3 years: ₹127,000
Inflation over 3 years: 15% ( no relevance when it comes to taxation )
Cost therefore remains: ₹100,000.
Taxable gain: ₹127,000 – ₹100,000 = ₹27,000
Tax payable (at 20%): ₹20,800
Tax payable with Indexation Benefit = ₹2,400
Tax payable with Indexation Benefit = ₹20,800
Add Your Heading Text Here
- Dividends are taxable in the hands of investors at their applicable income tax slab rates
- TDS of 10% is applicable on dividend payments exceeding ₹5,000 in a financial year
Securities Transaction Tax (STT)
- Applicable on the sale of equity-oriented mutual fund units: 0.001% (payable by the seller)
- Not applicable on the purchase of mutual fund units or sale of debt fund units
Special Considerations in Taxation
a) ELSS (Equity-Linked Savings Scheme)
– Qualifies for tax deduction up to ₹1.5 lakh under Section 80C
– Subject to a lock-in period of 3 years
– Taxed like other equity funds after the lock-in period
b) International Funds
– Treated as debt funds for taxation purposes, regardless of underlying assets
Tax-Efficient Strategies
Mutual fund investing is subject to taxation as we discussed and that’s the reason being aware of how taxation applies to your investments in mutual funds can give you creative ways to minimize your tax liability and you can maximize your returns.
After all, money saved is money earned, isn’t it? And therefore if you understand how taxation is applicable, you can make informed decisions and save taxes smartly. Here are some ways explained for education purposes only:
a) Long-term investing: Holding debt funds for more than 3 years can significantly reduce tax liability due to indexation benefits.
b) LTCG harvesting: As we have learned the taxation laws exempt us from tax on capital gains up to 1 lakh rupees every financial year in equity funds. You may consider booking gains up to ₹1 lakh annually to utilize the tax-free limit. One problem year could be exit loads being applicable and thus you need to ensure that if you try this method, the LTCG harvesting is a profitable option or not.
Again these are some of the ways you can consider but after a thorough evaluation and consultation from a tax expert or conducting your research before you come to any conclusion.
The point of explaining this is to highlight that if you can track your mutual funds systematically, you can try and maximize your gains and minimize your losses.
Some other important notes for investors:
- Tax laws are subject to change; stay updated with the latest regulations. While tax efficiency is important, it shouldn’t be the sole factor in investment decisions.
- Consider your investment goals, risk tolerance, and overall portfolio strategy when selecting mutual funds.
- For complex tax situations or large investments, consult a tax professional or financial advisor
Taxation as per Investing Style
So now that we have simplified the taxation laws for you. Further, let’s take some practical examples of 3 most common ways investors choose to invest in mutual funds and let’s see how taxation works in the following cases:
- Lump Sum Investing.
- SIPs
- SWPs
Let’s use an equity mutual fund for our examples, as it’s a common choice for many investors.
Scenario 1: Lump Sum Investing
Mr. Sachin has a lump sum of money to invest and he chooses to invest the entire money in an equity-oriented mutual fund
Let’s say he invests a lump sum of ₹100,000 on April 1, 2024.
On March 31, 2026 (after 2 years), his investment value grew to ₹130,000.
So how would the Tax Calculation work here for Mr Sachin:
– Holding period: More than 1 year, so it’s Long Term Capital Gain (LTCG)
– Capital Gain: ₹130,000 – ₹100,000 = ₹30,000.
But wait, what did we discuss, capital gains > 1 lakh is tax-free. Therefore,
– Taxable amount: ₹30,000 – ₹1,00,000 (LTCG exemption) = ₹0
– Tax payable: ₹0 (as the gain is within the ₹1 lakh annual exemption limit)
Mr. Sachin is not liable for any tax gains!
Scenario 2: SIP - Systematic Investment Plan
Let’s say Mr Rohit invests ₹10,000 monthly for 24 months starting April 1, 2024.
Total investment: ₹240,000
On March 31, 2026, his investment value reached ₹280,000.
Tax Calculation:
– Each SIP installment is considered a separate investment
– Some units will be held for more than 1 year (LTCG), others for less (STCG)
– Let’s assume ₹200,000 worth of “units “qualify for LTCG and ₹80,000 for STCG
Particulars | LTCG portion | STCG portion: |
Value at March 31, 2026 | ₹230,000 | ₹50,000 |
Cost of units on April 1, 2024. | ₹200,000 | ₹40,000 |
Gain | ₹30,000 (₹230,000 -₹200,000) | ₹10,000 (₹50,000-₹40,000) |
Tax | ₹0 (within ₹1 lakh exemption) | Total tax payable: ₹1,500( 15%*₹10,000) |
Scenario 3: SWP - Systematic Withdrawal Plan
Let’s say Mr Mahi invested ₹500,000 lump sum on April 1, 2024, and started a monthly systematic withdrawal of ₹10,000 from April 1, 2025.
By March 31, 2026, you’ve withdrawn ₹120,000 (12 x ₹10,000).
Assuming the fund value on March 31, 2026, is ₹450,000.
Tax Calculation:
Total withdrawal | ₹120,000 |
Original cost of units sold | Let’s assume it’s ₹100,000 |
Capital gain = Total withdrawal – Original cost of units sold | ₹120,000 – ₹100,000 = ₹20,000 |
Holding period | More than 1 year, so it’s LTCG |
Tax payable by Mr Mahi | ₹0 (as the gain is within the ₹1 lakh annual exemption limit) |
Key Points to Remember
- In lump sum investing, the entire investment is considered as a single transaction for tax purposes.
- For SIPs, each installment is treated as a separate investment, potentially resulting in a mix of STCG and LTCG.
- In SWPs, each withdrawal may consist of both your principal and gains. The gain component is subject to taxation.
- For equity funds, LTCG up to ₹1 lakh per financial year is tax-free. Gains above this are taxed at 10% without indexation.
- STCG on equity funds is taxed at 15%.
- For debt funds, the taxation would be different, with STCG taxed at slab rates and LTCG taxed at 20% with indexation benefits.
These examples demonstrate how the mode of investment and withdrawal can impact your tax liability. It’s always advisable to consult with a tax professional for personalized advice based on your specific financial situation.
Conclusion
Understanding mutual fund taxation is essential for optimizing your investment returns. By considering the tax implications of different fund categories and holding periods, you can make more informed decisions about your mutual fund investments.
Remember that while tax efficiency is important, it should be balanced with other factors such as risk, returns, and alignment with your financial goals.
With this we come to an end on this chapter. In the next chapter, we shall discuss whether mutual funds are safe for investing. What are the risks involved in mutual fund investing
Chapter 13: How Safe are Mutual Funds?
Mutual funds have become a popular investment choice worldwide due to their potential for diversification, professional management, and accessibility for individual investors. However, like any investment, mutual funds come with their own set of risks and considerations. This chapter delves into the safety of mutual funds, both in general terms and within the specific context of India. We’ll explore why mutual funds are generally considered safe and examine the particular risks and safeguards associated with investing in Indian mutual funds.
Why Are Mutual Funds Safe for Investors?
Mutual funds are usually considered safer than direct equity investing because
Add Your Heading Text Here
Mutual funds pool money from many investors to invest in a diversified portfolio of stocks, bonds, and other securities. This diversification helps spread risk, as the performance of any single security has a limited impact on the overall portfolio.
Managed by professionals
Mutual funds are managed by professional fund managers who have the expertise and resources to make informed investment decisions. These managers conduct extensive research and analysis to select securities that align with the fund’s objectives.
Regulation and Oversight
Mutual funds are subject to stringent regulatory oversight. In most countries, including India, regulatory bodies such as the Securities and Exchange Board of India (SEBI) set rules and standards to protect investors and ensure transparency and fairness.
The license to run a mutual fund house is given after due diligence similarly as banks get the banking license. In short, a mutual fund house is as safe as a bank.
Liquidity
Mutual funds typically offer high liquidity, meaning investors can buy and sell their units easily. This is particularly true for open-ended funds, which allow investors to redeem their units at any time at the current net asset value (NAV).
Affordability
Mutual funds allow investors to start with relatively small amounts of money, making it easier for individuals to begin investing and benefit from diversification and professional management.
Anyone who is looking to start their investing journey or is looking for a systematic way to deploy their savings for wealth creation can use Mutual funds as a tool.
How Safe Are Mutual Funds in India?
In the Indian context, mutual funds are considered relatively safe due to several factors, including regulatory oversight, transparency, and the evolving maturity of the financial markets. However, investors should be aware of specific risks that may impact their investments.
Regulatory Framework
SEBI is the primary regulator of mutual funds in India. SEBI’s regulations ensure that mutual funds operate transparently and fairly. These regulations cover various aspects such as fund management, disclosure requirements, and investor protection measures. For instance, SEBI mandates that mutual funds disclose their portfolio holdings, performance, and risk factors, enabling investors to make informed decisions.
A mutual fund is a trust and a trust manages the money independently.
As discussed in Chapter 2, as per the SEBI (Mutual Fund) Regulations, 1996 as amended to date, “a mutual fund” is defined as “a fund established in the form of a trust to raise monies through the sale of units to the public or a section of the public under one or more schemes for investing in securities including money market instruments or gold or gold-related instruments or real estate assets.” Further, the regulation states that the firm must set up a separate Asset Management Company (AMC) to run a mutual fund business.
The above definition clearly states that Mutual funds are constituted as Trusts and they are governed by the Indian Trusts Act, 1882, and its operations are governed by a Trust Deed, which is executed between the sponsors and the trustees.
Since an AMC is a separate company that manages the money that is received by the trust through investors, there is a great deal of transparency that has to be maintained at all times as legal action can be taken if the government or the apex body SEBI finds any discrepancy.
Role of AMFI - Association of Mutual Funds In India
The Association of Mutual Funds in India (AMFI) is a non-profit industry body of the asset management companies (AMCs) of all Mutual Funds in India that are registered with the Securities and Exchange Board of India (SEBI).
AMFI is dedicated to developing the Indian mutual fund industry on professional, healthy, and ethical lines, and to enhancing and maintaining standards in all areas in the best interest of investors and other stakeholders.
Our robust regulatory framework along with all the support from AMFI has made mutual funds one of the highly transparent and highly secured investment avenues for retail investors in India.
Time and again, various awareness campaigns and investor awareness programs are being conducted as a step towards promoting Mutual funds as a preferred choice of new-age and first-time investors.
We all know the ‘Mutual Funds Sahi Hai’ campaign has brought about a wave of new-age investors into the mutual fund industry and the adoption of mutual funds in every household today seems to be growing rapidly.
Conclusion
While mutual funds in India offer a relatively safe investment avenue compared to direct stock or bond investments, they are not without risks. The key to successful mutual fund investing is to understand these risks, align investments with one’s risk tolerance and financial goals, and stay informed about market and economic conditions.
Regulatory oversight by SEBI, transparency in operations, and the diverse range of mutual fund options available in India provide a framework that helps mitigate risks and protect investors.
By being aware of the specific risks involved and making informed decisions, investors can effectively harness the benefits of mutual funds to achieve their financial objectives.
Swing and Positional Trading Strategies Guide
Got your basics right? Now, start trading with these simple swing and positional trading strategies.
Chapter 1: Introduction to Trading Strategies
Now that you know all about the basics of technical analysis, it’s time to combine all the knowledge and get to the real deal – trading with a strategy.
What is a trading strategy?
A trading strategy is a plan that helps you decide when to buy or sell in the market. It’s like following a roadmap during a trip—you know where you want to go, and the strategy helps you stay on track to reach your goal. Like a roadmap shows the best route, a trading strategy guides you based on price movements, trends, and risk management.
For example, the strategy might tell you to buy a stock when its price breaks above a certain point or sell if it drops to a specific level. The idea is to make decisions based on a clear plan instead of reacting emotionally to market ups and downs.
Before we dive into the strategies, let’s understand how to make the best of this guide.
How to go about this guide?
This guide lists five trading strategies most suitable for swing and positional trading styles. Ideal for beginners, these are a good starting point that will help you determine your trading style—you will get an idea of what kind of indicators and time frames you are most comfortable with.
Each strategy is divided into 7 sections,
- Overview, which will introduce you to the logic behind the trading strategy
- Indicators used in this strategy, which will list out the indicators that enable the application of the strategy
- Spotting an entry, which will help you determine an entry point for your trade
- Planning the exit, which will help you determine an exit point for your trade
- Stop loss, where you will learn about how to manage your risk as per the strategy
- Examples, which will show you how the strategy can be put to action, and
- A Things to keep in mind section, which will enlist the precautions you should take while deploying the strategy
Note that these strategies are just trading ideas that have worked for years. However, that doesn’t mean that they are totally foolproof. Hence, you can be flexible with them. We also suggest you not deploy your entire trading capital towards a single strategy but rather spread them across.
Chapter 2: Monthly 89-EMA Strategy
Overview
Now that you have understood the importance of having a clear trading strategy to make money in the market, we can develop one by watching the market over time. In this chapter and the next ones, we’ll go over some tried-and-true strategies that can help us trade profitably.
In this chapter, we will start with positional strategies, which trade on significantly more extended time frames. We’ll see how a simple exponential moving average indicator can guide us on market entry and exit points. This strategy is more suitable for those who can handle temporary market fluctuations, typically long-term investors who hold positions for several years.
This strategy is more suitable for trending markets that show clear, sustained trends, whether in a bull or bear market, because, in sideways markets, frequent crossovers can be misleading. So, we should maintain a clear stance on the market’s direction.
Let’s uncover our first exponential moving average positional strategy.
Indicators used in this strategy
Before we dive into the positional strategy, let’s first look at the indicator we’ll be using: the exponential moving average (EMA). In this strategy, we are using a single indicator, the EMA. Unlike the simple moving average, the EMA gives more weight to recent price changes, making it more responsive to current market conditions.
EMA_today=(Pricetoday×K)+(EMA_yesterday×(1−K)) K=smoothing constant
More in-depth explanation about EMA here
We will compare the exponential moving average close with the candlesticks open, high, low, and close(OHLC) to determine the entry and exit signals in the market
Spotting an entry
We are using a monthly timeframe to plot our exponential moving average indicator. The core principle behind this strategy is that the stocks that we pick by using have to be fundamentally strong and can survive any crash either in it or the overall market.
The secret ingredient we’ll use is the 89-EMA plotted on a monthly timeframe. Here, each candlestick represents the entire month’s OHLC (Open, High, Low, Close) data, and our exponential moving average is calculated based on this monthly timeframe.
We’ll discuss our entry points in a bull market, as this strategy is best suited for trending markets.
Since we’ll be going long on the stock, it’s crucial to identify bullish candlestick patterns like the bullish engulfing and bullish marubozu. These patterns can signal upward solid momentum. (Read more about bullish candlesticks here)
Before using the strategy to spot an entry, we need to make sure that the closing price for the 89-month EMA is more significant than zero. This shows that the stock has enough trading history and stability. Sticking to Nifty 500 stocks can ensure our portfolio contains well-established companies with reliable data.
We can buy the stock based on either the high or low candlestick. First, let’s focus on the monthly low. We should consider buying the stock if it meets either one of the following conditions:
- The monthly low is less than or equal to the 89-month EMA of the monthly close.
- The monthly low is less than or equal to 105% of the 89-month EMA of the monthly close.
Here, we are using a 5% slight buffer in our strategy, meaning the monthly low is 1.05 times the 89-EMA. This adds more validation by acting as a strong support, making it more reliable for a long trade.
- The monthly high is greater than or equal to the 89-month EMA of the monthly close.
- The monthly high is greater than or equal to 95% of the 89-month EMA of the monthly close.
Just like the monthly low, we have a similar condition for the monthly high. The 95% level acts as a threshold to enter the trade slightly earlier, helping us capture more on the upside.
Let’s start with an example. First, apply the 89-EMA on the trading view terminal and switch to the monthly timeframe.
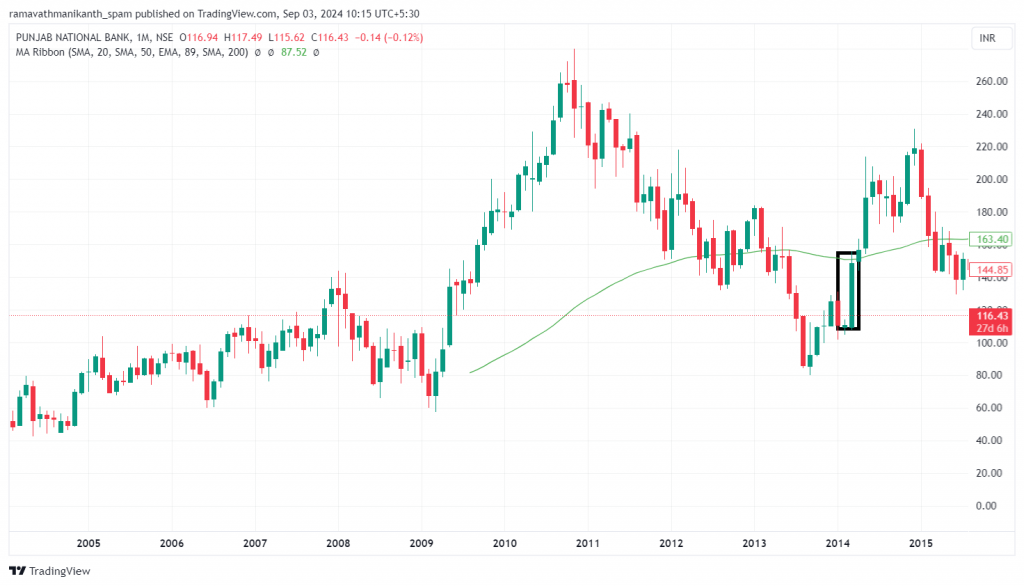
As seen in the above chart, just before the highlighted region, a bullish candlestick formed after PNB Ltd closed near the 89-EMA, indicating upward momentum in the stock. This could be a potential entry point in the market.
Ideally, we should enter the stock at the end of the month when the first candlestick crosses above the 89-EMA on the monthly time frame.
To be on the safer side when taking an entry, we should consider entering the stock only when a bullish candlestick closes above the high of the candlestick that triggered our initial entry signal. This confirmation strategy helps us reduce the likelihood of false breakouts and increases the probability that the trend is genuinely shifting in our favor, providing a more reliable entry point.
Planning the exit
Now that we are clear about the conditions for entering the stock let’s move on to when to exit. It’s crucial to know when to exit because if the stock crashes suddenly, we risk losing our capital.
-We will close our position in the stock if a bearish candlestick, such as an inverted hammer, bearish marubozu, evening star, or the formation of a lower low, appears at the 89-EMA.
– Another condition is if the stock price consolidates, followed by the formation of a bearish candlestick.
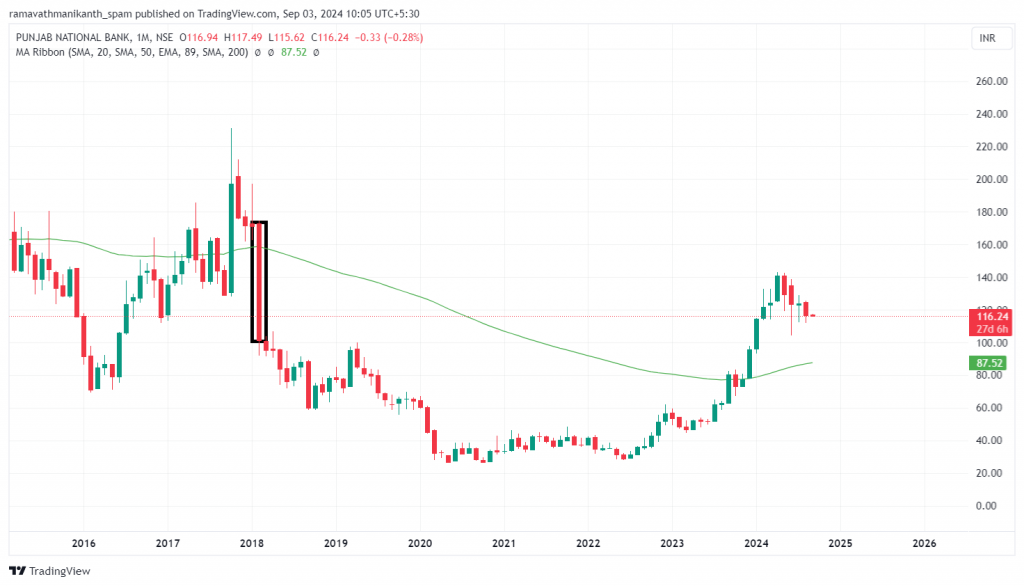
In the above example of PNB Ltd, the appearance of a significant bearish candlestick pattern, such as a bearish marubozu, combined with the continuation of lower lows, serves as a solid signal to consider exiting the position.
Another essential point to remember is that if our holding period exceeds five years, the 89-EMA becomes the sole signal for exiting. We must follow this to ensure we exit the strategy if there’s a significant shift in the long-term trend.
For our next trade, if a particular resistance level is frequently rejecting the stock, it indicates a potential reversal from that point. We can then assume that the resistance level is our target for the following trades.
Stop loss
To set a stop loss for our strategy, one approach is to use the 89-EMA as a stop loss of the position, turning it into a trailing stop loss, allowing you to stay in the position until the stop is triggered.
If the price closes below the 89-EMA, it is a clear sign to exit, indicating that the stock is losing momentum. This makes it essential to keep the 89-EMA as your stop loss.
Another approach is to move the stop loss to a specific resistance level if the strategy shows strong momentum, breaking resistance with bullish candlesticks and high volume. This method can be used if you prefer to avoid following the 89-EMA.
Examples
Let’s look at a clear example of the 89-EMA positional strategy. Below is Wipro’s chart for the monthly time frame in which our strategy was applied.
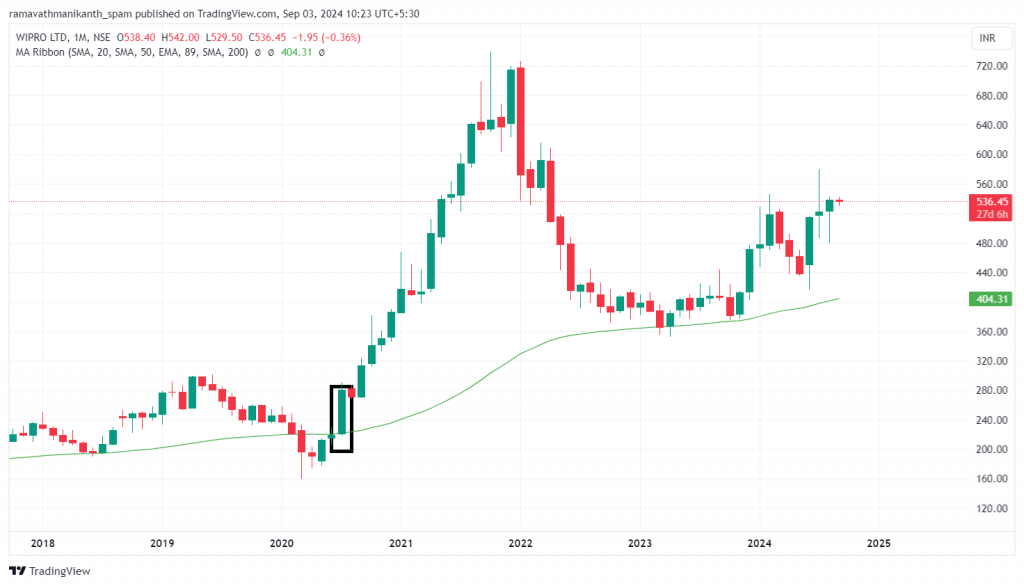
Our 89-EMA strategy triggered an entry on 1st July 2020 with a bullish marubozu, a bullish candlestick indicating intense buying pressure in the stock, which was a key criterion for entering the position.
The exit was identified by the formation of a solid bearish candlestick after a consolidation channel, which formed at the top of the rally on 3rd January 2022. Here is the pictorial representation of it.
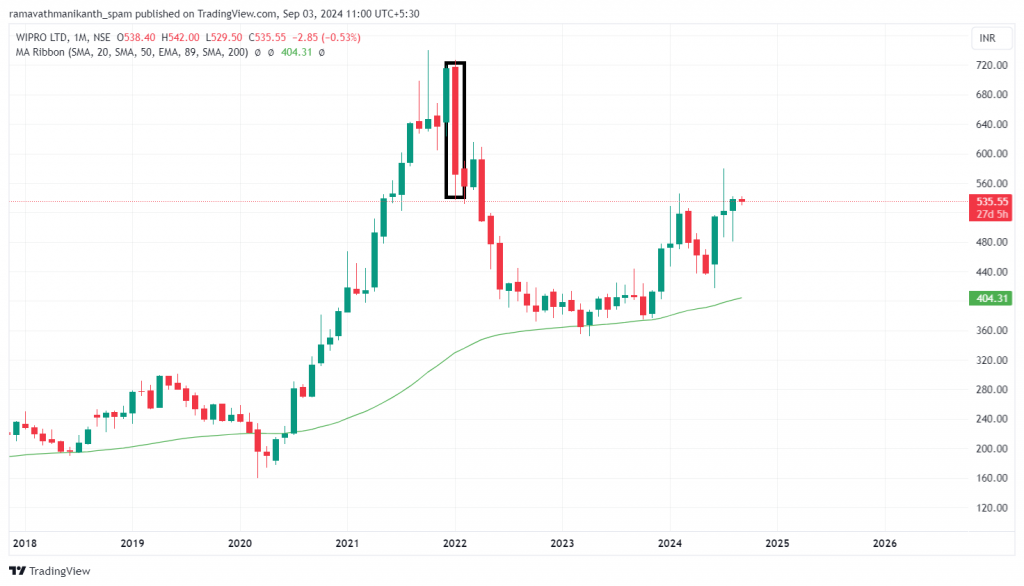
In the above example, a bearish engulfing pattern formed after the rally, indicating selling pressure. This trade lasted for 551 days, and the positional strategy yielded a return of 104%.
Things to keep in mind
- The 89-EMA positional strategy works best on monthly time frames for most stocks, as it captures the long-term trend while filtering out short-term volatility and noise.
- This strategy is effective in predicting long-term movements but can expose the portfolio to risks if market conditions change, making the strategy less effective.
- It performs well in trending markets but may lead to stagnation or losses if the market becomes sideways or choppy, as it is not suited for non-trending phases.
- Volume can be a valuable indicator for both entry and exit points in this strategy. Plotting the average volume of the last 20 bars on the trading chart helps gauge buying or selling pressure.
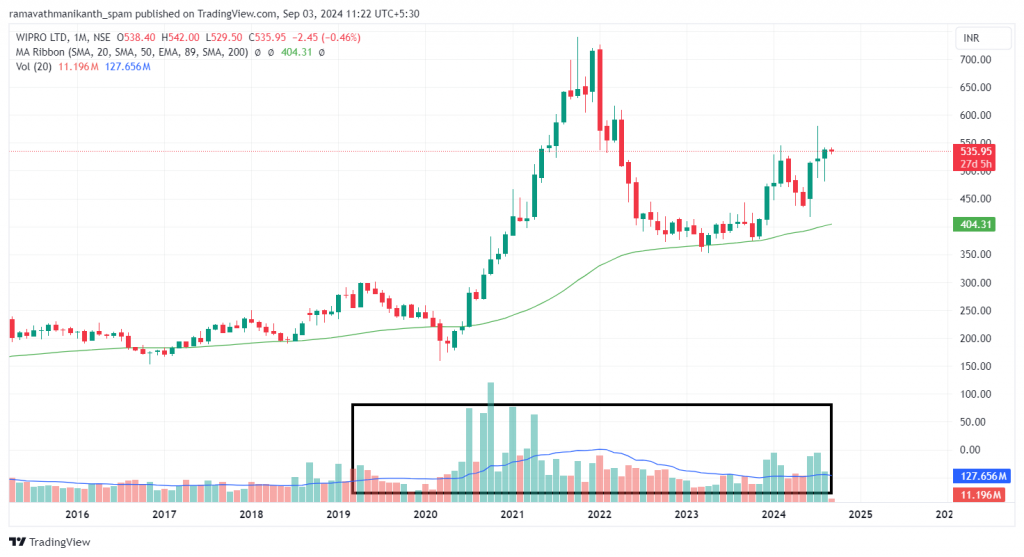
Chapter 3: Stochastic RSI+Supertrend Strategy
Overview
In the previous chapter, we explored a positional trading strategy built around the exponential moving average (EMA) as a key technical indicator. Now, we will move on to another strategy that is versatile and suitable for all types of trading, including intraday, swing, and more extended time frames.
This strategy combines two powerful indicators: the stochastic RSI, a momentum oscillator that helps identify trends and predict potential reversals, and the super trend indicator, which assists in identifying the current market trend.
This strategy is particularly effective when a stock gains short-term momentum and is suitable for swing, positional, and intraday trading. Known as the ‘loss recovery strategy,’ a term coined by one of our experienced instructors, it works across different time frames.
Swing, positional, and intraday traders can benefit from this strategy. While it generates few signals, they are highly accurate, leading to trades that can last from days to several months, with a higher success rate across different time frames.
Let’s now explore the indicators we will use in this strategy.
Indicators used in this strategy
Similar to the RSI, It provides insights into trends and helps identify potential market reversals. This indicator is called the stochastic RSI because the oscillator’s values are calculated using the RSI rather than the stock price. It consists of two lines, %K and %D, which are effective in assessing overbought and oversold conditions. Here’s how %K is calculated:
%K = ((C – L14) / (H14 – L14)) × 100
%D = SMA(%K, 3)
Where:
C = Current close price
L14 = Lowest price in the last 14 periods
H14 = Highest price over the previous 14 periods
SMA(%K, 3 ) = 3-period simple moving average of the %K values.
The stochastic RSI is measured on a scale from 1 to 100. If the value is below 20, the market is considered oversold, and if it’s above 80, it is considered overbought, similar to the traditional RSI. When the two lines, %K and %D, intersect, it can signal a potential market reversal, indicating that the trend may be about to change direction.
In our strategy, we are modifying the stochastic RSI inputs by setting the stochastic oscillator length to 140, %K to 30, and %D to 30. The reason for this adjustment is to smooth out the signals, reduce noise, and ensure that only more robust, more reliable trends are identified.
The next indicator we are going to combine with stochastic RSI is the supertrend. It helps indicate the market direction by combining the average true range (ATR) with a multiplier, giving us a value that provides insights into market trends and direction.
The supertrend, based on price action and volatility, provides straightforward entry and exit points and enhances the trading strategy’s accuracy and efficiency. Check out more about super trend indicators here.
Here is a pictorial representation of inputs of both indicators

Spotting an entry
On a daily timeframe, we apply both the stochastic RSI and the super trend to generate entry and exit signals in the market. For a long trade entry, here is the checklist:
– The stochastic RSI value should be below 20, indicating a potential oversold condition in the market.
– An entry is triggered when %K crosses above %D, signaling a possible trend reversal.
– The supertrend indicator must be in the bullish zone, with all candles appearing above the green line.
The core idea behind the crossing of %K and %D is that slow stochastic K% crosses above D%, which indicates bullish momentum strengthening, potentially signaling a buy signal as it suggests the current price is rising faster than the average over recent periods.
Since this strategy is also suitable for intraday trading, we can short-sell or short futures based on the following checklist:
-Stochastic RSI value should be above 80, indicating an overbought condition.
-%K crosses below %D, signaling a potential downward trend.
The supertrend indicator should be in the bearish zone, with all candles appearing below the red line.
The supertrend helps in identifying the market direction, whether bullish or bearish, and plays a crucial role in setting stop-loss levels for our trades.
Just like in our previous strategy, we ensure that we are selecting stocks with a market capitalization above 1000 Cr. This helps in focusing on more liquid and stable stocks for better trade execution.
Now, we will look at our first example, which is Reliance.
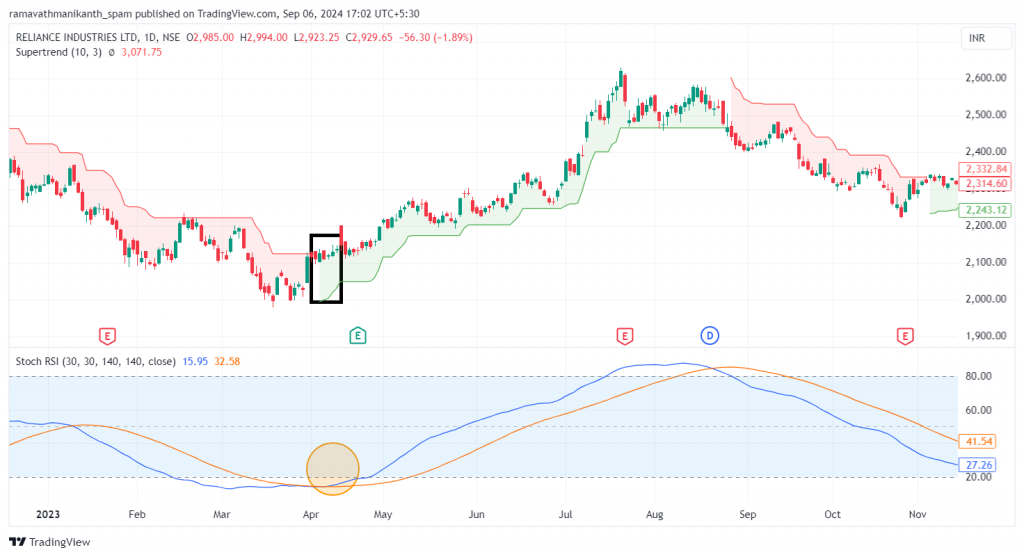
Planning the exit
The exit for this strategy is the exact opposite when taking a bullish stance on the stock value:
– We wait for the stochastic RSI value to reach 80, indicating an overbought zone.
– An exit is triggered when %K crosses below %D.
– The supertrend shifts to the bearish zone, with the formation of bearish candles.
This setup mirrors the conditions for a short trade entry, meaning when the market takes an opposite stance, we must also exit our current bullish position.
For the same example of Reliance, the exit will look like this.
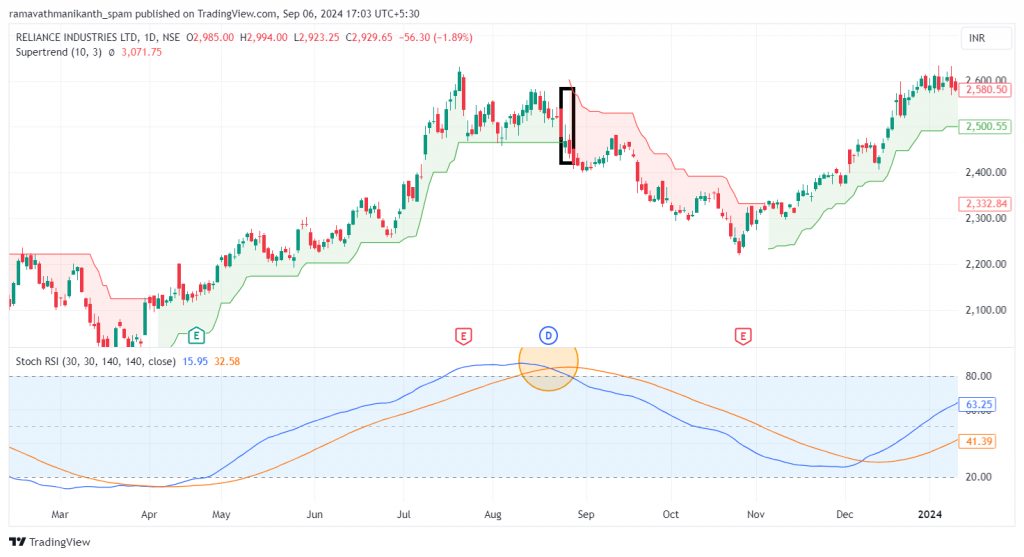
In the above example, as soon as the supertrend turns red, indicating a bearish signal, we exit our position. Additionally, it’s essential to keep an eye on the crossover of the stochastic RSI. The combination of both these signals provides a clear indication for an exit.
Stop loss
In this strategy, we use the supertrend as our trailing stop loss. This allows us to lock in profits while protecting against significant losses as it trails behind the price. The super trend adjusts automatically during periods of higher or lower volatility, reducing the risk of premature exits.
Additionally, it helps traders avoid making emotional decisions in volatile market conditions, providing a more structured approach to managing trades.
Examples
Here, our strategy gave entry into Ushamart’s daily time frame. Below is the chart of it.
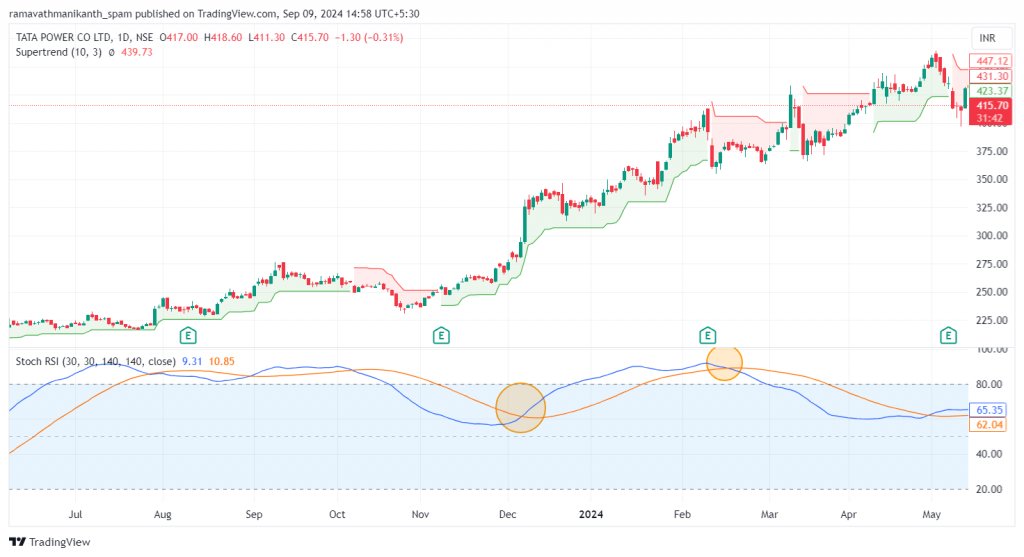
In the case of Tata Power, while the super trend indicator signaled a bullish entry, we held off until the two lines of the stochastic RSI crossed, confirming the momentum shift.Stochastic+RSI, the strategy, gave entry on 6th December 2023.
In the same image, the exit is highlighted by the stochastic RSI indicator. The bearish candles hit our stop loss, and the supertrend indicator turned red, signaling bearishness in Tata Power. This was our cue to exit.
This gave returns of 45% over a time frame of 65 days, which is quite decent.
Things to keep in mind
- This strategy works well for most stocks, as seen with examples like Reliance and Tata Power. For some stocks, it’s useful to zoom out to other timeframes, such as weekly or monthly, to achieve better results.
- Identifying the best timeframes for this strategy can be done through trial and error or by backtesting in TradingView to analyze results.
- This strategy generates a limited number of signals, so be cautious when using it in range-bound markets as frequent entries and exits can occur in a short time.
- In range-bound markets, small losses may accumulate due to commissions and slippage, which can reduce profits. Relying solely on this strategy may not be effective in such market conditions.
- To improve the validity of entries and exits, use volume as a key indicator, as it enhances accuracy, similar to its use in previous strategies.
Chapter 4: RSI+EMA Positional Trading Strategy
Overview
Our final positional strategy is built on very basic yet powerful technical indicators: the relative strength index (RSI) and exponential moving average (EMA).RSI+EMA strategy is a positional strategy, which means trades last for weeks or months. This positional strategy is often used by investors who aim to capitalize on long-term market trends by holding positions for extended periods.
This strategy is a powerful combination of RSI and 30-day EMA which is more suitable for long-term perspective. It’s particularly effective in indicating when a stock is gaining short-term momentum, enabling traders to capture the move over a few weeks or months. We recommend using the following stock universe, indicators, and time frame.
Let’s look at our strategy
Indicators used in this strategy
In this strategy, we use two technical indicators, EMA and RSI, to filter stocks. An exponential moving average (EMA) gives more weight to recent closing prices, making it more responsive to new data. For our strategy, we use a 30-day time frame, where the 30-day EMA shows the average price over the last 30 trading sessions, with more emphasis on the recent ones. This smooths out short-term fluctuations and helps identify the overall market trend.
The Relative Strength Index (RSI) is a momentum indicator that measures the speed and change of price movements. It ranges from 0 to 100, with values above 70 suggesting that a stock is overbought and values below 30 indicating that it’s oversold. Traders use the RSI to spot potential buy or sell opportunities and to predict trend reversals based on market momentum.
Spotting an entry
We look for entries on the daily time frame, and trade is triggered only when
- Relative strength index crossing greater than 60
- Daily candlestick closing greater than the 30-day exponential moving average (EMA)
Both conditions must happen at the same time for an entry to be valid. Ideally, the entry is made after the day-closing candlestick. Since we are going long, it’s preferable to identify a bullish candlestick pattern like a bullish marubozu or bullish engulfing.
But for a more risk-averse approach, consider entering the stock only when a bullish candle surpasses the high of the candle that triggered the entry.
Here is a pictorial representation of the entry
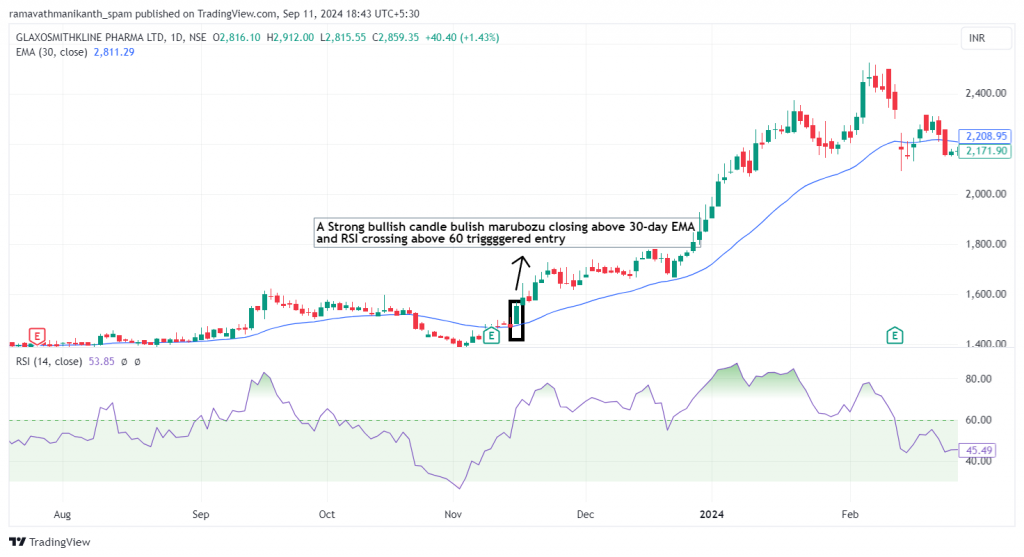
In this example, we can see both technical indicators aligning, with the RSI above 60 and the candlestick closing above the 30-day EMA, triggering the entry simultaneously. The presence of a bullish candle, specifically a bullish marubozu, provides strong confirmation for entering the trade.
Planning an exit
This positional strategy takes place in two ways.
- Closing of the stock reaching the latest swing after the entry of stock or else testing the previous resistance level
- The candlestick is going below the 30-day exponential moving average.
To identify key swing points, simply look at the chart and find the most recent swing high (the highest point before a downward movement) and swing low (the lowest point before an upward movement). Connect these points as they represent important turning points in the stock’s movement. Discover support and resistance more here.
We are using resistance as the exit point because the stock previously struggled to move higher at this level. If the price reaches this level again, it may face selling pressure, as it has had difficulty breaking through in the past.
When the candlestick closes below the 30-day EMA, it is a clear sign of market bearishness. This signals that it’s better to exit the trade to avoid potential losses.
Spotting a bearish candlestick during an exit provides a more decisive confirmation of a market reversal. We should look for bearish patterns, such as a bearish marubozu or an evening star. If any of these patterns appear, along with either of the exit conditions mentioned earlier, it triggers an exit for our positional strategy.
Here is an example of the same trade on GlaxoSmithKline Pharmaceutical
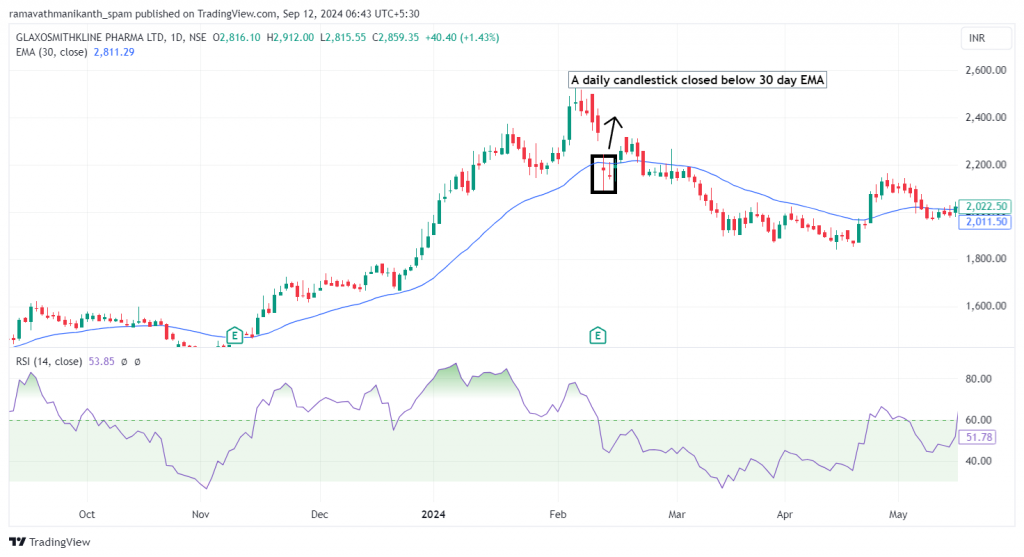
In the above chart, we can see that a daily candlestick formed an indecisive pattern, such as a doji, and closed below the 30-day EMA. After this, the market took an opposite stance, signaling a potential trend reversal. But remember, we exit our trade if it meets either condition.
Stop loss
The price breaching the swing low on the daily time frame acts as a stop loss. The swing low serves as a crucial support level where buyers previously stepped in to push the price higher. If the price breaks below this point, it indicates that buyers are losing control and market momentum is shifting toward sellers. This is a sign of a trend reversal, suggesting the uptrend has ended and a potential downtrend could begin.
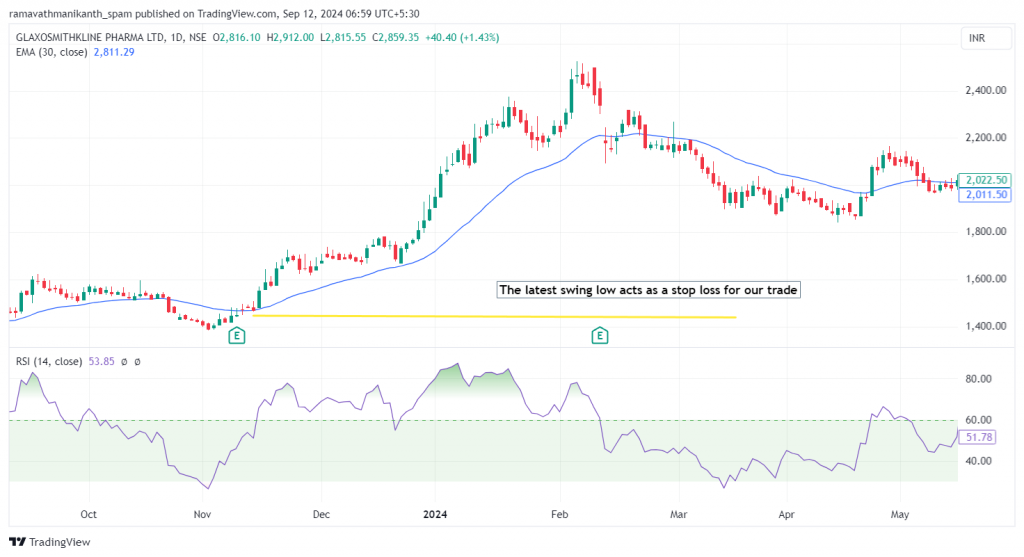
Examples
Let’s look at a clear example of this strategy for better understanding. Below is the chart of Ashok Leyland.
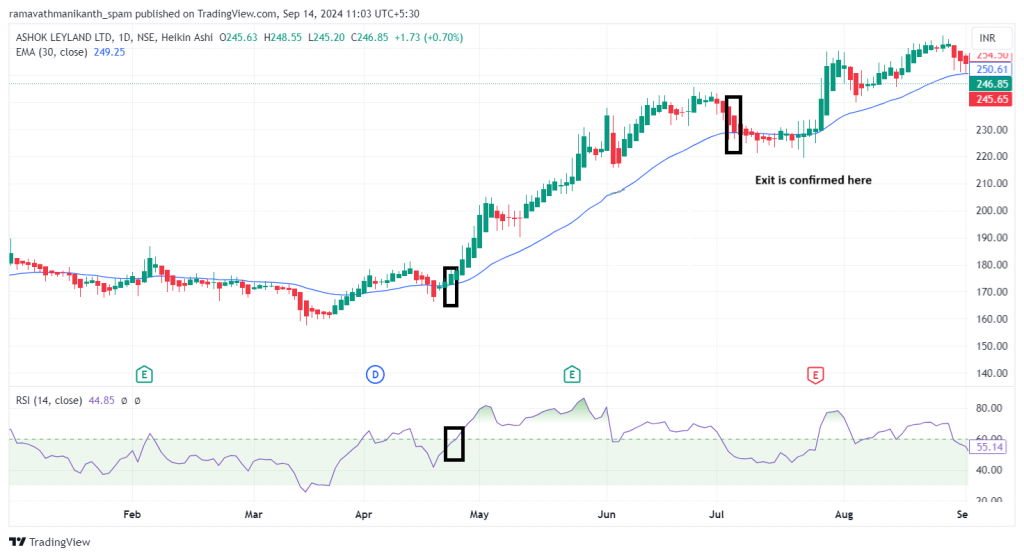
Ashok Leyland just closed above the 30-day EMA, with the RSI at 60, showing a potential buying opportunity. To confirm, we can see a series of green candlesticks forming the three white soldiers pattern.
Our exit would be when the candlestick closes below the 30-day EMA, indicating a loss of momentum. Additionally, the appearance of bearish candlesticks confirms our decision to exit. Below is a highlighted part of it.
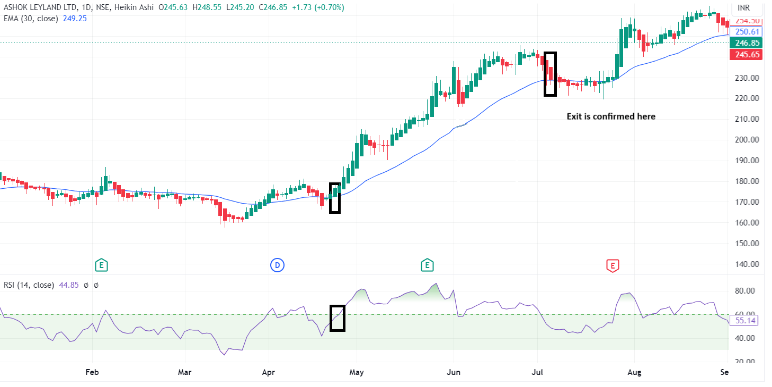
This would have given us a return of 35% in 69 days, which is a very good
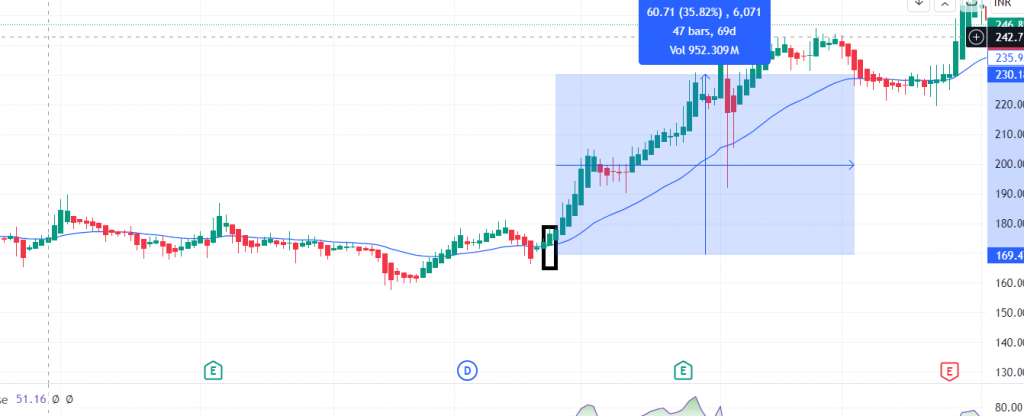
Things to keep in mind
- Use two different time frames: weekly to identify the overall trend and strength, and daily to fine-tune entry and exit points.
- Spotting short-term bullish patterns like a marubozu or morning star on the daily chart adds an extra layer of confirmation.
- Diversify your strategies since every strategy has limitations. The RSI + EMA strategy may be less effective in range-bound markets.
- In range-bound markets, RSI may oscillate between overbought and oversold levels without showing a clear trend, and price might cross the 30-day EMA multiple times without a solid directional move, leading to whipsaw trades.
- Volume is a key indicator that helps confirm the strength behind price movements, adding confidence to trades.
Chapter 5: Fibonacci MA Crossover Strategy
This is the second swing trading strategy, which is unique because it uses only one powerful indicator: the exponential moving average. This indicator is applied across different time frames to determine entry points. The Fibonacci MA crossover strategy is suitable for capturing short- to medium-term price movements in the markets.
This strategy works best in trending markets where there is a clear trend or momentum, making it ideal for such conditions rather than sideways or highly volatile markets. Using different time frames helps capture short- to medium-term movements in the market. The core idea is that applying various time frames in the exponential moving average reduces market noise and provides clear signals, making it a straightforward yet effective method.
Let’s now dive deep into the strategy
Indicators used in this strategy
For this strategy, we are only using an exponential moving average (EMA), which is a weighted average of the closing prices of the last few trading sessions, with a higher weight given to the most recent sessions. For example, a 30-day moving average shows the average cost of the previous 30 trading sessions, where the weight given to the most recent sessions would be more than the weight given to older sessions. More about EMA’s here.
The three different EMAs help to reduce noise in the market and provide a signal in the market. In the Fibonacci MA Crossover strategy, we will use 8-day,13-day, and 21-day to construct the Exponential Moving average in the strategy.
Spotting an entry
We wait for the exponential moving averages to cross over to provide a signal. Once this crossover occurs, we take an entry into the market. Below are the criteria for this entry.
When the 8-day EMA crosses above the 13-day and 21-day EMA, and the 13-day EMA crosses above the 21-day EMA on a daily time frame.
Entry is confirmed when the crossover occurs. Specifically, when the 8-day EMA crosses above both the 13-day and 21-day EMAs, it indicates that short-term momentum is increasing, signaling a shift to a bullish stance and suggesting that the stock is in upward momentum, with a potential uptrend forming. Additionally, when the 13-day EMA crosses above the 21-day EMA, it shows that the medium-term trend is also turning positive, confirming that the short-term strength is evolving into a more sustained uptrend.
For a more ideal approach, it’s best to take an entry at the end of the day, entering on the next candlestick formed after the crossover. This method suits a risk-taker approach. However, for a risk-averse approach, it’s advisable to enter the stock only after the candlestick surpasses the high of the previous one. This ensures a strong confirmation of upward momentum, reducing the likelihood of entering a false breakout.
Just after the crossover occurs, it’s helpful to confirm the entry by identifying a bullish candlestick pattern like a bullish marubozu or morning star. These patterns provide strong confirmation for entering the trade, reinforcing the likelihood of an upward movement.
Let’s look at a clear example of the Fibonacci MA Crossover strategy.
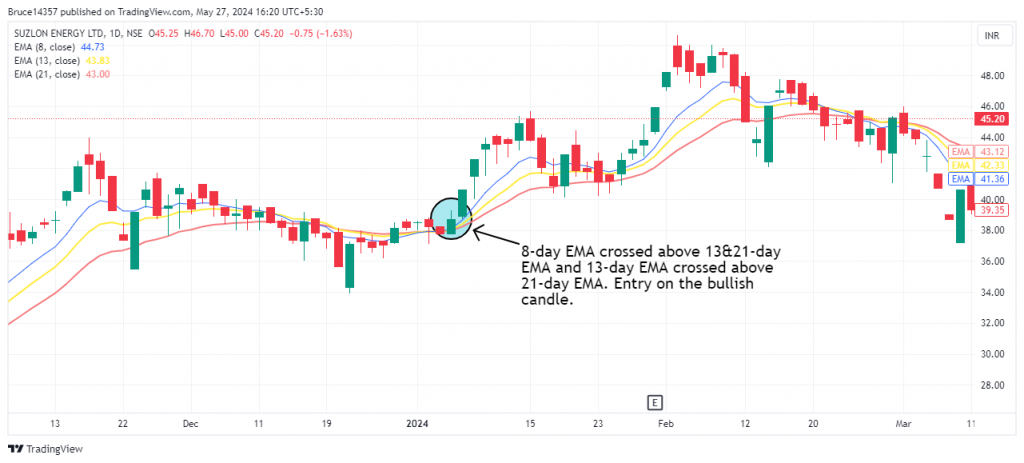
In the chart above, we can see the short-term moving average crossing over the long-term moving average. It’s helpful to color-code them differently to make this distinction clearer. Additionally, a bullish marubozu candlestick is formed, signaling a buying opportunity.
For a risk-averse approach, as we discussed, the next candlestick should surpass the crossover candlestick. We would have entered the market with the first candle for a risk-taker or the second candlestick for a risk-averse approach.
Planning an exit
We will exit our strategy and exit the trade in either of the following instances:
- When the price reaches the latest swing high or previously tested resistance level
- Shorter-term moving average (8-day) crosses below the longer-term moving average (13-day) with a distinct bearish candle
With the conditions above, spotting a bearish candlestick like a bearish marubozu or evening star along with either of the above conditions provides strong confirmation for exiting the trade.
The latest swing high or previous resistance level often acts as a ceiling, limiting further upward movement. This is a crucial price point where sellers may re-enter the market, causing the price to reverse. By exiting at this point, we lock in profits before a potential pullback or reversal occurs.
When the 8-day moving average crosses below the 13-day moving average with a bearish candlestick, it indicates a potential trend reversal or weakening momentum. The crossover, especially with a bearish candle, signals that the price may continue to decline, suggesting it’s a good point to exit and avoid further losses.
Here is the same example of Suzlon that gave exit for our Fibonacci MA crossover strategy
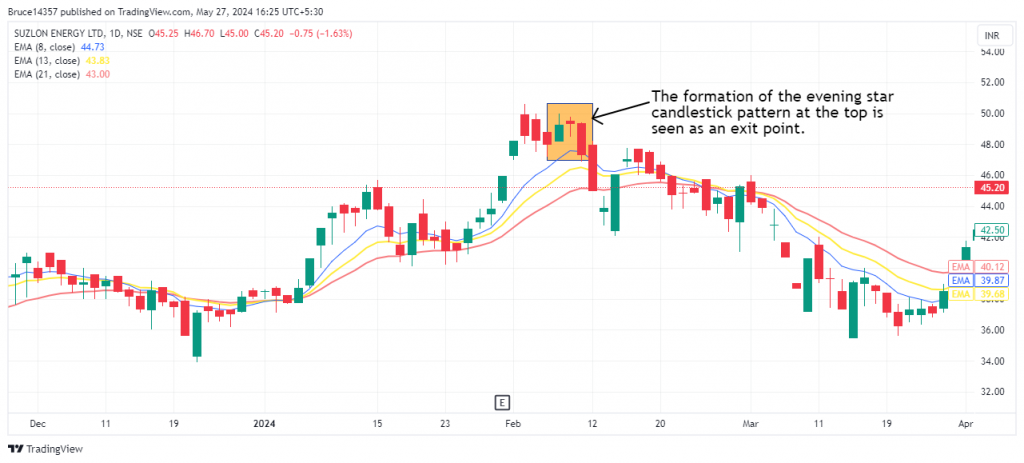
The chart serves as a strong example of a death crossover, where the long-term moving average overtakes the shorter-term moving average. This indicates that recent price momentum is weakening, and a longer-term downtrend may be forming. In our example, the 8-day moving average is the shorter-term, and the 13-day moving average is the longer-term indicator.
In the above example of the Suzlon chart, the highlighted box with a significant bearish candlestick pattern combined with the moving average crossover provided a clear exit signal for the strategy.
Stop loss
For the Fibonacci MA Crossover strategy, the 13-day EMA is used as a stop loss because it represents a critical level of support, reflecting the longer-term trend within a short-to-medium time frame. The 13-day EMA smooths out price fluctuations over a more extended period than the 8-day EMA. Using it as a stop loss ensures that the exit signal is based on a broader view of the trend.
Setting the stop loss based on the 13-day EMA prevents exiting too early due to short-term price volatility. It allows traders to ride out minor fluctuations while still exiting when the longer-term momentum weakens, thus managing risk effectively.
Examples
The strategy gave an entry signal in Suzlon Energy stock on 4th January 2024, where the 8-day moving average crossed over both the longer-term 13-day and 21-day moving averages, accompanied by a bullish candlestick pattern. Below is the chart of this event, which clearly illustrates the crossover and the bullish momentum it indicated.
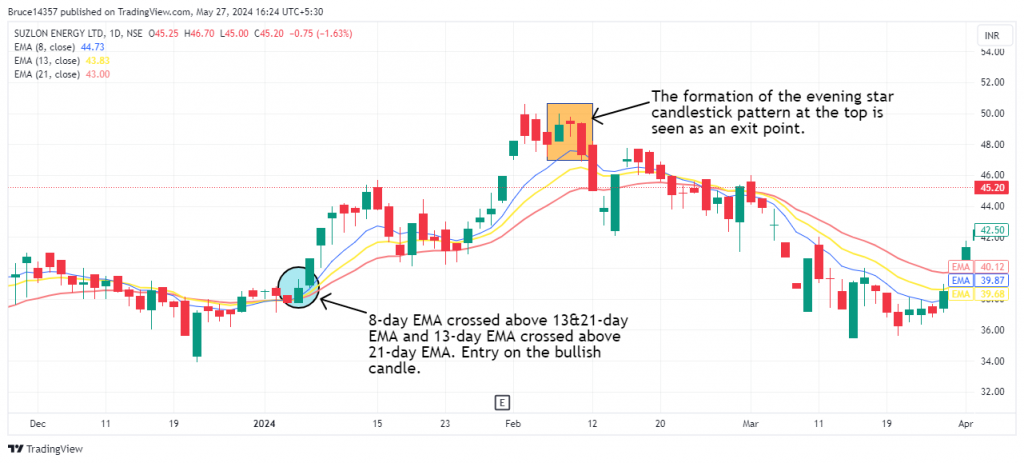
This strategy confirmed an exit when the evening candlestick pattern formed, a bearish pattern indicating potential bearishness in the market. As we can see, Suzlon’s stock took a downturn right after that. It is crucial to monitor bearish candlestick patterns and moving averages within this strategy. This trade would have yielded a return of 31.4%.
Things to keep in mind
- The Fibonacci MA Crossover strategy is best suited for the daily time frame for most stocks. However, for some stocks, other time frames, such as weekly or monthly, may produce better results. Finding the perfect time frame involves a trial-and-error approach and requires thorough backtesting to identify what works best for a specific stock or market condition.
- Over-relying on a single strategy is not advised, as strategies like the Fibonacci MA Crossover work well in trending markets but could underperform or lead to losses in other conditions, such as sideways or highly volatile markets.
- Diversifying your strategies can help mitigate the risk posed by changing market conditions, ensuring more consistent performance across different market environments.
- Volume is a crucial indicator for any strategy. High trading volumes indicate increased participation by traders.
Chapter 6: RSI + Supertrend Momentum Strategy
This is the last strategy we will discuss in the module, and it is explicitly designed for swing traders. It leverages two popular technical indicators: the relative strength index (RSI) and the Super Trend momentum indicator. When combined, these indicators provide swing traders with clear signals for entry and exit points, making it easier to capitalize on short- to medium-term price movements. This strategy is particularly effective in identifying momentum shifts and capturing gains during market swings.
This strategy is particularly suited for positional trading because it combines both momentum and trend-following indicators. It helps identify when a stock is entering a sustained bullish phase, providing opportunities to hold positions for a few months to capture meaningful gains. Trending markets are ideal for this strategy, especially during clear upward or bullish trends. In such markets, traders can capture strong, sustained movements in stock prices, allowing them to maximize returns while minimizing the noise and short-term fluctuations often seen in volatile or sideways markets.
Indicators used in this strategy
̌From the name of the strategy itself, we can infer that it involves the relative strength index (RSI) and super trend indicators. The relative strength index is a momentum oscillator that measures the speed and change in stock prices. It helps identify potential buy or sell signals and trend reversals based on market momentum. The super trend indicator, on the other hand, identifies reversal points and is directly plotted on the chart based on price action and volatility. It gives clear buy and sell signals, ultimately indicating the trend direction, whether upward or downward. Check out more about the indicators here.
Spotting an entry
This strategy filters the stock based on the below criteria:
- The closing price of the stock should be a super trend indicator
- The relative strength index value is greater than 50
When the daily closing price exceeds the Supertrend indicator, it signals a potential uptrend in the stock. This suggests that the stock price may be moving upward with strength, and the Supertrend, acting as a dynamic support/resistance level, has been breached, which could indicate a buying opportunity or continuation of bullish momentum.
The relative strength index (RSI) above 50 signals positive momentum in the stock’s price movement, indicating that buying pressure is stronger than selling pressure. When the RSI just crosses 50, it shows the stock is entering a positive momentum zone, where selling pressure is shifting towards buying pressure, creating a bullish sentiment in the market. This transition suggests that the market outlook is moving from neutral or bearish to bullish.
An entry into the market is triggered when the stock meets both buy signals. Ideally, a position is taken at the close of the first bullish candlestick following the buy signals from the indicators. This approach is more suitable for risk-takers looking for quicker entries. However, for those seeking a more confirmed signal, entry is made when the bullish candlestick surpasses the high of the candle that initially triggered the buy signal. This method provides more certainty and can reduce the risk of false signals by waiting for more decisive confirmation.
When entering a stock, whether using a risk-taking or risk-averse strategy, spotting bullish candlestick patterns like a bullish marubozu or a morning star can act as a double confirmation for entry.
Here is an example of our RSI+super trend Momentum strategy
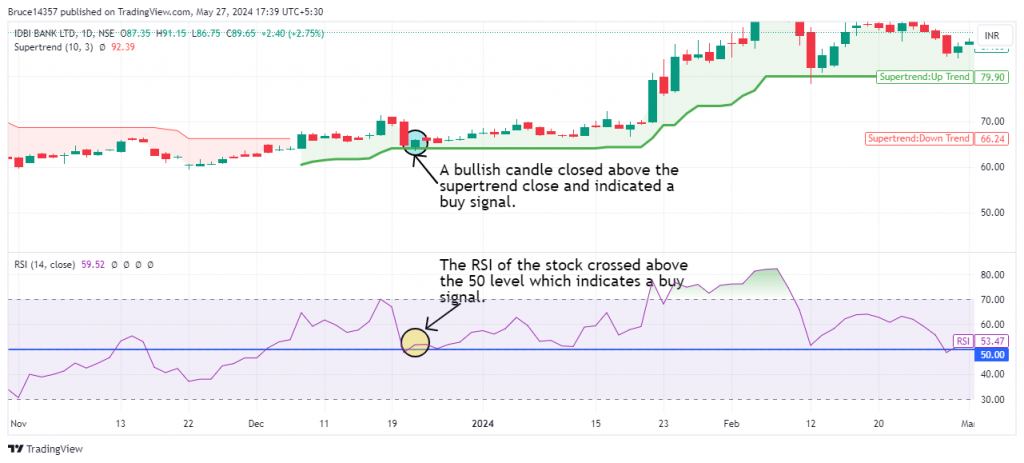
In the chart above, within the highlighted areas, we can see that a bullish candlestick has formed and closed above the super trend indicator, signaling a potential upward trend. Additionally, the relative strength index (RSI) has crossed above 50, confirming the bullish momentum. This combination of signals strengthens the case for a favorable price movement, indicating a potential buy opportunity.
Now, let’s move on to the exit part of this strategy.
Planning an exit
Since the indicators of this strategy are the relative strength index (RSI) and super trend, which typically indicate overbought and oversold zones, the exit should be made when the stock reaches an overbought zone. The super trend depicts the ongoing market trend, so the exit point should be when the trend reverses. The criteria for this strategy’s exit are detailed below.
- Relative strength index reaching value above 70 indicating overbought zone
- The closing price of the stock below the super trend level
- The price reaches its latest swing high or previously tested resistance level or forms a lower-low pattern.
Plan to exit this strategy if either of the mentioned instances occurs. The strategy will exit when the price reaches a swing high or a well-established resistance level, indicating a potential ceiling where selling pressure might increase.
Traditionally, these levels tend to push the price down, suggesting that the trend is weakening. Additionally, a lower-low pattern signifies a shift in trend direction, indicating that the bulls are losing control while bears are gaining momentum. Exiting at this point helps minimize losses or protect existing gains before a stronger downtrend develops.
Spotting a bearish candlestick pattern during our entry can confirm our exit. Patterns like the evening star or bearish marubozu, when combined with any of the above conditions, provide strong confirmation for exiting the trade.
Let’s look at the same example of IDBI Bank and how the stock received the exit signal.
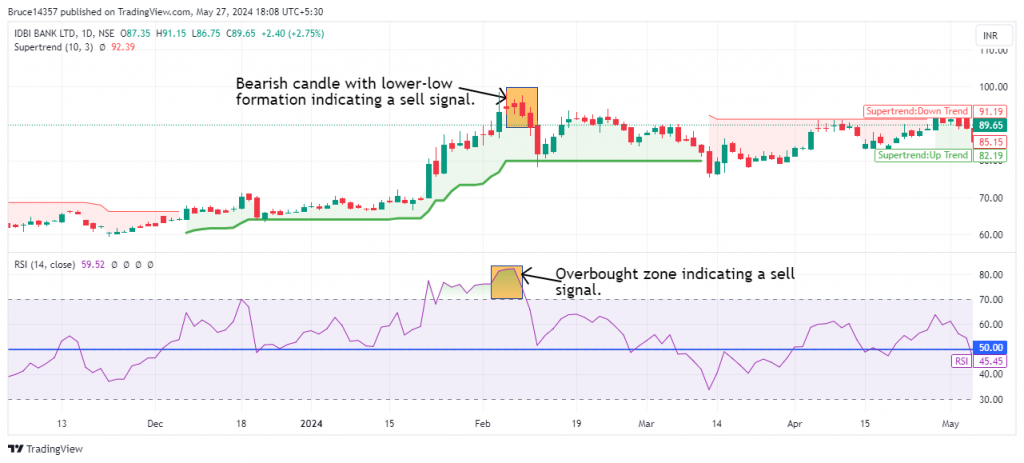
In the above chart of IDBI Bank, we can see a bearish candlestick pattern of three black crows, forming a lower-low pattern. The relative strength index is in the overbought zone, near 80. Additionally, IDBI Bank has just closed below the supertrend level, indicating that the stock has lost its momentum. All these signals, cumulatively, indicate an exit point for the stock price. This IDBI Bank example highlights multiple firm exit signals through a combination of RSI and supertrend.
Stop loss
In this strategy, we use the supertrend indicator, which moves along with the stock price, making it an ideal option to use as a trailing stop-loss.
Examples
Let’s look at another example of this strategy that triggered an entry into Tata Motors. In the chart below, we can see that at the time of entry, the relative strength index is greater than 50, and Tata Power closed above the supertrend, indicating bullishness in the market.
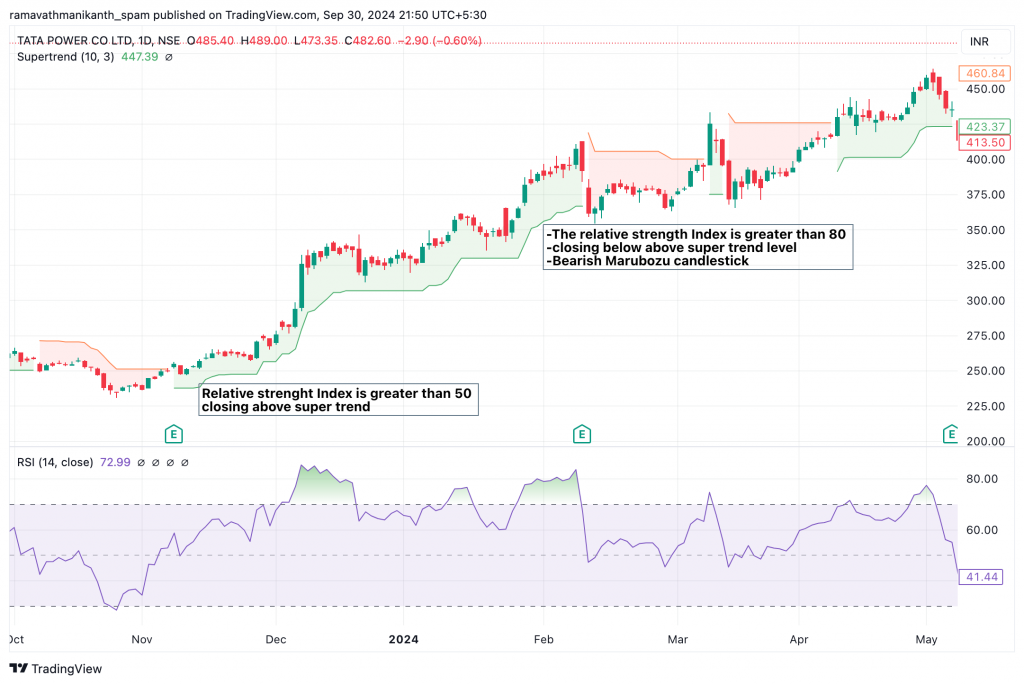
In the same example, Tata Power entry was triggered after 93 days, resulting in a 60% return. The exit was signaled when the relative strength index entered the oversold zone, accompanied by a significant bearish candlestick pattern in the chart, indicating a potential market shift. This was the precise time to exit the trade.
Things to keep in mind
There are some things to keep in mind while trading using this strategy. Let’s look at them one by one:
- This strategy is most suitable for trading on a daily time frame but can also be applied to positional trading strategies using weekly or monthly time frames. Trading this strategy on a weekly or monthly basis can yield good results as well. Finding the optimal time frame typically comes with experience and some trial-and-error to identify what works best.
- When we rely on a single trading strategy, we increase exposure to specific risks. Our entire portfolio could face significant losses if the strategy fails due to changing market conditions. Additionally, since market conditions vary, this strategy performs better in trending markets.
- By using multiple strategies, we can balance risk and enhance the overall resilience of our portfolio.
- It is essential to consider volume during both our entry and exit points to validate the strength of the move.
Chapter 7: Swing Trading Strategy for Mid and Small Caps
Overview
In this strategy, we aim to identify mid and small-cap stocks that are about to gain short-term momentum. Mid and small-cap stocks tend to experience sharper price movements, offering more opportunities for swing traders to capitalize on price swings.
We filter stocks using the relative strength index (RSI) and super trend indicators to identify trading opportunities. In this strategy, we use heiken ashi candlesticks and analyze them in a 2-hour time frame. These candlesticks help reduce false signals and provide a clearer view of market trends.
Indicators used in this strategy
In this strategy, we are going to use indicators that we are already familiar with: the Supertrend and relative strength index (RSI).
To recap, the Supertrend indicator identity. It is plotted on the price chart and provides indicators such as buy and sell signals based on price action and volatility. It helps determine the trend direction, entry, and exit points and improves the accuracy of the trading strategy.
The relative strength index (RSI) is a momentum oscillator that measures the speed and change of price movements. It ranges from 0 to 100, with values above 70 indicating overbought conditions and below 30 indicating oversold conditions.
Spotting an entry
Before applying the indicators to the chart, change the time frame to 2 hours and switch the chart to Heiken Ashi. Also, focus on selecting stocks from midcap and small-cap categories. Here are the criteria for taking an entry:
- 2-hour closing price exceeds the super trend or is within a 5% range of it
- Relative strength index value less than 20 or less than it
We are applying this strategy to the Heikin Ashi chart. The Heikin-Ashi chart is an average of the previous two regular candlesticks. We would be using it since it helps us with more explicit identification, reduced false signals, and more straightforward visual analysis of market direction and strength, which eventually helps us make better-informed decisions.
The Supertrend indicator works well in capturing recent volatile price moves, making it easier to spot trends and reversals. For swing traders, these more significant price fluctuations offer more opportunities.
If the above conditions are met, take an entry on that particular stock within 5% of the Supertrend value. This approach is more suitable for risk-takers, as it allows for the early capture of trends while accepting a higher level of risk.
For a risk-averse approach, it is better to enter a position only when the stock price exceeds the Supertrend level. To further confirm the trade, look for a bullish candlestick pattern, such as a bullish marubozu or a morning star, which provides strong confirmation for entering the trade.
Here is the below example of Tata Investment Ltd.:
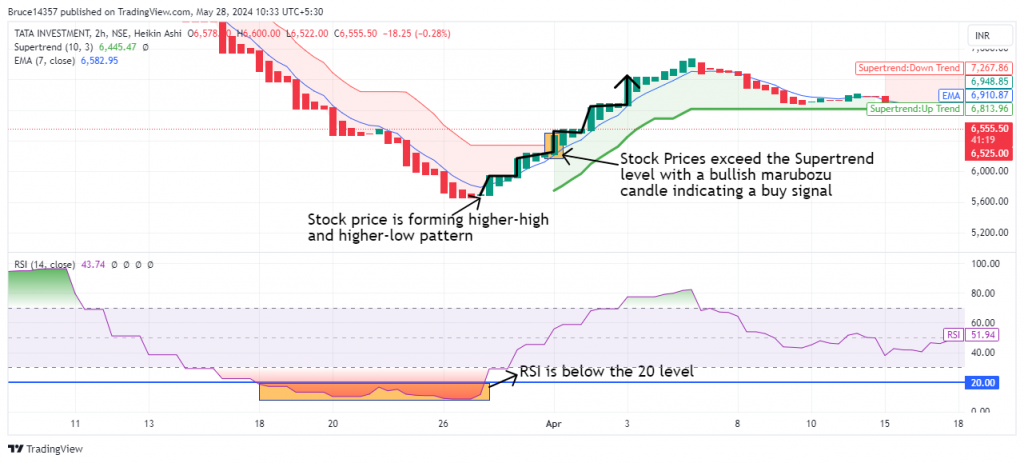
After a series of red candlesticks on the Heikin-Ashi chart, the stock showed a reversal with a bullish marubozu candlestick. The RSI has just crossed above 20, indicating it’s in the oversold zone. Additionally, our final technical indicator, the Supertrend, signals that Tata Investment is moving into a bullish trend. These are vital signs suggesting a perfect entry point into the market.
Planning an exit
This mid and small-cap momentum strategy can take an exit when either of the following things happens:
- Relative strength index value reaching 70
- Closing price below the level of Supertrend
- The price reaches its latest swing high or previously tested resistance level and forms a lower-low pattern.
The RSI indicates that the stock has reached its overbought zone, suggesting it has experienced a significant upward movement and may be due for a correction or pullback. This implies that the buying pressure might be exhausted, making it a signal to watch for potential reversals. Similarly, if the stock closes below the Supertrend level, it indicates that the current uptrend is weakening or possibly reversing.
If the price reaches the latest swing or previous resistance level, it may encounter selling pressure, leading to a potential reversal. If the price then forms a lower-low pattern after hitting this level, it indicates a shift in market sentiment from bullish to bearish. A lower-low pattern means the stock is starting to make lower peaks and troughs, suggesting that momentum is turning downward. Exiting at this point helps avoid further losses, as it confirms a weakening trend and the likelihood of a downtrend forming.
Spotting a bearish candlestick pattern, such as a bearish marubozu or evening star, in conjunction with the above exit conditions, provides additional confirmation for exiting the trade.
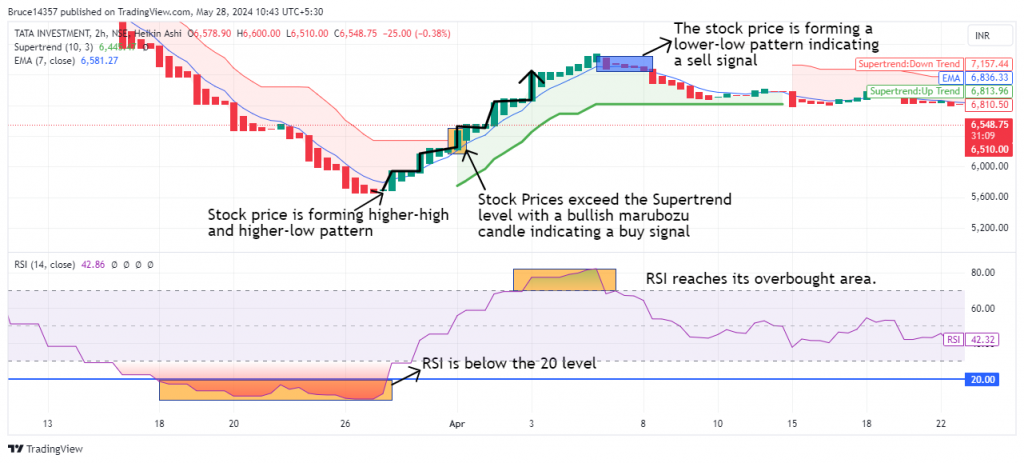
In the same example, we discussed earlier with Tata Investment, the stock has gradually formed a lower low on the chart, and the RSI has moved into the overbought zone, as shown in the highlighted part. The chart above marks multiple ideal exit points according to the strategy.
Stop loss
For this strategy, we’re using the Supertrend indicator as a stop loss because it dynamically adjusts with price movements. For example, in an uptrend, the Supertrend usually moves below the price, offering a trailing stop loss. This helps lock in profits while still allowing the trade some room to move with the trend.
Examples
Let’s look at some examples for a better understanding. Below is the chart of Avanti Feeds. We apply our indicators to the chart. The primary conditions for the strategy are as follows: the Relative Strength Index (RSI) should be below 20, the stock price should break above the Supertrend (10,3) indicator, and the stock should form a higher-high pattern.
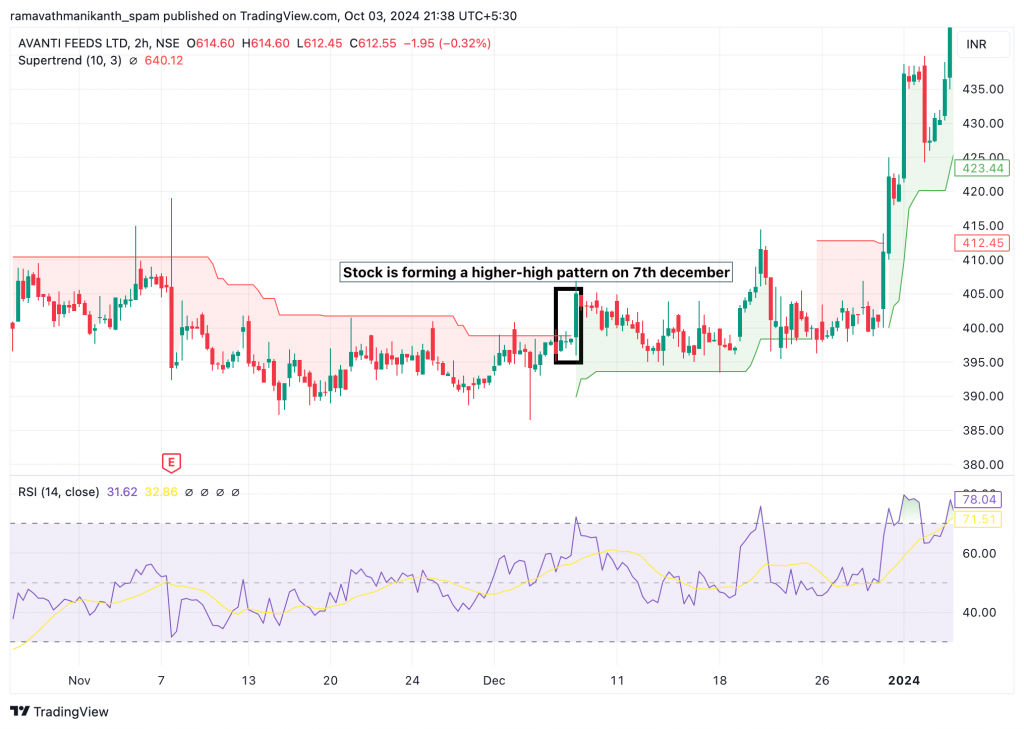
So, the buying price would be ₹401. After that, as per our strategy, the stop loss should be set using the Super Trend indicator as a trailing stop loss. The chart below shows an exit around ₹570, which is approximately a 50% return—considered excellent in the stock market. Below is the pictorial representation.

Things to keep in mind
- The strategy is flexible across various time frames, including 2-hour, daily, 1-hour, and 3-hour charts, with indicators like Supertrend and RSI providing reliable buy and sell signals based on trend direction.
- To find the optimal time frame, traders can rely on trial-and-error or backtesting using tools like TradingView. However, applying this strategy to only a portion of the portfolio is advisable, given the potential drawbacks of any single approach.
- In the midcap and small-cap space, regular profit booking and stop-loss adjustments are crucial due to increased volatility and sensitivity to market news.
For example, when the Reserve Bank of India put a temporary freeze on Yes Bank due to deteriorating financial health, limiting withdrawals to ₹50,000 per account, the stock experienced a sharp decline. In a single day, it plummeted 56% from its opening price, leading to substantial losses. The chart below illustrates this event.

Imagine we had taken a trade on Yes Bank, but we missed seeing that day, and we would have faced severe loss. So, while trading with this strategy, it’s essential to book profits and trail-stop losses.
Volume helps confirm this strategy in any time frame. We should also consider trading volumes when using a mid and small-cap momentum strategy.
Scalping Strategy Guide
Get ready to start scalping with these beginner-level scalping strategies.
Chapter 1: Introduction to Scalping Strategies
Over the past few years, intraday trading has exploded in popularity, with the number of traders in Indian markets increasing by an incredible 300%. Most traders are drawn to major indices like Nifty and Bank Nifty because of their high liquidity and volatility. These features make them perfect for scalping, where traders aim to easily make quick entries and exits.
But here’s the catch: around 70% of intraday traders have lost during this time. That’s because scalping isn’t as easy as it sounds. It demands strong risk management, a solid strategy, and, most importantly, the right mindset.
To help you overcome these challenges, we’ve gathered some of the best and most profitable strategies from seasoned traders with over 20 years of market experience. But before we dive into these strategies, let’s look at what scalping is and why it attracts so many traders so we’re all on the same page.
What’s the buzz around scalping?
As traders, many of us are drawn to scalping because it fits the mindset of wanting quick results. Making profits multiple times in a single day is exciting, and scalping gives us plenty of chances to do just that. Indices like Nifty 50 and Bank Nifty make it even better with their high liquidity and volatility, allowing us to enter and exit trades easily.
But let’s be honest—scalping isn’t as simple as it sounds. It takes severe discipline since we’re trading in very short timeframes. Most of us who scalp trade in the Futures and Options (F&O) segment, where the risks are higher. Without good risk management, losses can pile up faster than we expect.
That’s why succeeding in scalping is not just about finding opportunities it’s about having the right mindset, solid strategies, and a plan to manage risks effectively.
Should you scalp?
Here’s a table to help weigh the pros and cons of scalping in the Indian markets. By the end, one should clearly know whether scalping is the right approach for them.
Why We Might Choose Scalping | Why Scalping Might Not Be for Us |
Scalping allows us to book profits multiple times daily, which can be exciting if we enjoy fast-paced trading. | Constant monitoring of charts and quick decision-making can be mentally exhausting for us. |
Indices like Nifty 50 and Bank Nifty offer high liquidity, making it easy for us to enter and exit trades quickly. | Small mistakes can lead to significant losses if we don’t have proper risk management. |
High volatility provides more trading opportunities, perfect for those who thrive on action. | Trading in low timeframes requires strict discipline, which isn’t always easy for everyone to maintain. |
With leverage in the Futures and Options (F&O) segment, we can trade with a smaller capital base. | Leverage can amplify losses as much as profits, leading to financial stress if trades go wrong. |
Scalping helps us sharpen our technical analysis and decision-making skills. | We must master technical analysis, strategies, and quick execution to succeed. |
We can trade during market hours without holding positions overnight, reducing risks. | If we struggle with quick decisions or don’t have time to monitor trades, scalping can feel overwhelming. |
Scalping checklist
If it’s still unsure whether scalping is suitable, start by answering these simple questions. Take a moment to think about each one carefully and write down honest answers:
- Do you have time to monitor trades actively during the day?
- Can you stay disciplined and follow strict risk management?
- Do you understand technical analysis and charts?
- Are you okay with high-stress and fast decisions?
If the answer to all of these questions is yes, scalping only makes sense for you. In this module, we’ll explore five proven scalping strategies developed by trading experts, leveraging technical concepts and indicators for effective results.
Let’s get started!
Chapter 2: Reversal Scalping Strategy
Overview
Scalping offers a fast way to earn in the stock market, but success hinges on effectively spotting trend reversals or following trends. Finding a strategy that aligns with our style is crucial, as profits can come from catching trends or reversals, primarily influenced by our trading mindset and approach.
This chapter’ll cover a scalping strategy focused on seizing market reversals. We’ll use two technical indicators: Williams %R, which identifies overbought and oversold market conditions, and the exponential moving average to guide entry and exit points.
This disciplined, quick-response strategy is well-suited for liquid indexes and can be adapted by adjusting settings or using alternative indicators like stochastic RSI.
Ready to dive in? Let’s go!
Indicators used in this strategy
William %R and Exponential Moving Average(EMA) perfectly fit the scalping strategy because the combination of these can provide quick signals in fast-moving markets; here is a brief overview of each one:
- Williams %R: This momentum indicator helps identify overbought and oversold conditions in a stock or index. It can be used to time entries when the market shows signs of reversal. Williams %R is expressed as a percentage, where a reading of -80 or lower suggests the stock is oversold, and a reading of -20 or higher indicates it is overbought.
- Exponential Moving Average: One of the fundamental yet powerful indicators in the market, this gives weightage to recent price changes in assets. In this scalping strategy, this signals entry and exit points.
EMA_today=(Pricetoday×K)+(EMA_yesterday×(1−K)) K=smoothing constant
More in-depth explanation about EMA here.
Spotting an entry
Markets move in cycles, rising before reversing or falling before rebounding. As scalpers, identifying a profitable reversal is key. If we spot a promising opportunity, we can take a position. This strategy focuses on catching major market reversals for potential profits.
For this strategy, we set a predefined rule to help us determine if a stock has made a sharp move up or down. This is where the technical indicator Williams %R becomes useful. While the Relative Strength Index (RSI) can also be used, RSI tends to show dips even when there are slight declines, which might not be as effective in spotting more significant reversals.
Below is the chart of the Nifty50 time frame of 15-minute candlesticks with RSI technical indicator:
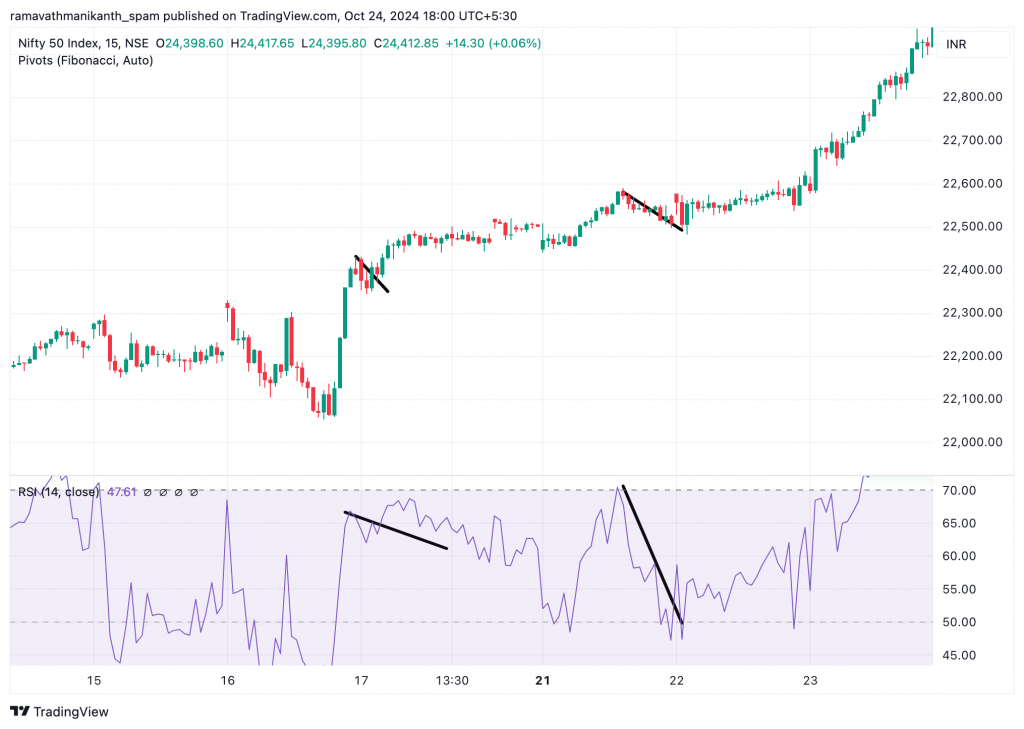
The above chart shows that while the market is moving up, the RSI is still showing dips. This isn’t ideal because we want an indicator that only dips when the stock or index is moving downward.
To overcome this, instead of using the RSI indicator, we will apply the Williams %R indicator. We can smooth the Williams %R by adjusting its inputs to make it more reliable. The default setting is 14, but we will change it to 140 for this strategy. This adjustment helps filter out small fluctuations and focus on significant market movements.
We will adjust the settings of the Williams %R technical indicator by modifying the overbought and oversold levels. The upper limit will be changed to -5 and the lower limit to -95. This adjustment will widen the range, making the overbought zone “deep overbought” and the oversold zone “deep oversold.”Here is a snapshot of the William%R indicator.
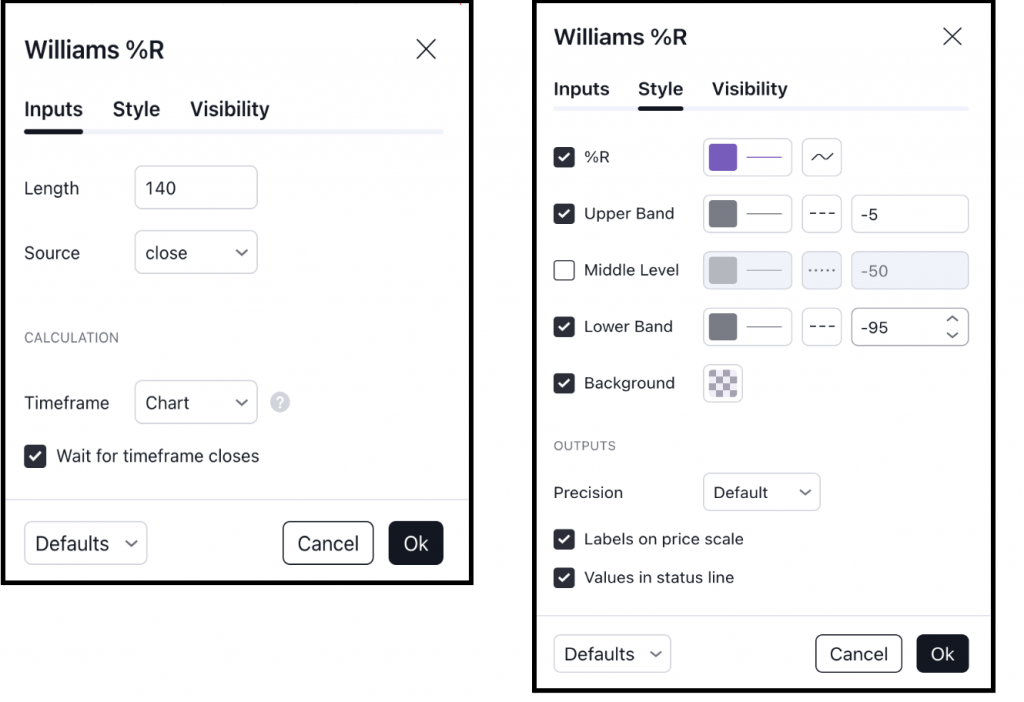
First, we will apply this strategy in the 15-minute timeframe to understand the market conditions, particularly the overbought and oversold zones. When the Williams %R indicator moves above the -20 line, the stock or index is in the overbought zone. When it goes below the -80 line, it signals that the stock or index is in the oversold zone.
If the stock or index is in the overbought zone, we will look for a short signal, and if it is in the oversold zone, we will look for a long signal. After identifying these signals on the 15-minute chart, we will refine our entries by shifting to a lower timeframe, such as the 1-minute or 2-minute chart, to time our trades precisely.
Here, we use a moving average ribbon and set up the indicator; we will change simple moving averages to EMA’s. The frame of the first line is 9, the second is 30, and this one is 100 to capture multiple trends and get quicker reactions to price changes. For better visibility, we change the color of the moving averages. Below is the picture
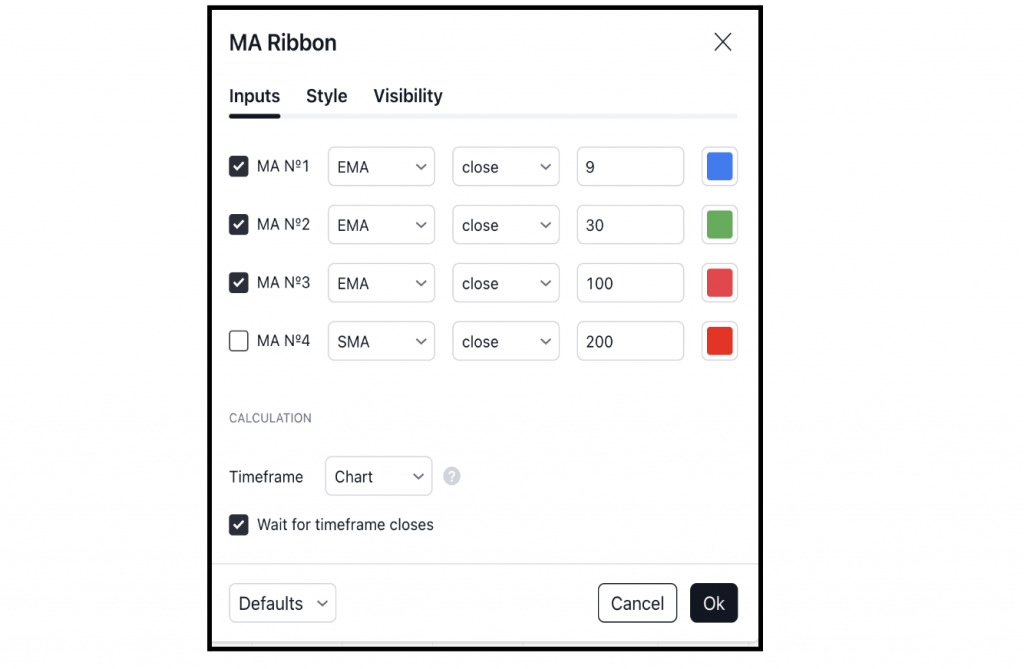
Long Trade Entry
- First, we will assess the market stance using the Williams %R technical indicator. If the value falls below -95, we consider it to be in the oversold zone, indicating a potential buying opportunity as the stock may be ready for a reversal.
- A potential entry signal is confirmed when the shorter moving average, EMA (9), and the medium-term average, EMA (30), crosses above the longer-term moving average, EMA (100).
This crossover signals a possible upward trend, giving us a more reliable entry point into the trade.
Short Trade Entry
We will first look at the Williams %R for a short entry to see if the stock or index is in the overbought zone. A potential short entry is triggered when the longer-term moving average, EMA (100), crosses below the medium-term EMA (30) and the shorter-term moving average, EMA (9).
Let’s look at an example to help us understand. We apply these indicators on the Nifty50 index on a 1-minute time frame chart.
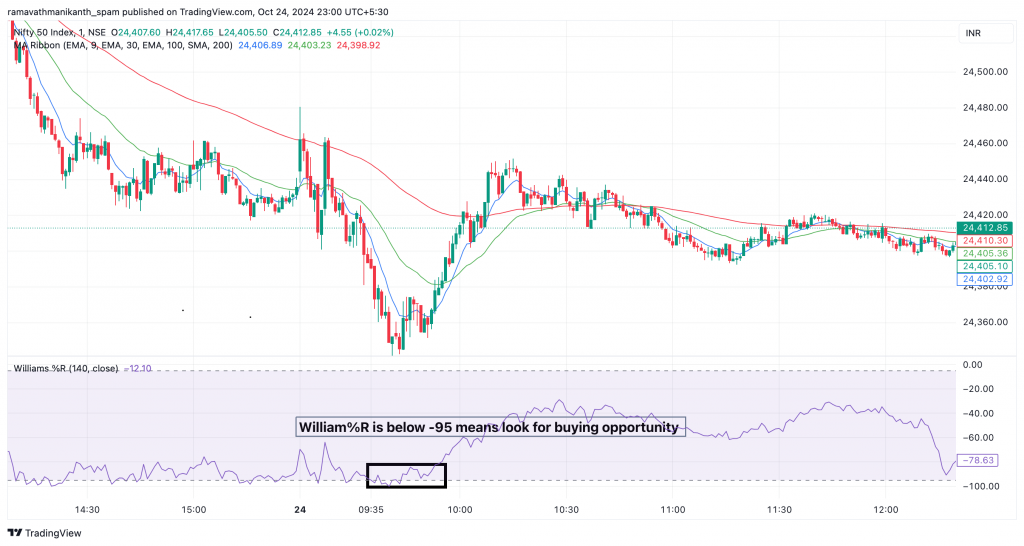
The above chart shows the Williams %R technical indicator, which shows the stock or index in the oversold zone, below the -95 level. This indicates a potential buying opportunity.
From the signal indicating the oversold zone through the Williams %R technical indicator, our next step is to confirm an entry using the EMAs.
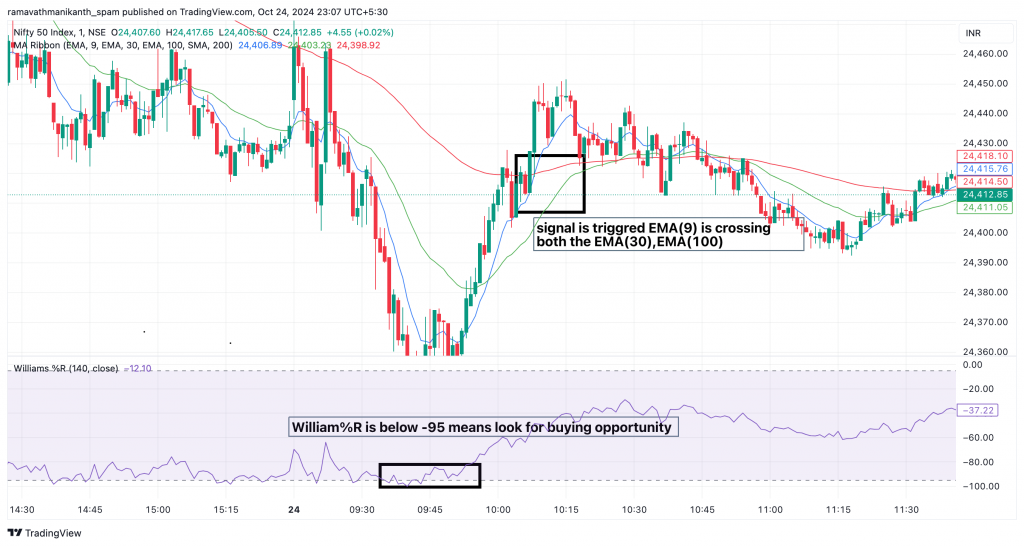
Next, as highlighted in the box, we see the blue line EMA(9) crossing above both the green line EMA(30) and red line EMA(100). This confirms the upward trend, and we quickly take our position to scalp the trade, aiming to capture profits from the reversal.
Planning the exit
Now, we will look at how to plan our exit. In scalping, exit strategies are just as crucial as entry points, if not more, because we are trading within minimal time frames. A delayed exit can turn a profitable trade into a loss in just a few seconds. So we have to lock our profits quickly.
Long Trade Exit
When holding a long position, we must exit once we lose bullish momentum. To identify this, we set our exit signal when the longer-term moving average, EMA (100), crosses below both the medium-term EMA (30) and the shorter-term EMA (9). This crossover signals a potential shift in momentum, indicating it’s time to exit the position and protect our gains.
Exit is for a long positon is triggered when EMA(100)>EMA(30)>EMA(9)
Short Trade Exit
Conversely, for a short trade, the opposite applies. The exit signal is triggered when the shorter-term moving average, EMA (9), crosses above the medium-term EMA (30) and the longer-term EMA (100).signaling uptrend in the amr
Exit for a short position is triggered when EMA(9)>EMA(30)>EMA(100)
Let’s continue with the previous example that was discussed in the entry.
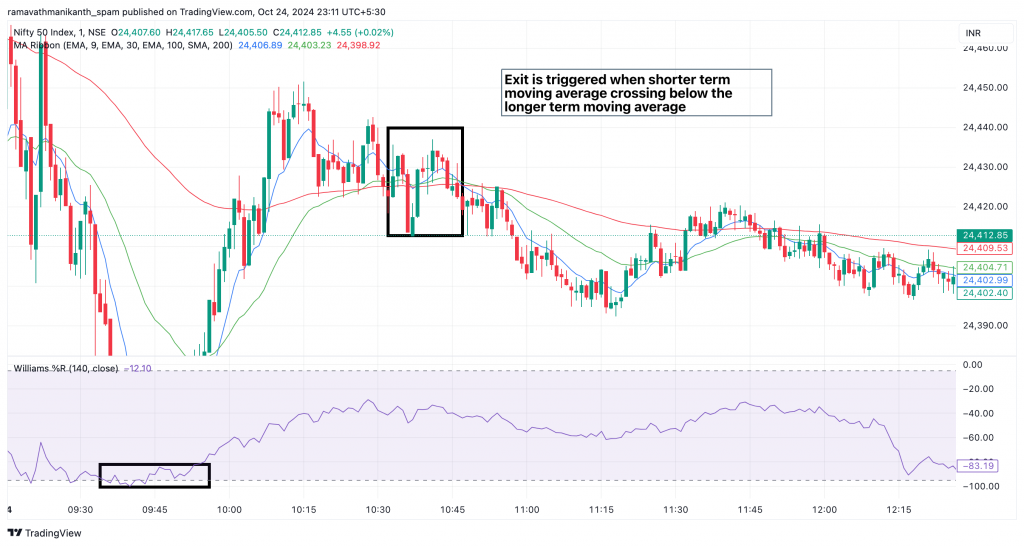
In the above pictorial representation, we can see all the EMA’s have converged, finally EMA(9) crossing below EMA(30), EMA(100)
Target And stop loss
Scalping requires a lot of discipline, which can be maintained by having predefined targets and stop-loss levels. Setting these limits helps minimize losses, especially in scalping, where trades are executed in shorter timeframes, and markets can be highly volatile.
For this scalping strategy, we will set specific targets and stop-loss levels based on our trading index. We will book profits in two stages: first, we secure around 60-70% of our earnings, and then we trail the remaining position until an exit signal is generated. Below is a table outlining the targets and stop-loss levels:
Index | First Profit Booking (Points) | Stop Loss (Points) |
Nifty | 15-20 | 20-25 |
Bank Nifty | 70-80 | 80-85 |
BSE Sensex | 100-120 | 140-160 |
Table Caption: Profit booking and stop-loss points for Nifty, Bank Nifty, and BSE Sensex in the scalping strategy.
Example
Let’s apply the scalping strategy using the Williams %R and EMA indicators to the Bank Nifty index and see how it performs.
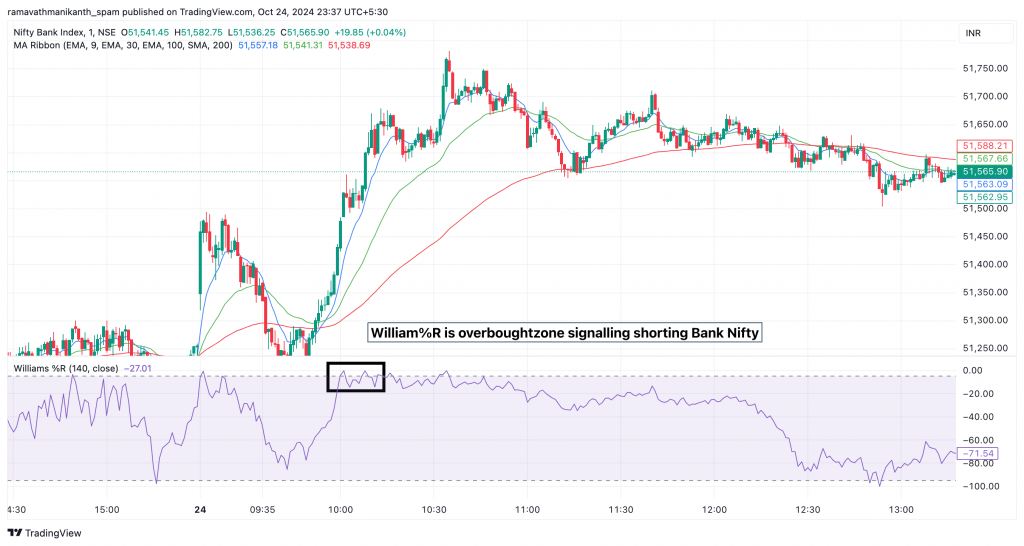
In the Bank Nifty chart, we first identified an overbought zone using the Williams %R indicator, which signalled that Bank Nifty was in an overbought condition, indicating a potential shorting opportunity.
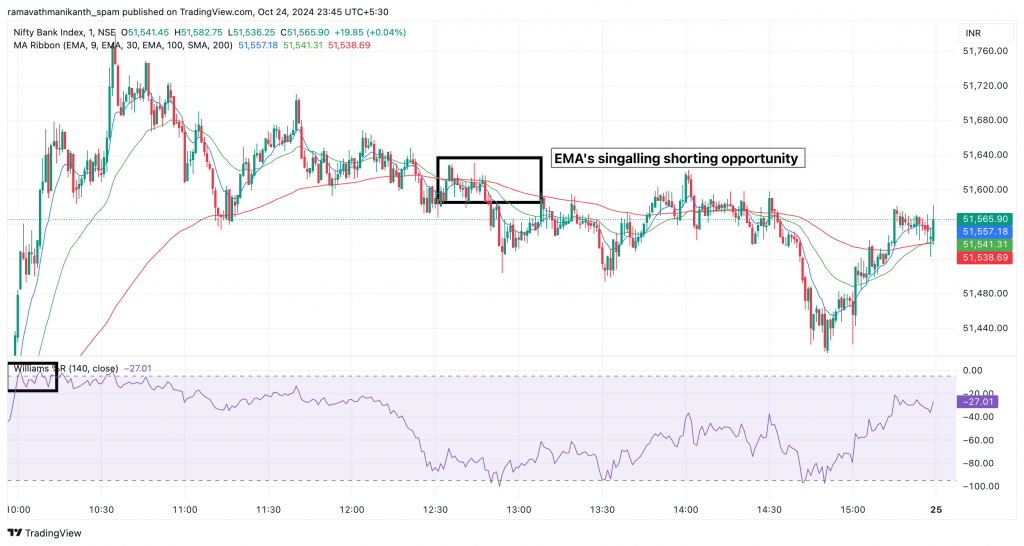
In the above chart, following our strategy, we identified an exit point after the short entry. We aimed to capture 70-80 points to book our first profit. After observing the price movement in line with the downward momentum, we successfully reached this target, allowing us to book the first part of our profits.
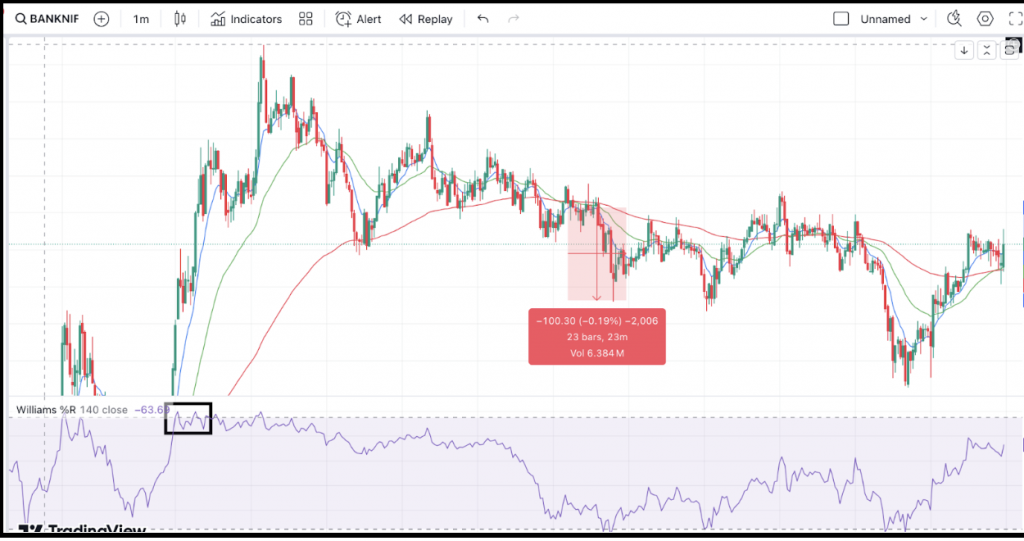
In this chart, we can see the first profits made by the trade in just 23 minutes.
Things To Remember
This scalping strategy is a great way to catch the quick reversals in the market, but there are some things to remember so that this strategy will work best for us.
- When EMAs trigger an entry, ensure they cross with a clear upward or downward slope. This confirms a strong trend and helps avoid false signals.
- This strategy is more suitable for extensive indexes like Bank Nifty because we are scalping in the 1-minute time frame. It should have sufficient liquidity to get executed; if we apply for stocks like Reliance or Infosys, then increase the time frame.
- Look for entries in the different correlated indexes or stocks to find trades with entry. For example, this can be (Nifty 50, Fin Nifty)
- We must remember that this strategy can be replaced with other technical indicators. We can use stochastic RSI instead of the William%R oscillator; this depends upon trading psychology.
Chapter 3: Big Bar Scalping Strategy
Overview
In scalping, the aim is to catch market trends fast, ride the momentum, and secure quick profits. This is especially important in options trading because a market that doesn’t move can lead to losses from time decay. This strategy focuses on capturing momentum in a specific stock or index to boost returns.
This is known as the “Big Bar Strategy’’, where we enter the market upon spotting a large candle. Since this strategy focuses primarily on options, we trade in highly liquid index stocks. The big bar strategy relies purely on price action without any specific indicators.
Price Action: Trend lines & levels
We determine entry and exit points in the big bar strategy using only support, resistance, and trend lines. Understanding these elements makes it easier to find reliable signals. Here’s an overview of each:
- Support: This is the stock price level where buying interest increases, preventing further price decline. It provides ideal entry points in a down-trending market.
- Resistance: A particular price level marks where a stock’s upward movement slows or reverses, typically as market participants perceive it as overvalued or due to other factors influencing sentiment.
- Trendline: A trend line is a straight line drawn on a chart to connect two or more price points, showing the overall direction of a stock’s movement. Whether upward, downward, or sideways.
Learn more about support, resistance, and trend lines in detail here.
3.3 Spotting an entry
Since options are involved, selecting the right strike price is crucial. Here is a table summarizing the weekly expiry days for significant indices in India.
Index | Weekly Expiry Day |
Nifty 50 | Thursday |
Bank Nifty | Wednesday |
Nifty Financial Services | Tuesday |
Spotting entries just after the weekly expiry is ideal, as options generally have lower premiums, and market direction is often more precise with reduced volatility. We use a 5-minute time frame here, ensuring sufficient liquidity in the index.
After the weekly expiry, we select OTM (Out of The Money) or ATM (At The Money) strike prices for options, as they are more sensitive to changes in the underlying asset and can yield quick gains. This approach gives option buyers sufficient time to benefit. However, as expiry nears, we prefer ITM (In The Money) options for entries, as they carry less risk and provide a better chance of profit.
For instance, if we are trading in Nifty50 with a weekly expiry on Thursday, we begin searching for entries from Friday onwards. Below is an image of the Nifty option chain, whose current value is 24,304 (as of 2nd November 2024). The ATM strike option from the OI (Open Interest) chain is 24,300, with multiple OTM and ITM strikes available. With four more trading sessions before expiry, we will choose either the ATM strike or a nearby ITM strike for better positioning.
If we’re bullish on this strategy, we can choose the 24,300 ATM strike or go slightly more profound with a 24,100 ITM strike. Selecting the ATM or a lower ITM strike depends on individual risk appetite and predictions for Nifty’s movement.
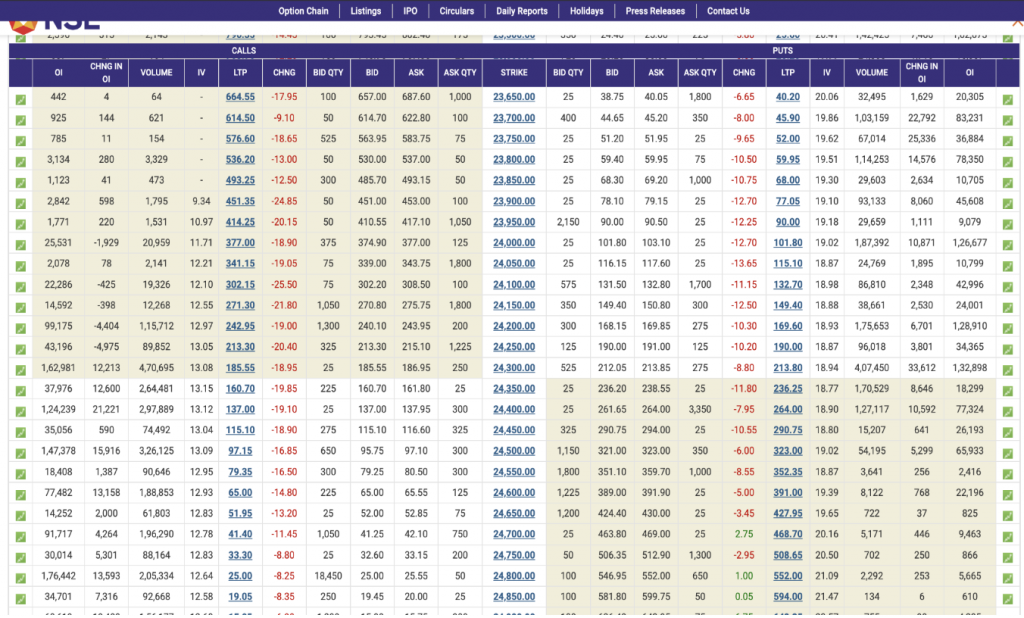
Now, let’s find an entry using the big bar strategy. Here are the conditions for a long entry:
- The first step is to identify at least 4-5 candlesticks moving sideways within 30-35 points.
- The next step is to look for a big candlestick that engulfs these uncertain, sideways candles.
Exactly. We enter the trade by setting the high of the breakout candlestick as our entry point. For this strategy to work effectively, the market should remain in a sideways range for at least 30-40 minutes. A big candlestick confirms the direction, indicating that the index is likely moving with clear momentum.
This strategy becomes more apparent with an example. Below is a 5-minute chart of Nifty50. The black highlighted box shows the sideways movement, while the red highlighted candlesticks confirm the downward trend. Here, we’ve spotted an entry at the low of the breakout candlestick, indicating a potential downward move.
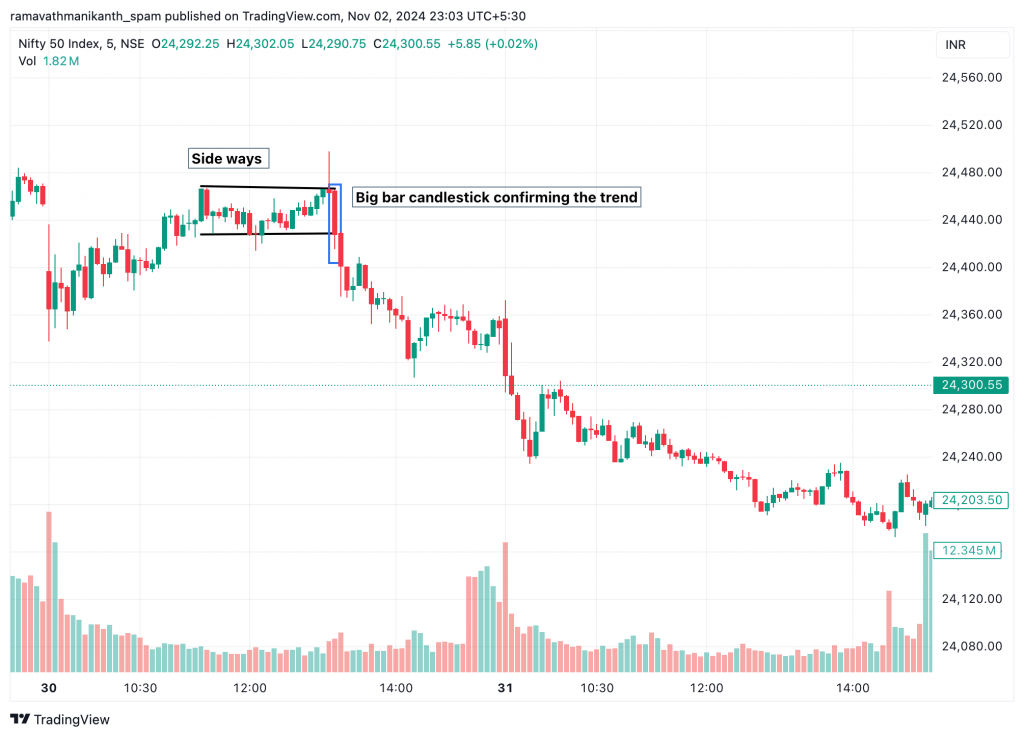
Planning the exit
In this strategy, planning exits is just as crucial as timing entries, so setting predefined targets is essential. We can book profits partially while keeping positions open. Here are some pointers for booking profits by trailing stop losses:
- The first step is to book 50-70% of our profits once we achieve a risk-to-reward ratio of at least 1:1.5. For example, if we have a stop loss of 30 points, we set the exit target at 45 points to capture sufficient gains.
- We can set the exit for the remaining capital at the previous day’s OHLC level. This acts as a safeguard, as there’s a higher chance of the market reversing. Booking remaining profits at this level helps lock in gains while minimizing risk.
Don’t forget to trail your stop loss after reaching the first target. This step minimizes risk and provides an opportunity to secure additional profits as the trade progresses, even if the market doesn’t get the final target.
Now, let’s see the same Nifty50 example exit.
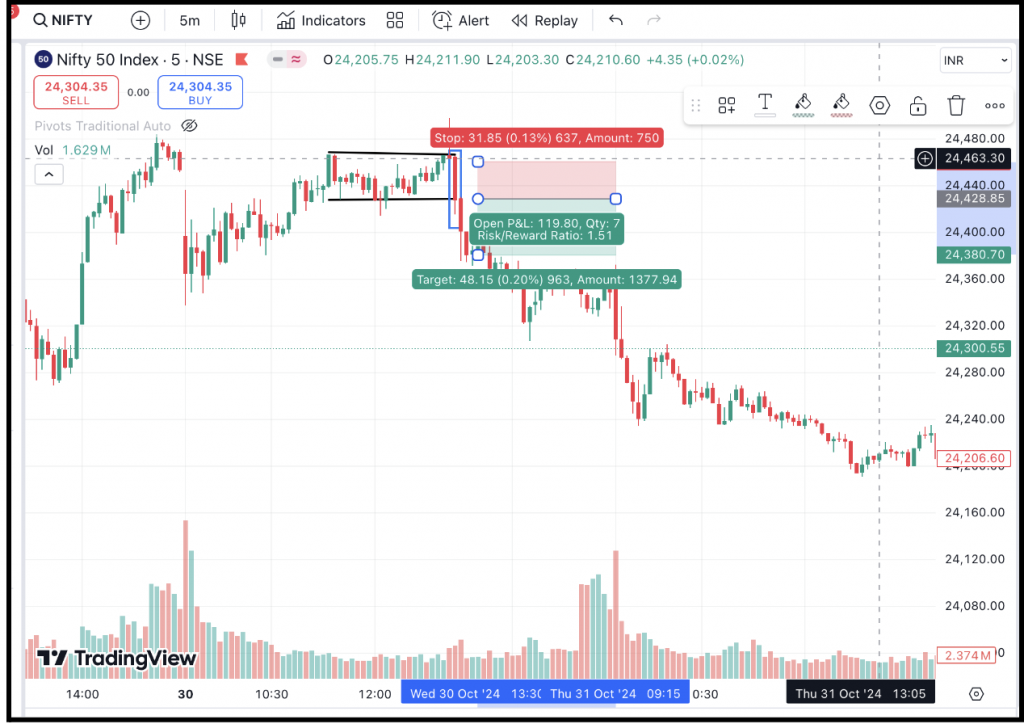
The chart above shows our first target set at a 1:1.5 risk-to-reward ratio. After booking profits at this level, the second target is ideally the previous day’s low, as we are in a short position.
The chart below illustrates this second target level, showing how we aim to maximize gains if the market continues downward.
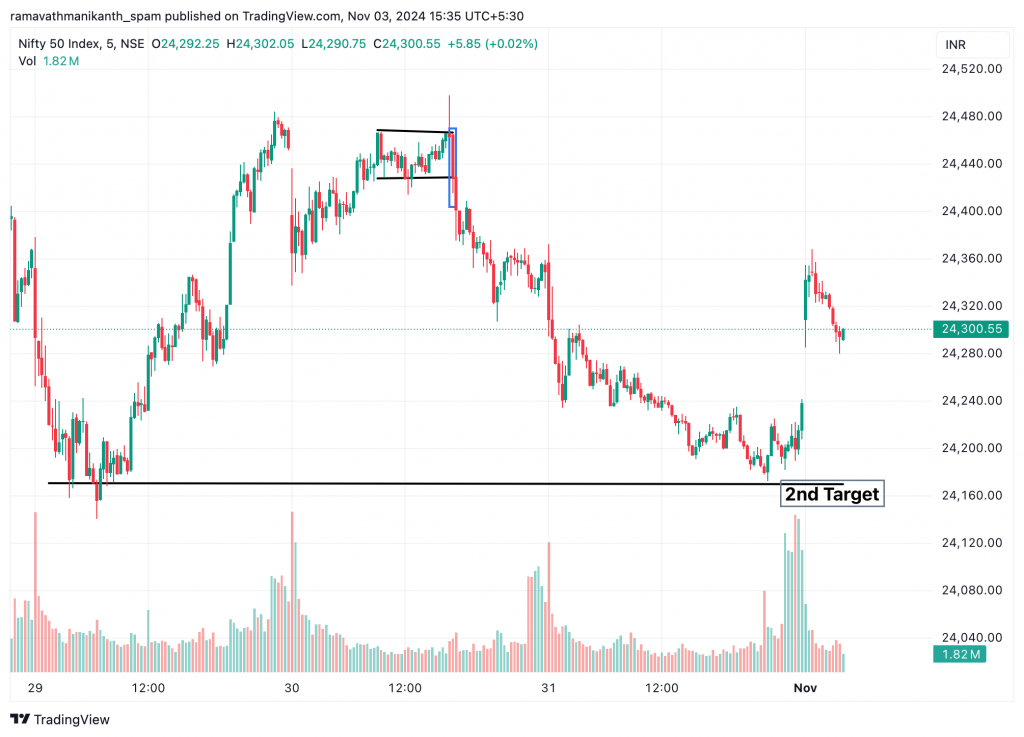
Stop loss
Sometimes, the big bar strategy can result in false breakouts, often due to systematic risks in the market. To protect against losses, it’s essential to set a stop loss. For the big bar strategy, we can put our stop loss in two ways:
- We can also use a traditional approach by setting a 30-point stop loss from the entry point. This stop-loss level can be adjusted based on the trader’s risk appetite.
- Another way to set our stop loss is by identifying the swing low for a long trade or the swing high for a short trade. Using this exact level as the stop loss aligns with recent price action, providing a logical exit if the market reverses beyond these critical points.
Swing low and high are set as stop losses because they often act as natural support and resistance levels, where buying or selling pressure is likely to emerge.
In this example, as a short trader, we can set the stop loss using both the risk-to-reward ratio and the swing high level. This means placing the stop loss at the recent swing high while ensuring the target aligns with a 1:1.5 risk-to-reward ratio.
Here is a pictorial representation of it:
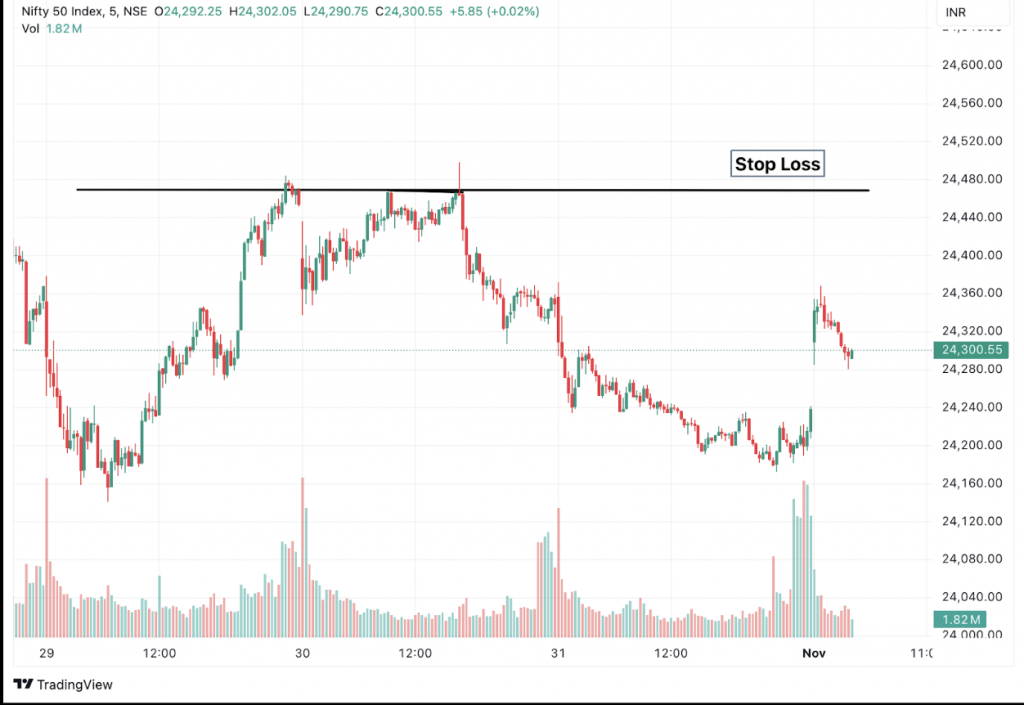
Examples
Now, let’s explore some examples of applying the big bar strategy to Bank Nifty! Start by setting the chart to a 5-minute time frame and look for entry signals.
Identify a range where there’s an apparent struggle between bullish and bearish forces, often leading to indecisive candlesticks like doji or spinning tops.
The chart below shows several indecisive candles, followed by a big green candlestick, such as a bullish marubozu. This strong, decisive candle confirms direction, and we open a long trade precisely at the close of this candle.
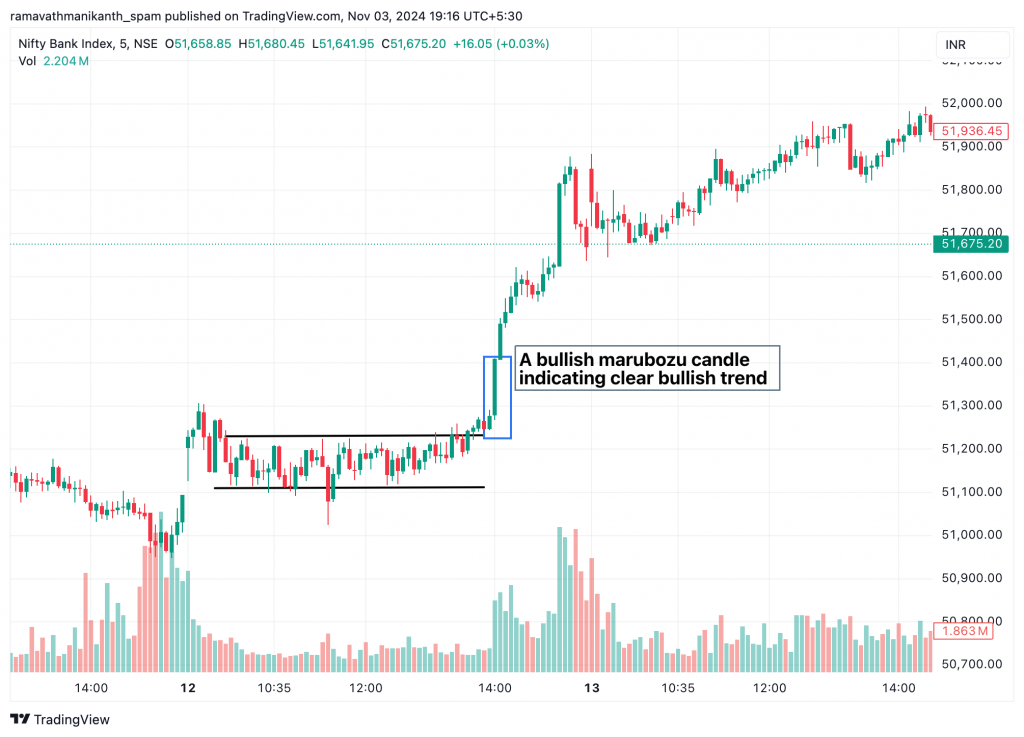
For this position in Bank Nifty, we set the stop loss based on a risk-to-reward ratio. Specifically, we place the stop loss at the exact low of the range, treating it as support since several candlesticks are within that range.
With the entry at the high of the big candlestick, we set our first target according to a 1:1.5 risk-to-reward ratio, aiming for a balanced and achievable profit level while managing risk effectively.
The image below shows the entry point, stop loss, and first target for our position.
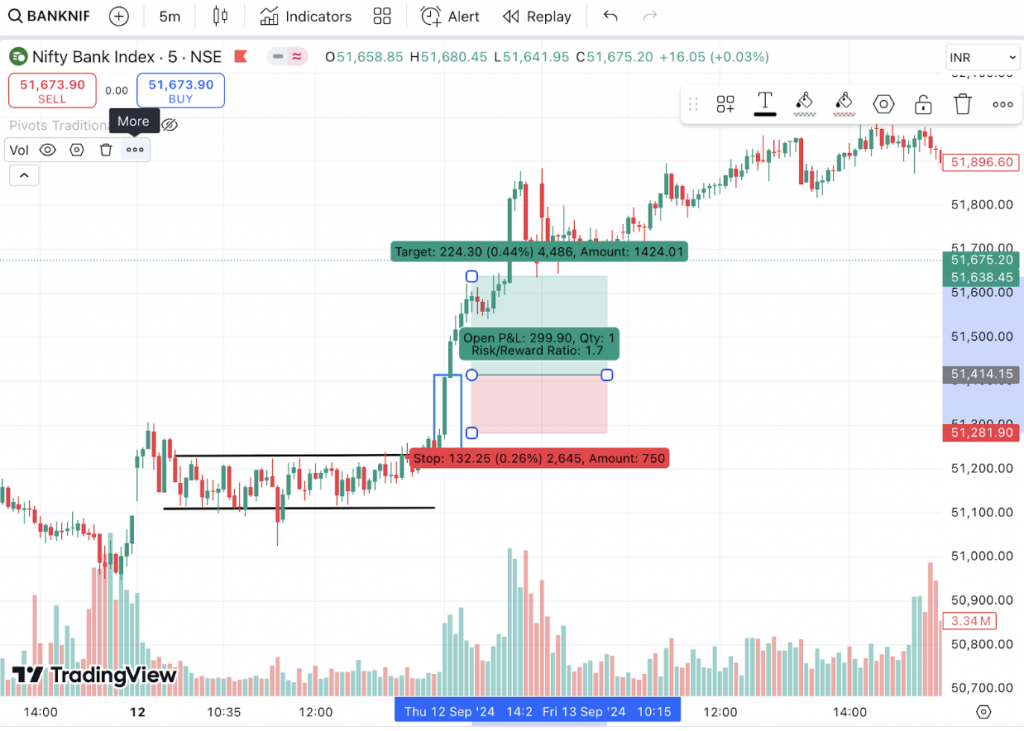
After booking our first profits, we can set the next target at the high on the previous day. If a clear swing low isn’t available, we can use a higher risk-to-reward ratio, like 1:2 or more, based on our risk tolerance. Additionally, we should trail our stop losses as we book further profits, helping to lock in gains while allowing for more potential upside.

This strategy has achieved a 1:2 risk-to-reward ratio, as shown in the image above.
Things To Remember
There are a few key points to remember when confidently trading this strategy and keeping risks in check. Let’s dive into the essentials to boost your trading game and protect your capital!
- When identifying entries in any index, ensure that at least 5-8 candlesticks are consolidated. The longer the sideways movement, the stronger the potential breakout, with a lower chance of a false breakout.
- Sometimes, even when our strategy aligns perfectly, large institutional players can trigger stop losses before the market moves as expected. To avoid this, set your stop loss slightly below (or above, for shorts) the usual level, adding a buffer against these stop-hunting moves.
- For the big bar strategy, use bullish marubozu or engulfing patterns for long trades and bearish marubozu or engulfing patterns for shorts. These candlestick patterns help reduce false breakouts, making entries reliable.
- When considering an entry, keep an eye on trading volumes. Ensure that the volume bar is at least 60% above the moving average volume.
- After we get the hang of this strategy on major indexes like Nifty and Bank Nifty, we can try it out on highly liquid stocks, such as Reliance.
Chapter 4: MACD Scalping Strategy
Overview
To find a good trade, we need two things: first, to see the market trend, whether it’s going up (bullish) or down (bearish), and second, to know the best time to enter after we understand the trend. This MACD scalping strategy helps with both. We only use one indicator, the Moving Average Convergence Divergence (MACD), and combine it with divergence to find the right points to enter and exit the market.
We’ll review the concept of divergence since it’s the core of this strategy. The MACD scalping strategy works best for indexes with high liquidity, like Nifty50, Bank Nifty, and Fin Nifty. These liquid indexes are ideal since we scalp on a 1-minute time frame. We also use double bottom and double top patterns to help identify entry and exit signals. This strategy includes predefined stop-loss and target points, as we’re trading in such a short time frame.
MACD and divergence
In this scalping strategy, we’ll use the MACD technical indicator to determine entry points after identifying the trend. Traders often use MACD, a momentum oscillator indicator, to trade based on trends.
The MACD has three main components: the MACD line, the signal line, and the histogram. Here’s how each one is calculated:
MACD Line=Shorter-period EMA−Longer-period EMA
Signal Line=EMA of the MACD Line over a chosen period.
Histogram=MACD Line−Signal Line
Check out an in-depth explanation of MACD here.
Divergence
Divergence happens when the price moves in one direction while an oscillator (like MACD or any other) moves in the opposite direction. Divergence is a powerful concept because it can signal where the market might reverse direction, helping traders identify potential entry and exit points more accurately.
Divergence is mainly categorized into three types: strong, medium, and hidden divergence. To identify divergence on a stock or index we are trading, we start by spotting higher highs or lower lows in the price and then compare these with the indicator. Based on the divergence type, we decide on our trade. Here’s a look at the three types of divergence:
Strong Divergence
This occurs when we find a clear and sharp contrast between the price of a stock or index and a technical indicator like RSI or MACD.
For example, in the chart below of Nifty50, the price clearly forms a lower low, but the technical indicator forms a higher high. This means the index has lost momentum in the bearish direction and may now reverse.
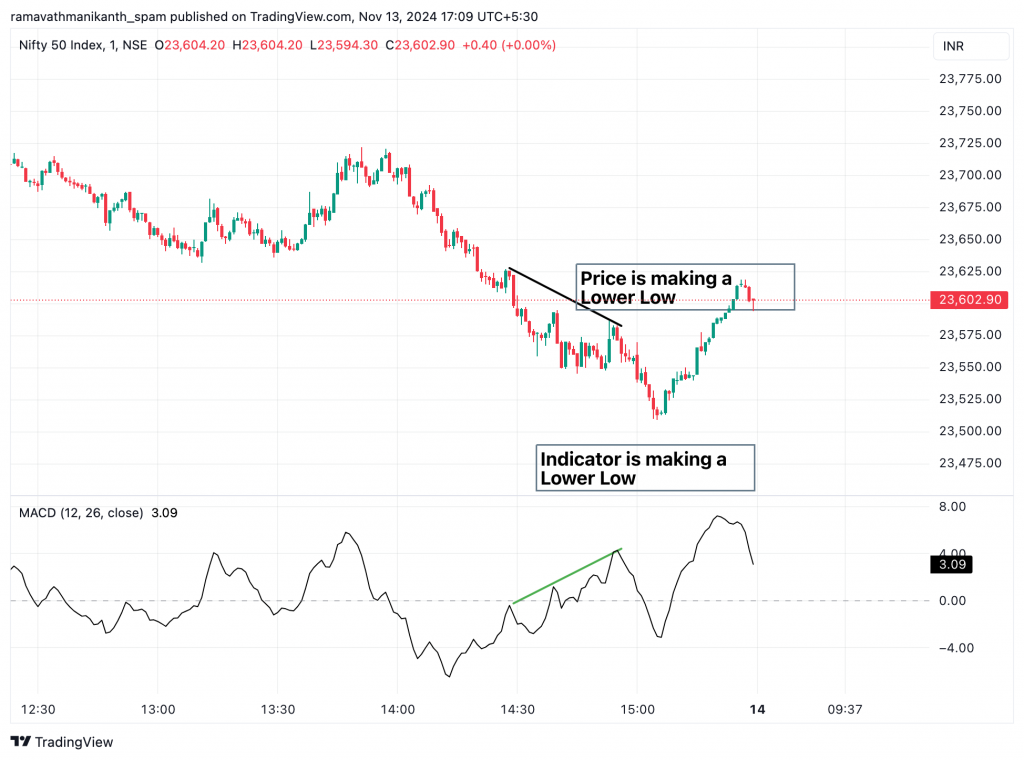
Just after that, the Nifty went up, indicating solid divergence in the market.
Medium Divergence
We find this type of indicator when both the price of the stock/index and the technical indicator show diverging effects. This indicates a shift in momentum rather than a clear reversal signal, meaning this type of divergence has a lower probability of causing a market reversal.
Here is an example of it on the Bank Nifty chart:
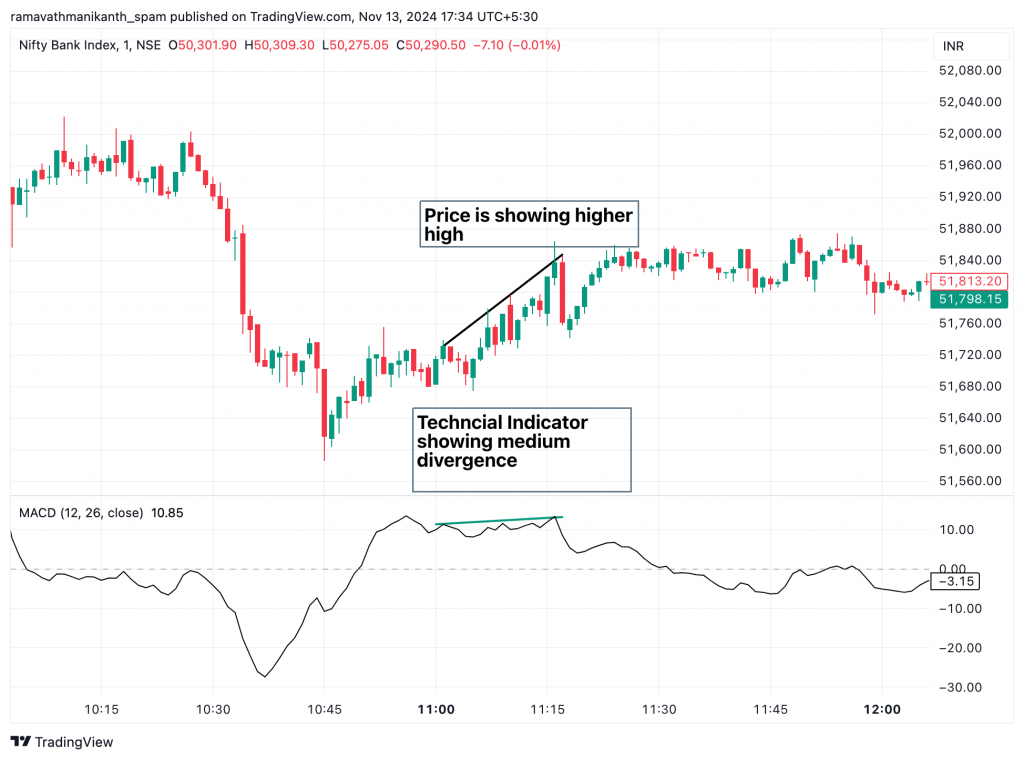
Medium divergence is more commonly found in sideways and choppy markets. In the image above, we can see that although divergence occurred, the market went sideways afterward. Therefore, it’s often better to take trades based on this type of divergence in such market conditions.
Hidden Divergence
This is the final type of divergence. We see this when both the technical indicator, like MACD or RSI, and the price of the stock/index form the same pattern, such as both making higher highs or lower lows. This indicates that momentum is still present in the ongoing direction, whether bullish or bearish.
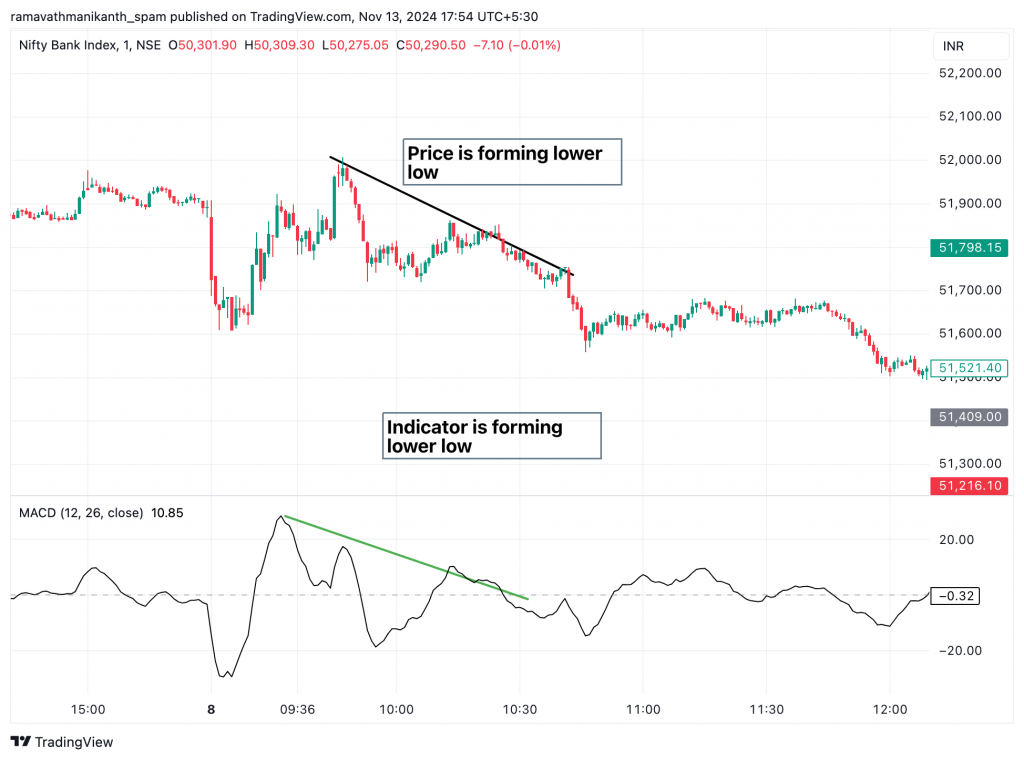
In the image above, we can see both the indicator and the price forming lower lows, and afterward, Bank Nifty continued to decline. This is a sign of hidden divergence, indicating that we should take trades based on the trending market.
How to spot a divergence
Divergence helps us identify trend reversals, but some of us may find it challenging to spot divergence between the price of a stock/index and a technical indicator. To make this easier, we can switch to a line chart for both the price and the indicator. This way, we can more easily identify divergence in the stock.
We can see how it will look if we switch to a line chart. As we can see in the image, it is easy to find the divergence when we switch to a line chart.
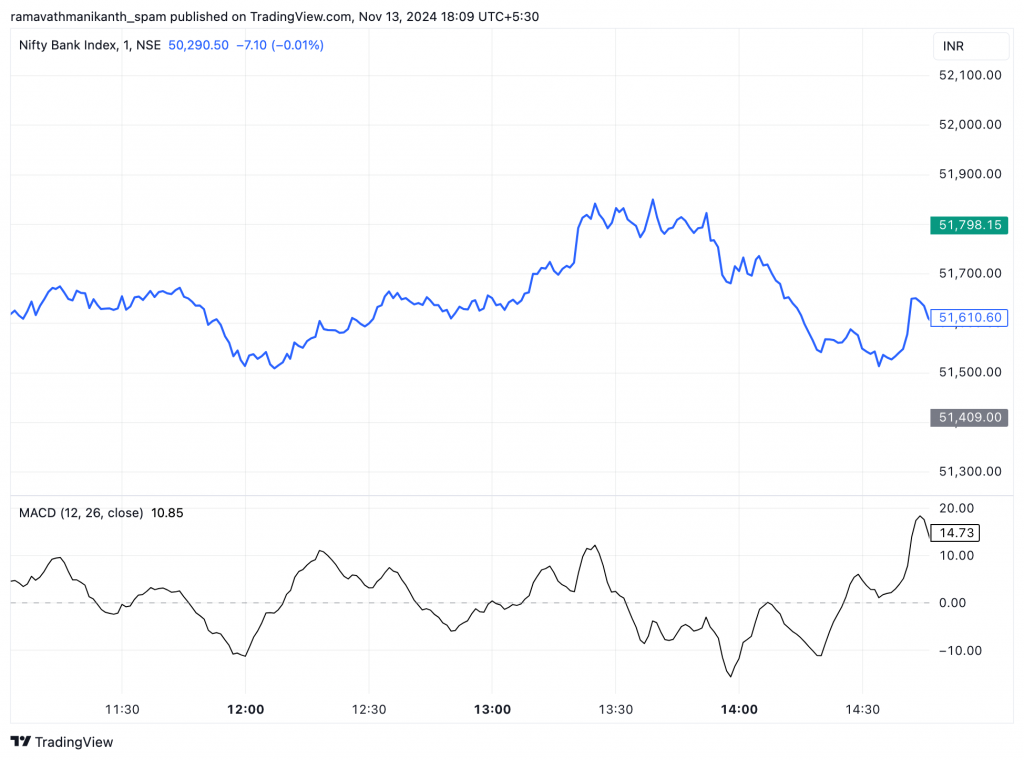
Here is a step-by-step approach to finding divergence:
- Check the line chart for recent highs and lows in both the price and the indicator.
- If there’s a clear difference, like a higher low in price and a lower low in the indicator, it’s a strong divergence. This often signals a possible trend reversal.
- If the difference is small, it’s a medium divergence. This usually means a slowdown, not a full reversal.
- If the price trend is up but the indicator shows a downtrend (or vice versa), it’s hidden divergence. This suggests the current trend may continue.
Spotting an entry
The MACD strategy uses a single technical indicator, but changing visibility settings can improve its components. In the updated setup, the MACD line is displayed as a step line instead of a histogram, and the signal and EMA lines are kept in the same colour. This makes it easier to read trends and spot entry or exit points.
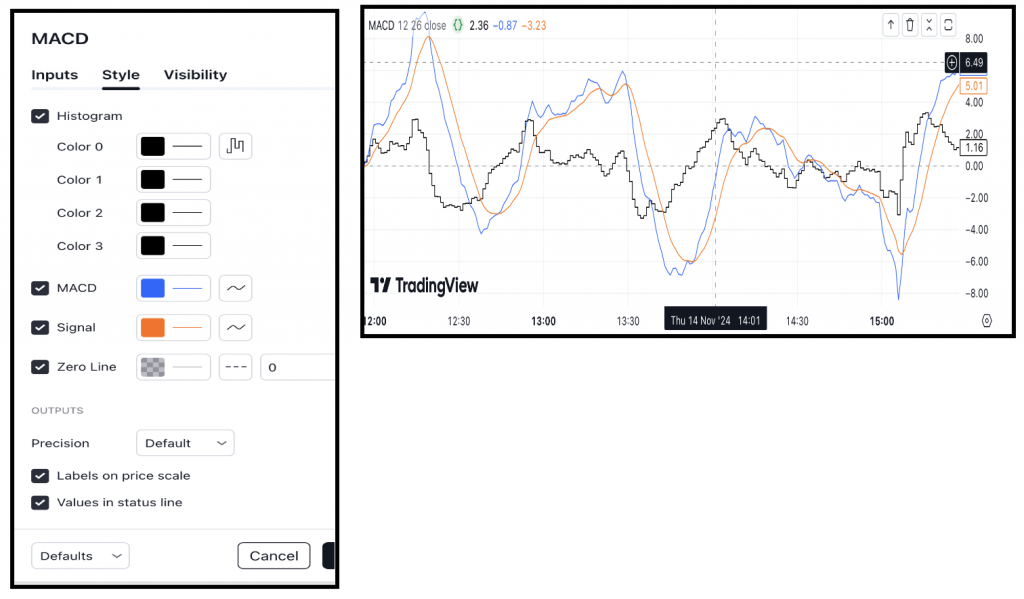
We have changed the regular histogram to stepped lines, making spotting divergences and identifying entry signals easier. Now, let’s focus on recognizing bullish and bearish entry points. Since we’re trading indices, we’ll use options to take positions, buying calls or puts based on our market anticipation.
Bullish Entry
This strategy focuses on spotting reversals, so we must watch for opposing trends to uncover trading opportunities. In this case, we look for a downtrend to identify bottoms and observe the type of divergence forming. It becomes easier to pinpoint these bottoms when we hide the MACD and signal lines, focusing solely on the histogram. Here are the specific conditions to follow for this approach.
- Mark two consecutive lower lows in a downtrend as potential reversal points.
- Observe for strong divergence in the MACD indicator, indicating a trend shift.
- Enter the trade when the MACD line crosses above the signal line, confirming the momentum.
When we find a substantial divergence combined with a MACD crossover, it strongly indicates a change in trend direction. For example, this setup can signal a potential bullish reversal in a downtrend. Below is a chart illustrating this in a strong downtrend.
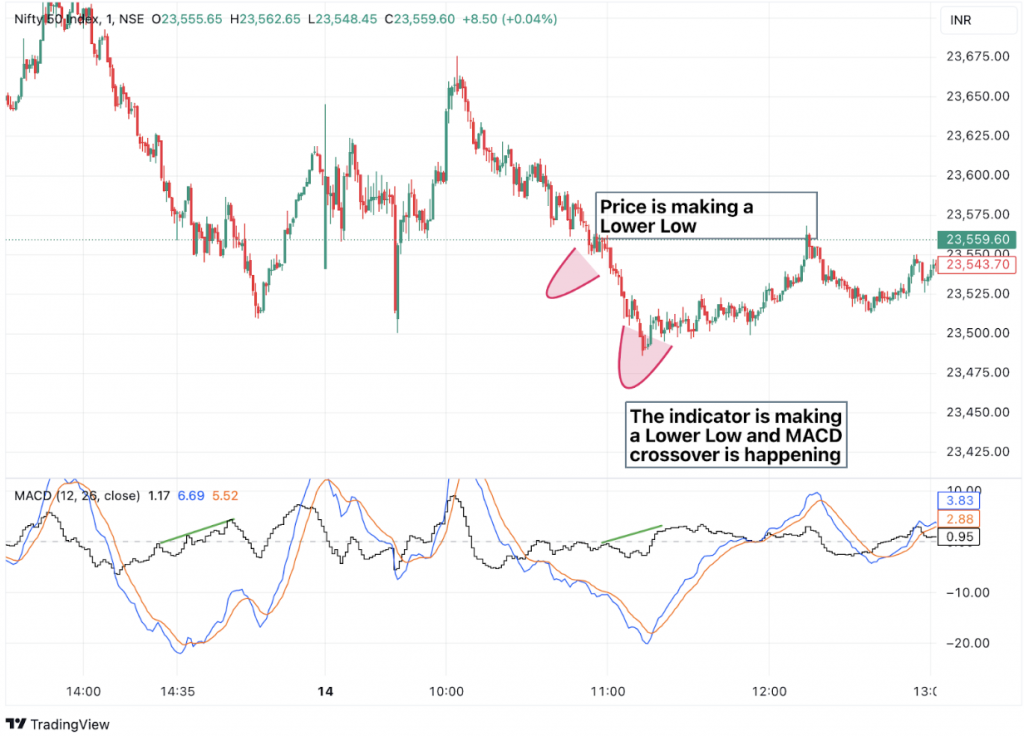
For the bearish entry, we need to short the index here are its conditions.
- Mark two consecutive lower lows in a downtrend as potential reversal points.
- Observe for strong divergence in the MACD indicator, indicating a trend shift.
- Enter the trade when the MACD line crosses above the signal line, confirming the momentum.
Bearish Entry
Here’s a simple example to help clarify. In the image below, we see that after a strong divergence in the technical indicator, the uptrend in price reverses direction.
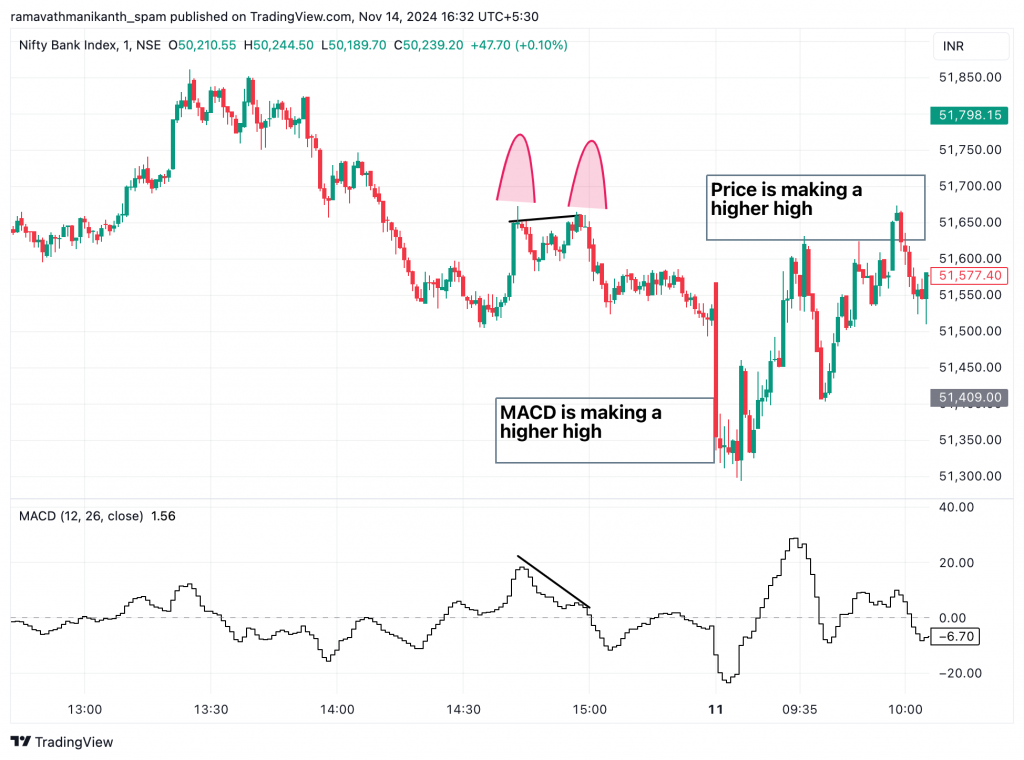
We will enter at the high of the specific candle, applying this approach for both bullish and bearish trades. Since we’re trading highly liquid indices like Nifty and Bank Nifty, we’ll buy At-The-Money call or put options at entry. With predefined targets and a close stop loss, we can manage risk effectively without worrying about the impact of delta or theta (options Greeks).
Now, we will move on to the exit part of this MACD strategy.
Planning a exit
In this MACD divergence strategy, there are two exit options. One approach is to set a predefined target, aiming for a specific number of points based on the chosen time frame. The other option is to exit based on the MACD indicator, similar to the entry, by watching for a crossover in the opposite direction. This ensures flexibility in capturing profits or adjusting to market conditions.
Pre-defined target
We are trading on a 1-minute time frame using the MACD divergence strategy, with a 50-point target as our exit signal for both directions. For example, if we enter a trade when the Nifty50 index is at 23,523, our target will be 23,473. Since the 1-minute time frame is highly volatile, a moderate target of 50 points suits this strategy well.
Setting a predefined target adds structure to our trades, promotes disciplined trading, reduces emotional influence, and supports effective risk management. Ultimately, this approach helps improve consistency and sustainability, which is essential for scalping.
MACD exit
This type of exit is more suitable for slightly higher time frames because MACD crossovers take longer to develop, providing more apparent and more reliable signals. However, price movements are more volatile on shorter time frames like 1-minute charts, often causing frequent MACD crossovers that can lead to premature exits.
Let’s look at the pre-defined type of exits for the MACD divergence strategy.
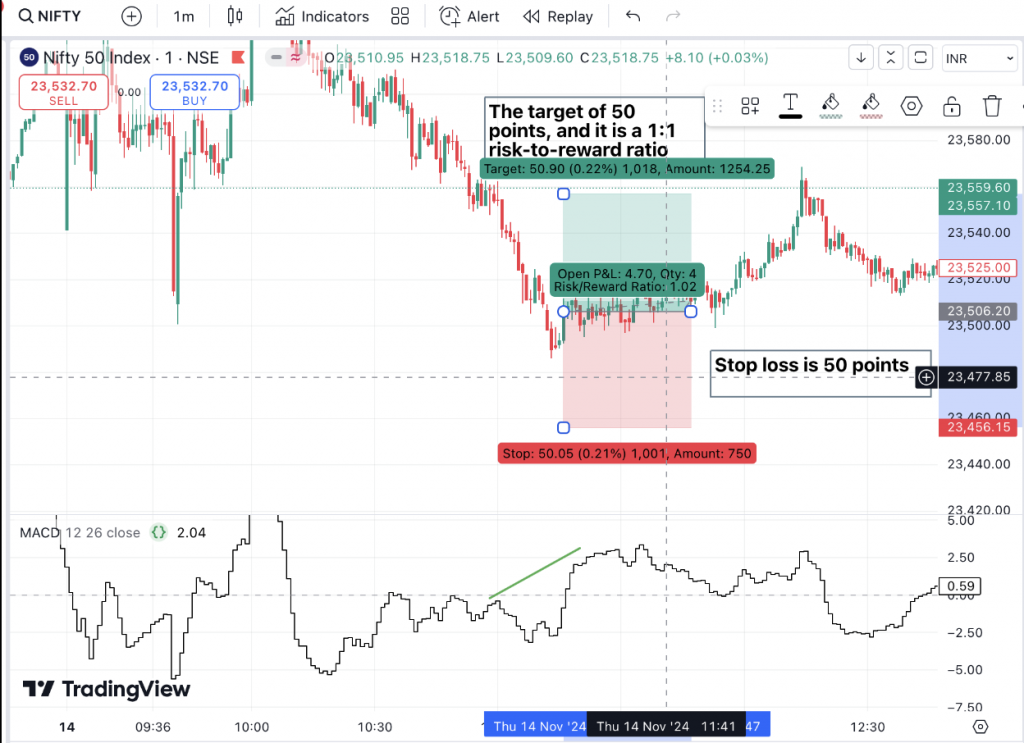
The image above shows that the target is set using the first exit method (predefined target) and is nearly achieved within a short time frame of just one hour. This demonstrates the effectiveness of a 1:1 risk-to-reward ratio in a volatile 1-minute chart setting.
Stop loss
In the MACD divergence strategy, we can set up stop loss based on the risk-to-reward ratio of 1:1, where we enter the crossover signal at the high of the candle at the 1-minute time frame we keep the stop loss as of 50 points in the index/stocks.
We can set the stop loss using the crossover of the MACD indicator. This way, we follow the indicator’s signals and stay in the trade as long as the trend continues. However, this approach is riskier because MACD signals can be delayed, which might cause bigger losses if the price moves sharply before the crossover. It can also lead to early exits in choppy or unstable markets, making it harder for us to capture the full profit from a trend.
Example
We will explore additional examples using Nifty-50 and Bank Nifty to gain a deeper understanding of this strategy. We will apply the same approach as before, using a one-minute time frame and the MACD technical indicator.
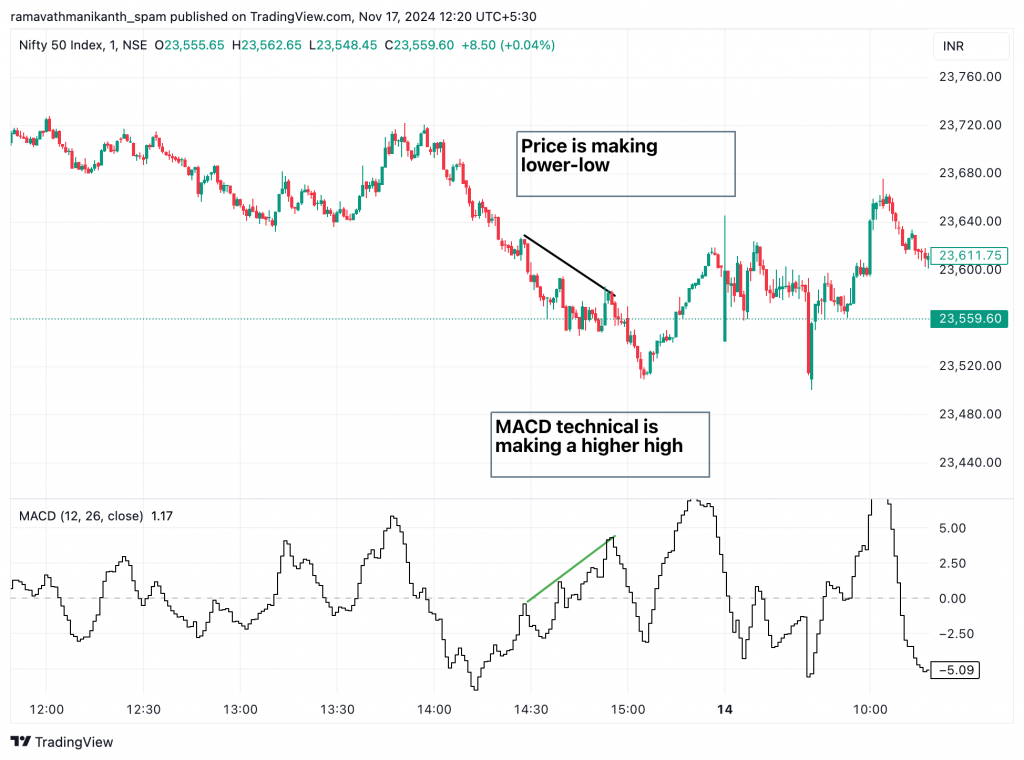
In the above chart of Nifty-50, the technical indicator shows a higher high, while the price forms a lower low. This indicates a strong divergence, suggesting a potential reversal. Following this divergence, the Nifty-50 has changed its direction, signalling strong bullishness. In this scenario, we will plan a long trade. We will wait for a crossover signal from the MACD technical indicator to confirm the bullish momentum for the entry point.
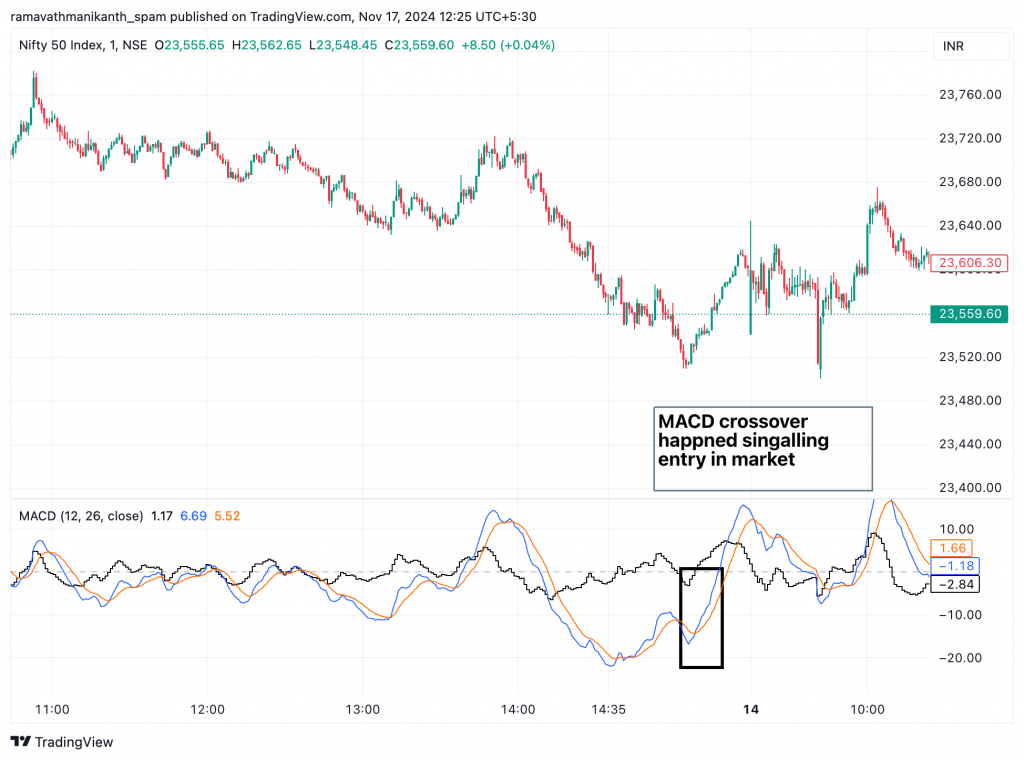
Here’s how the long trade is structured: we set a 50-point stop loss and a 50-point target. The target was achieved within 23 minutes, making it an efficient way to accumulate profits. In this scenario, we would have purchased the at-the-money (ATM) option in Nifty-50 and sold it after reaching the target, locking in the gains effectively. The pictorial representation is below.
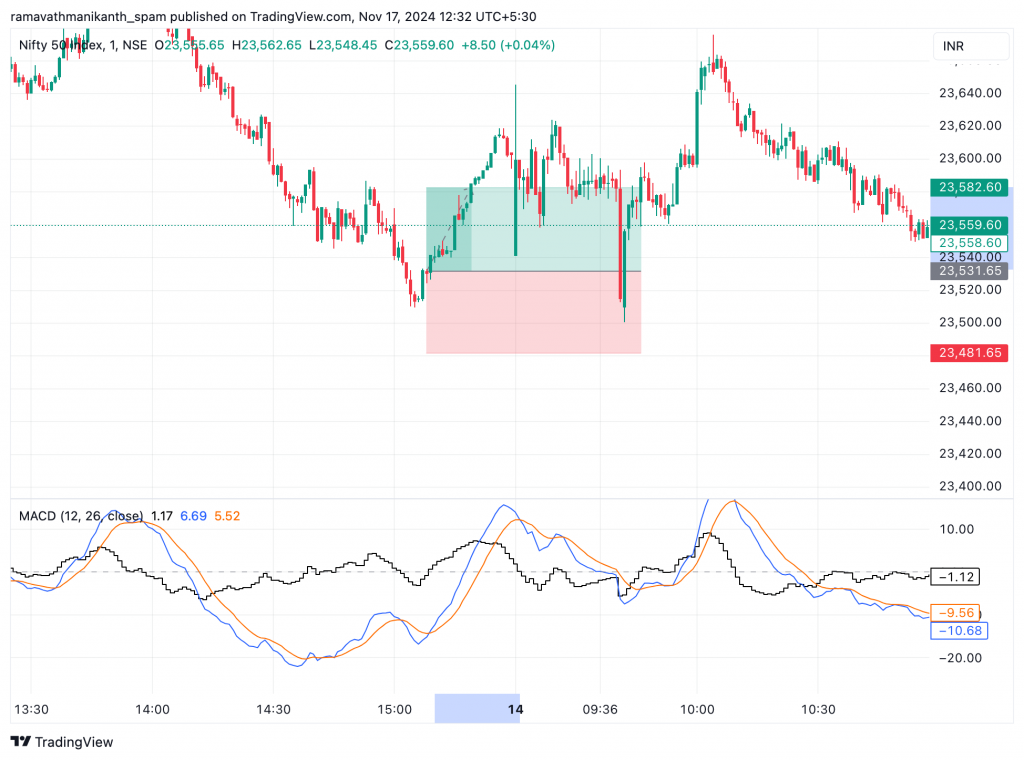
Things to remember
To understand what makes such setups effective, focusing on a few fundamental principles is essential. These include the importance of maintaining a disciplined approach; here are some critical things to remember:
- In this MACD divergence strategy, we have used the MACD indicator as an oscillator to identify trends and spot divergences. Other oscillators, such as RSI or Stochastic RSI, can also be used similarly.
- If we want to apply this strategy to stocks, it is crucial to focus on high-liquidity stocks.
- When making an entry, we should monitor volume closely. A higher volume, combined with textbook candlestick patterns like Marubozu or Morning Star, increases the chances of success.
- If we are risk-averse traders, we should stick to this disciplined trading style and prioritize high-probability setups.
Chapter 5: VWAP Scalping Strategy
Overview
Scalpers look for quick profits by entering and exiting trades fast. They focus on assets with high liquidity and strong movement, like Nifty and Bank Nifty in India. This strategy works on smaller time frames using highly traded stocks or indexes.
The method uses the VWAP (Volume Weighted Average Price) indicator to find entry and exit points. It is combined with RSI (Relative Strength Index) and EMA (Exponential Moving Average) to improve the scalping process. The VWAP strategy involves both buying and selling options contracts. To manage risk, stop-loss levels are set in two ways: using a risk-to-reward ratio and a trend-based EMA indicator.
Indicators used in this strategy
In this VWAP strategy, we’ll combine three powerful indicators to find the best entry and exit points. Each indicator plays a unique role, making trading smoother and more effective. Let’s break it down:
VWAP
The VWAP (Volume Weighted Average Price) is a technical indicator that shows the average price of an asset traded during the day, weighted by both price and volume. It gives more importance to prices with higher trading volume, making it a valuable tool for identifying fair value levels. Here’s the formula for VWAP:
VWAP = (Sum of (Price × Volume)) / (Sum of Volume)
This helps traders understand whether the price is overvalued or undervalued based on market activity. Check out VWAP here.
EMA
We’ve used EMA (Exponential Moving Average) in several other strategies, but here’s a quick recap. Unlike the simple moving average, EMA places more weight on recent price changes, making it more responsive to current market trends and better suited for dynamic trading conditions.
EMA_today=(Pricetoday×K)+(EMA_yesterday×(1−K)) K=smoothing constant
More in-depth explanation about EMA here
RSI
The final indicator we’ll use is the Relative Strength Index (RSI), a momentum indicator that tracks the speed and direction of price movements. RSI ranges from 0 to 100, with readings above 70 signaling that an asset may be overbought and readings below 30 indicating it may be oversold. Traders rely on RSI to identify potential buy or sell opportunities and to anticipate trend reversals based on market momentum.
Add Your Heading Text Here
We are analyzing entries based on 3-minute candlestick patterns. The settings for the 20 EMA are configured to consider the closing prices of the last 20 candles. We will use the RSI with a period setting of 20 to refine our entry points.
The leading indicator, VWAP, will be adjusted by unticking the boxes for the upper, lower, and bands fill #1. This modification ensures that only the VWAP line remains visible. Below is a snapshot of all the indicators for better clarity and understanding.
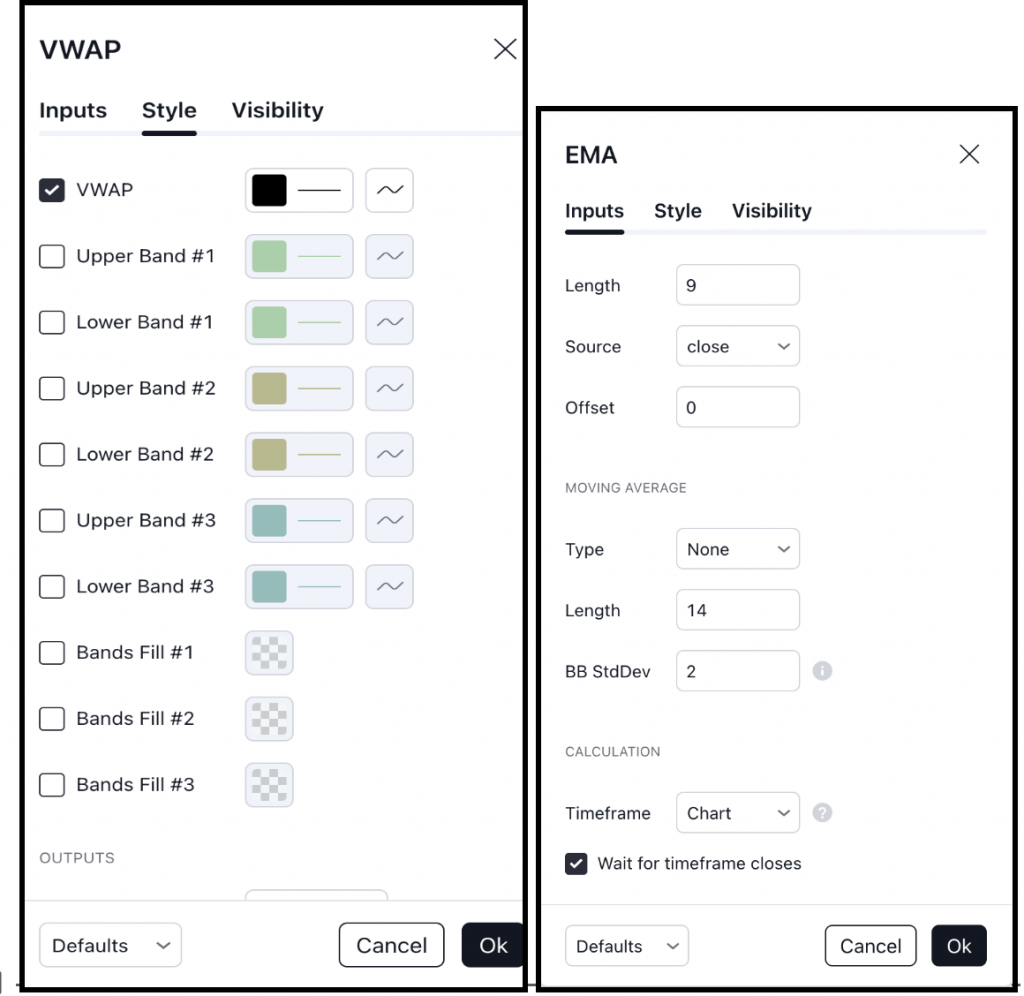
Below are the specific conditions for implementing this strategy effectively:
- The index price is more than 20 EMA technical indicator
- The closing price of the candlestick was more than VWAP
- The oscillator indicator RSI should be more than 50 level
Using the EMA technical indicator, we ensure a bullish entry by confirming that the trend is intact. The VWAP helps us identify buyer dominance, as the price trading above the average paid for the asset indicates vigorous buying activity. When the RSI is above 50, we interpret it as a sign of bullish momentum, confirming an upward trend and its strength. This approach helps us avoid weak or fading trends, increasing the chances of entering a strong and sustainable move.
Let’s take an example of a Nifty chart on a 3-minute time frame to understand better how bullish this strategy is in action.
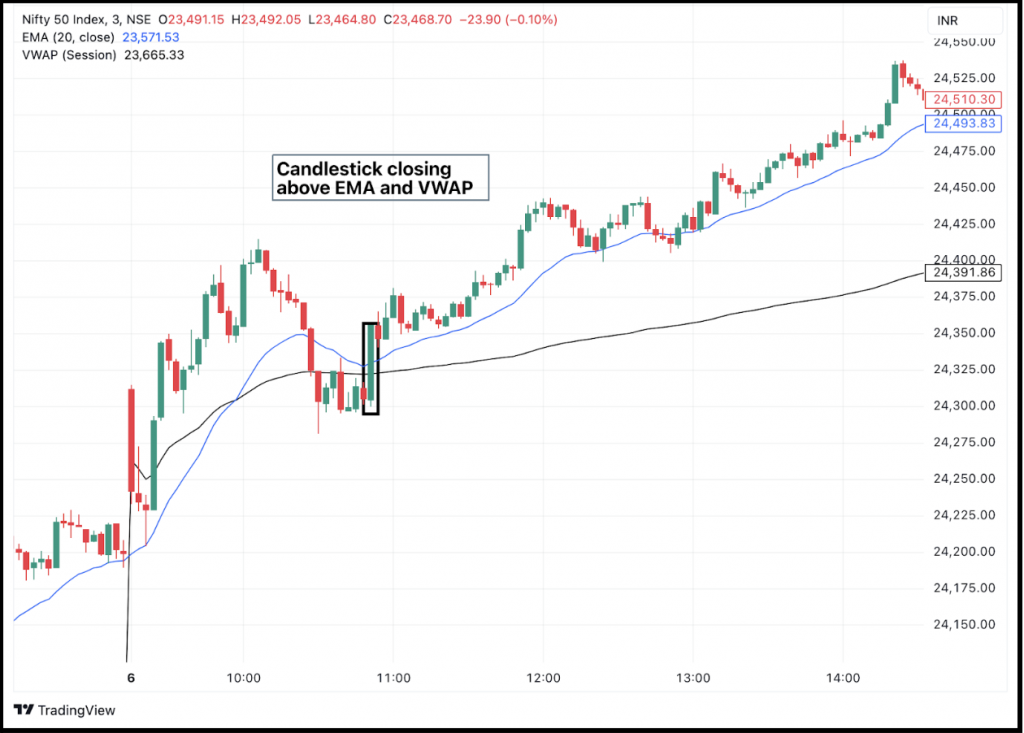
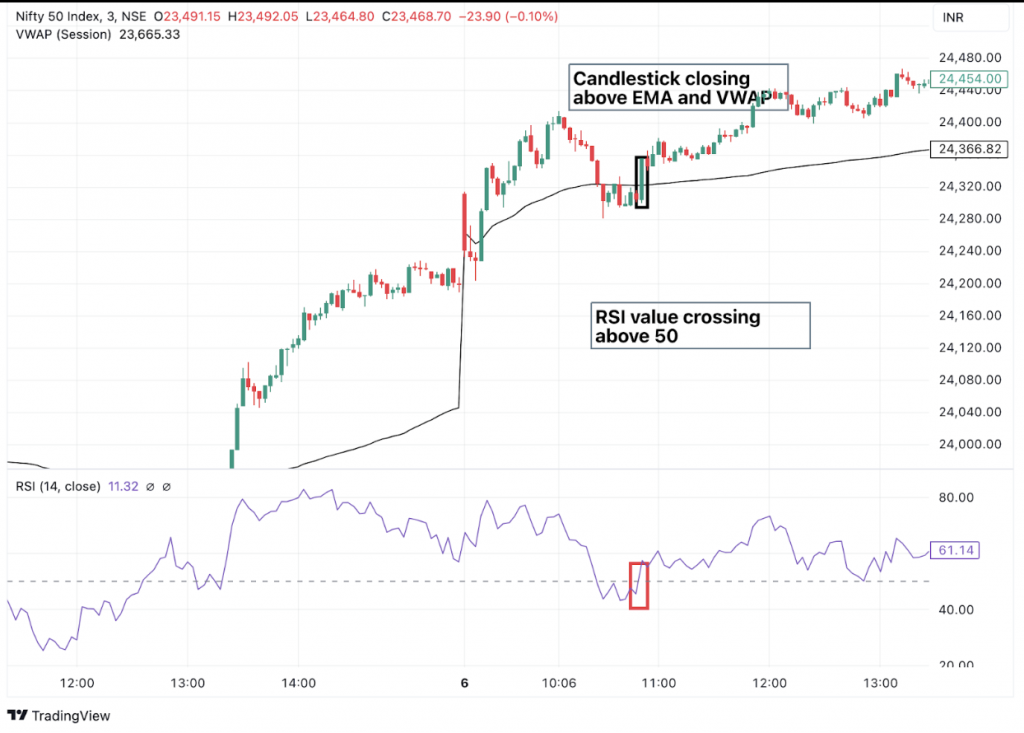
The above chart shows that all three indicators are perfectly aligned, signalling a bullish entry. We can proceed to the Nifty-50 option chain and buy an At-The-Money (ATM) call option to capitalize on the trend. Alternatively, we could also consider the ATM put option to assess profitability, but in a bullish market, call premiums are generally priced higher since they attract more buyers.
However, if we do not foresee a substantial upside in the market, it may be prudent to sell the call option. This approach allows us to benefit from time decay if the market moves sideways, ensuring we can still generate some profit as the option contract expires.
Now that we have a clear understanding of how to take positions in a bullish market, let’s move on to bearish entry strategies. The criteria for a bearish entry are outlined below.
- The index price is less than 20 EMA technical indicator
- The closing price of the candlestick has to be less than VWAP
- The oscillator indicator RSI should be less than 50 level
Making a bearish entry often involves buying a put option, which allows us to profit as the index moves downward.
Planning the exit
Now that we are clear about the conditions for entering the stock let’s move on to understanding when to exit. Knowing when to exit is crucial, as high volatility in the index, especially on lower timeframes, can lead to sudden price swings. To manage this effectively, we decide on the exit point at the time of entry. In this scalping strategy, there are two exits: one based on the EMA indicator and the other on a predefined risk-to-reward ratio.
Risk-to-reward ratio
In this strategy, the risk-to-reward ratio is exciting. We set our exit point when the index reaches twice the distance of the candlestick’s low distance from the entry price. This creates a clear trading plan, establishing a risk-to-reward ratio of 2:1. This method is efficient and straightforward to implement, as it takes advantage of decisive price moves. With a 2:1 reward-to-risk ratio, the overall profits can still exceed losses even if the success rate is only 50%. Below is an example from the Nifty-50 chart illustrating how we exit based on this risk-to-reward ratio.
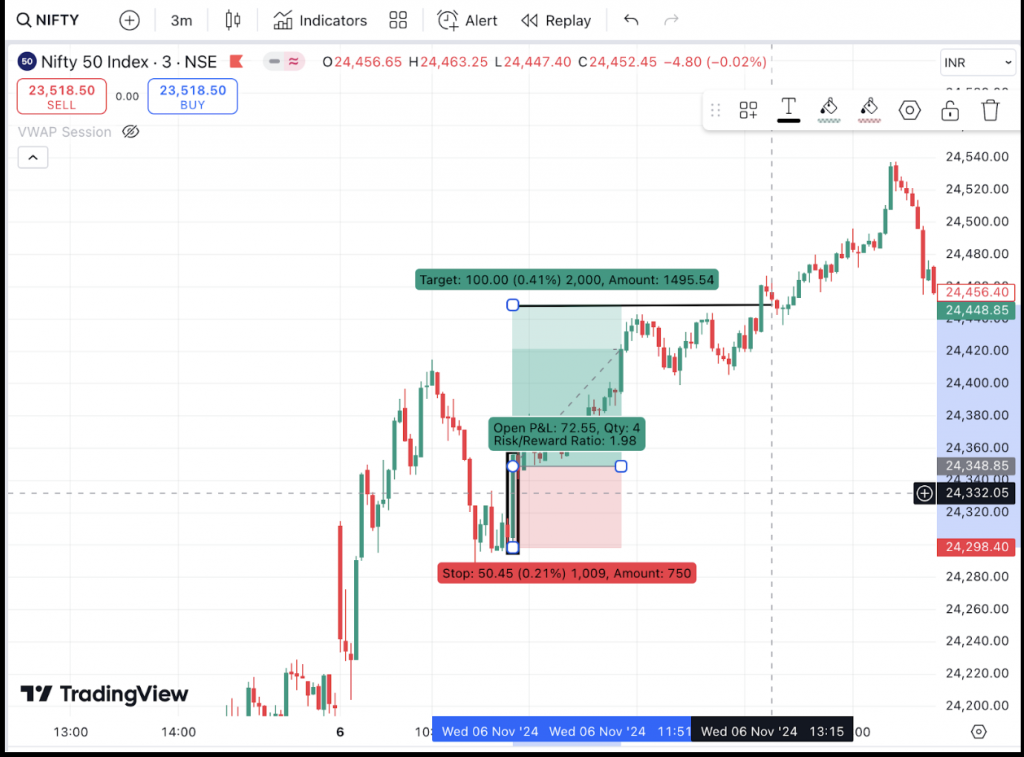
In the above example of Nifty, we can observe that by taking an entry at the exact closing of the index and setting the stop loss at twice the candlestick’s low, the target would have been achieved in approximately three hours.
This risk-to-reward ratio strategy works particularly well in markets with moderate momentum, where candlesticks form smaller, more predictable ranges. It is especially effective for range-bound trading, as it capitalizes on steady price movements, often driven by minor technical patterns or subtle market shifts.
EMA
When triggering an entry in the index, the exit plan can also be based on the Exponential Moving Average (EMA) indicator. The exit is executed when a candlestick closes below the 20 EMA. This approach ensures you stay aligned with the trend and exit only when the trend shows signs of weakening.
Since the 20 EMA moves with the price, it acts as a dynamic stop-loss that adjusts to the market’s volatility and price movements. This method is rule-based, relying on a specific condition (candlestick closing below the EMA), eliminating emotional decision-making. Additionally, it is easy to implement and can be backtested for historical reliability, making it a practical and effective strategy.
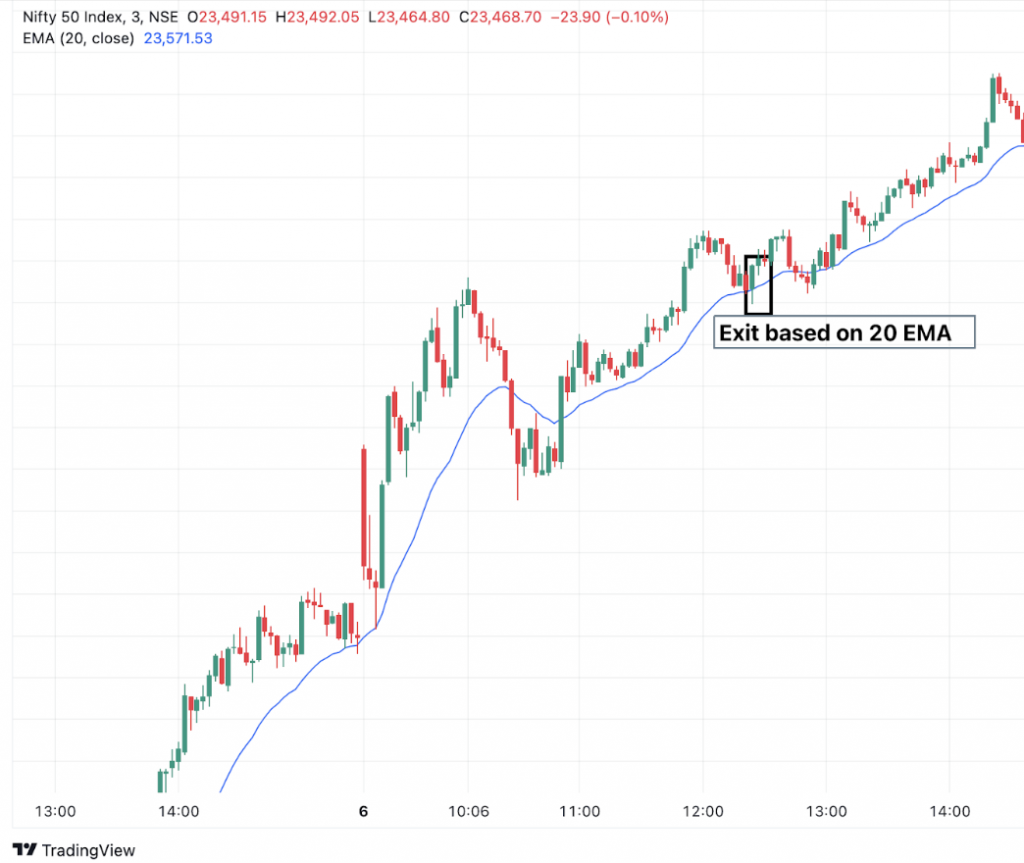
In the above example, the EMA-based exit approach still results in profit, but it leans more towards a risk-taker’s strategy. It is most effective in trending and volatile markets, as the 20 EMA acts as dynamic support or resistance, allowing exits at reasonable points without overreacting to minor pullbacks.
Stop loss
Regarding managing risk, our stop-loss strategy ties closely to the exit criteria we’ve discussed earlier. We use two simple yet effective approaches:
Risk-to-Reward Ratio Stop-Loss:
Here, we set our stop-loss at a distance equal to the candlestick’s low from the entry price. This keeps our risk-to-reward ratio at 2:1, meaning the potential profit is double the risk. It’s a straightforward plan that works well in markets with steady momentum, where price moves are more predictable, and targets can be hit quickly.
EMA-Based Stop-Loss:
We rely on the 20 EMA as a dynamic guide in this approach. If a candlestick closes below the EMA, it’s our signal to exit the trade. This lets us stay in the trend for as long as it’s strong while exiting when there’s a clear sign of weakness.
Combining these methods ensures every trade has a clear risk plan, helping us stay disciplined and confident in our strategy.
Examples
Let’s look at some examples for a better understanding. Below is the chart of Nifty. We apply our indicators to the chart. The primary conditions for the strategy are as follows: the Relative Strength Index (RSI) should be above 50 for bullish entry, the stock price should break above the VWAP, and the stock should close more than 20-EMA all these are on 3-minute time frame.
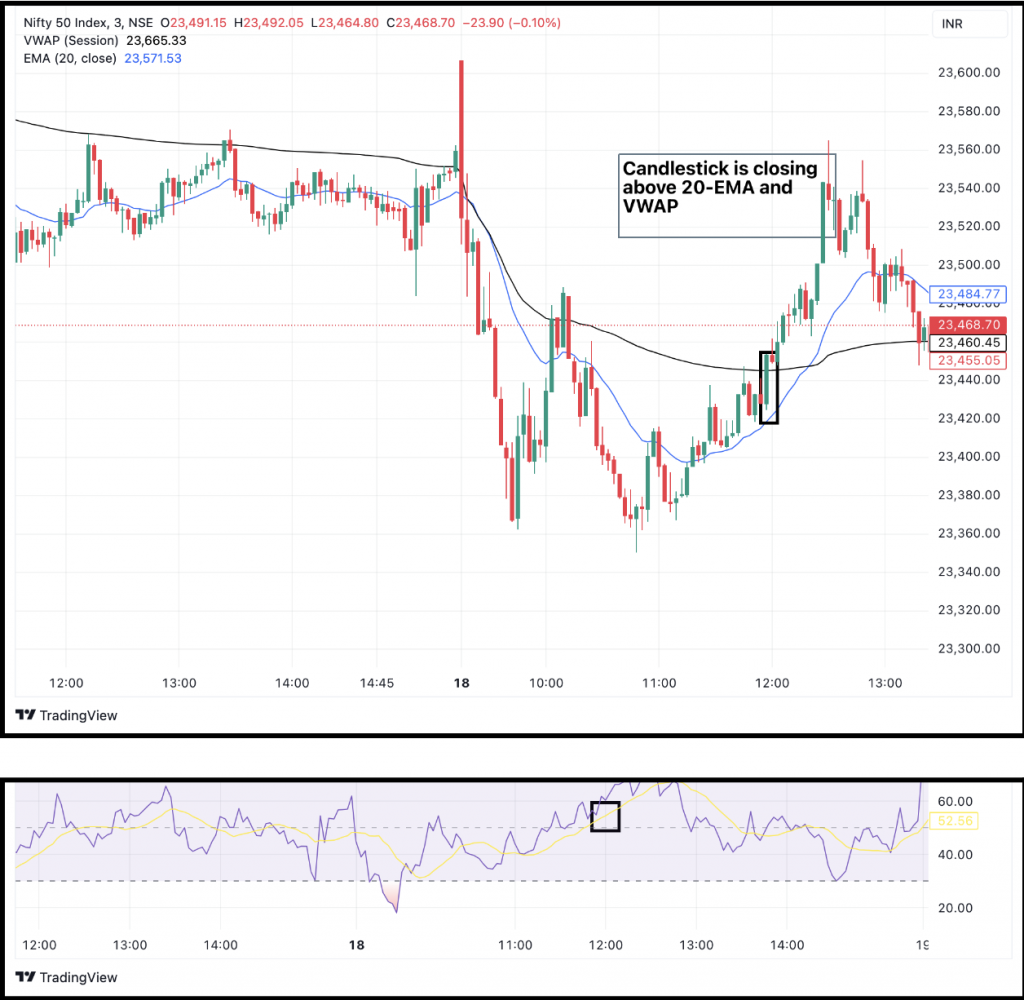
The chart above shows that the RSI value is around 55, not exactly 50. This shows that sometimes, we must be flexible when spotting trading opportunities. However, if we need clarification, skipping such trades is often better. It all comes down to our risk appetite if the entry feels right, we can go for it, and if not, it’s okay to leave it. After all, in trading, avoiding losses is also a form of profit.
If we look at the exit for the above Nifty-50 example, we can base it on the risk-to-reward ratio by setting the stop-loss at the low of the candlestick and the target at twice the distance from the entry (the high of the candlestick). The trade would look like this, as shown in the pictorial representation. In this case, we reached our target within just 30 minutes.
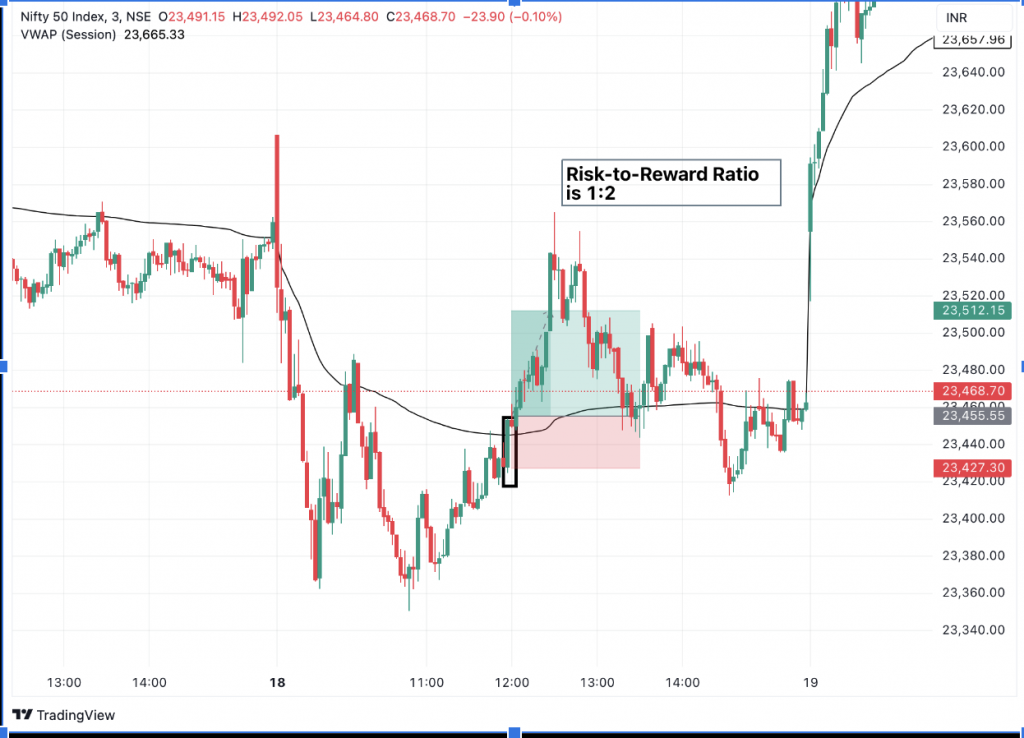
Another approach we can use is setting the 20-EMA as a stop-loss. This acts as a trailing stop-loss, and we would exit the trade as soon as the candlestick closes below the 20-EMA. However, this method might result in lower profits compared to an exit based on a risk-to-reward ratio. In scalping, focusing on a better risk-to-reward ratio is usually more effective, while trend-based indicators like the 20-EMA are better suited for long-term trading.
Things to remember
- Avoid trading on 3-minute candlesticks in Bank Nifty with more than 100 points movement and in Nifty with more than 50 points movement to reduce risk during high volatility.
- Exit 50% of your position when the risk-to-reward ratio is met, and let the remaining 50% ride using the 20-EMA to capture more momentum.
- Using shorter moving averages can give tighter control, but it often leads to more exits and choppiness, so use them cautiously.
Chapter 6: High Probability Scalping Strategy
Overview
Scalping is all about taking minimal risks, securing profits quickly, and exiting as soon as our targets are met. The core strategy revolves around keeping risk low and setting modest profit goals. Scalping works best with highly liquid instruments like Bank Nifty and Nifty, and that’s exactly what we’ll be trading here in a short 5-minute timeframe.
We’ll use three key indicators to make this a high-probability strategy: EMA, William Fractals Indicator, and VWAP. For added confidence, we’ll use EMA on two different timeframes. This combination helps in better decision-making and reduces uncertainty.
The plan is to buy at-the-money calls and put options in place to capture profits. These indicators will determine our stop loss, ensuring a disciplined approach to minimize losses. This way, we keep the strategy simple, effective and focused on quick, precise trades.
Indicators used in this strategy
In this high-probability strategy, we will see a new indicator, William Fractals, and other almost-known indicators in the stock market, such as the EMA and VWAP. Here, we will see a brief overview of each indicator to understand the crux of this strategy.
William Fractals indicator
This indicator is based on the price action that suggests potential reversal points in the market. These patterns are based on a series of candlesticks or bars, typically five in total.
A fractal is calculated based on the high/low of the preceding and succeeding candlesticks/bars, A arrow mark type is formed that is nothing but a fractal.
So first, we identify the market trend, whether it’s bullish or bearish. Then, we use the fractal indicator to refine our entries. Below are the conditions for bullish and bearish entry:
- Bullish entry with fractal: To enter a long position, wait for the price to break above the most recent up fractal during an uptrend.
- Bearish entry with fractal: Enter a short position when the price breaks below the most recent down fractal during a downtrend.
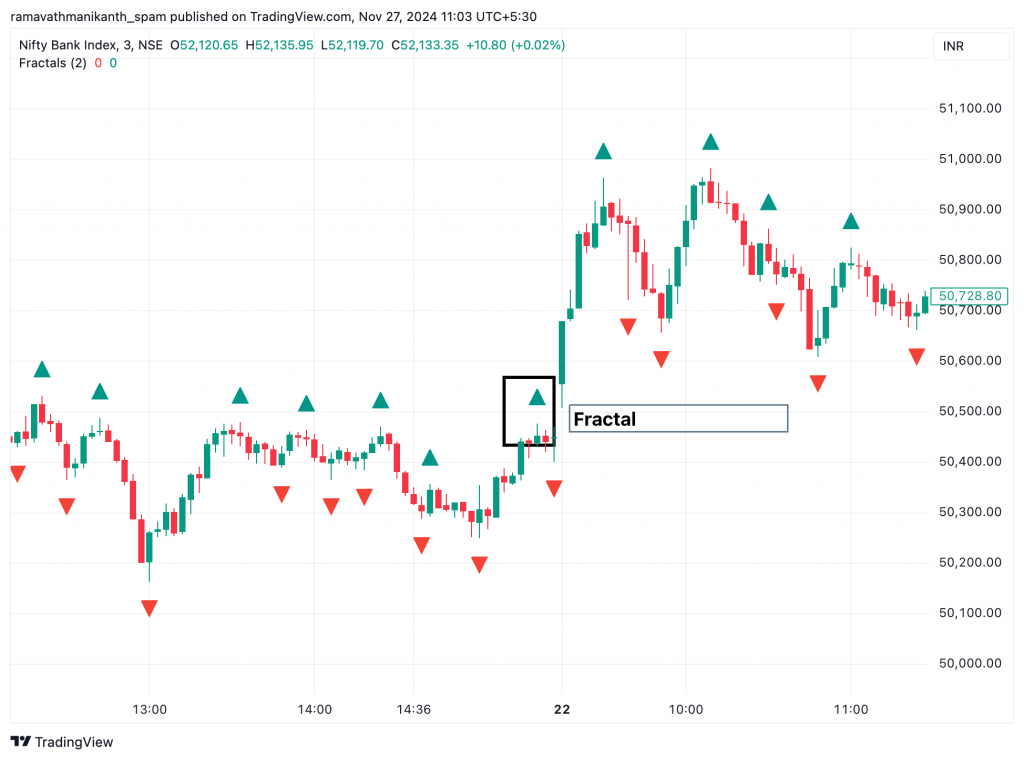
In the image above, the triangles represent fractals, which are used as the basis for identifying trade opportunities.
The other elements shown are popular indicators: the exponential moving average (EMA) and the volume-weighted average pierce(VWAP). We briefly review these indicators to provide additional context.
- Unlike the simple moving average, the EMA gives more weight to recent price changes, making it more responsive to current market conditions.
EMA_today=(Pricetoday×K)+(EMA_yesterday×(1−K)) K=smoothing constant
More in-depth explanation about EMA here
- VWAP (Volume Weighted Average Price) shows an asset’s average price for the day, weighted by volume, highlighting fair value levels and prioritizing high-volume prices.
VWAP = (Sum of (Price × Volume)) / (Sum of Volume)
Check out VWAP here.
Spotting an entry
For this high-probability scalping strategy, we identify trading opportunities in a 5-minute timeframe and focus exclusively on highly liquid indices like Nifty and Bank Nifty. The strategy determines the trend direction using emas on two different timeframes. To implement this on TradingView, we use the moving average ribbon indicator and customize the settings as needed. Below is a snapshot of the moving average indicator settings for reference.
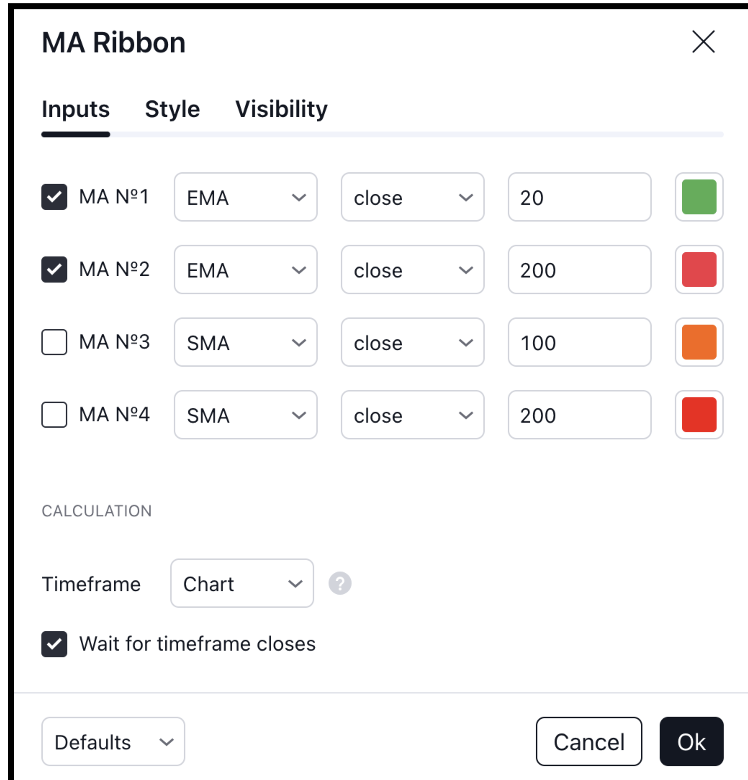
Long entry
Now, we will also set up the VWAP and Williams fractals on the chart. Since we are trading in indices, we trade the ATM (at-the-money) options to capture the momentum. Here are the conditions for a bullish entry with this strategy:
- The 20 EMA is above the 200 EMA
- The price is trading above the VWAP
- A bullish fractal (a green-up fractal) is broken by a candlestick closing above its high.
Here, we confirm the trend using emas. Generally, if the price is above 200 ema, it indicates bullishness. Additionally, if the price is also above the 20 ema, it suggests strong short-term bullishness. While it is not mandatory for the price to be above the 20 ema to go long, it adds confidence when taking a trade.
When the price is trading above the VWAP, it indicates that buyers are dominating and are willing to pay higher than the average price, signaling bullish momentum. In the stock market, institutional players often view VWAP as a fair value. If the price is above it, the market is generally considered bullish.
The breakout of the Williams fractal indicator suggests that the uptrend is resuming with strength, as market participants are confident enough to push the price past previous highs. This also confirms bullish momentum, making it a favorable entry point.
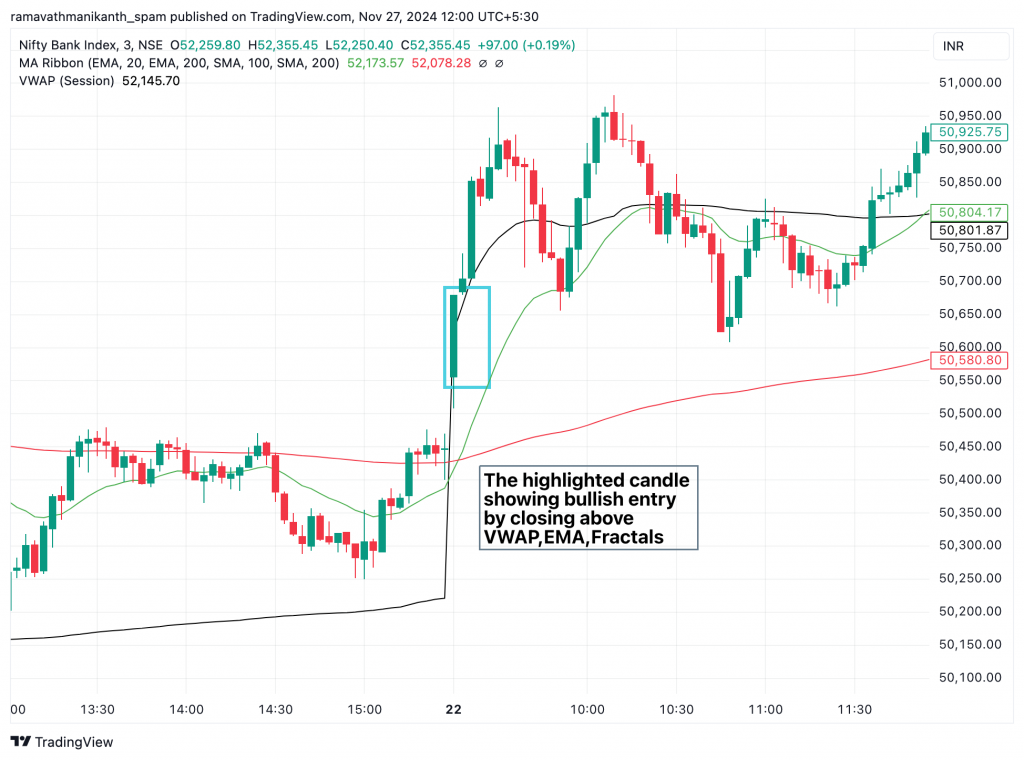
The image above provides a visual representation of a bullish signal. The highlighted candlestick breaks the previous fractals, indicating bullish momentum.
Short entry
For the bearish entry, that is almost the opposite of the bullish entry conditions. Here is the checklist for the bearish conditions:
- The 20 EMA is below the 200 EMA.
- The price is trading below the VWAP.
- A bearish fractal (a red-down fractal) is broken by a candlestick closing below its low.
Planning the exit
When we are scalping, precise and disciplined exits are critical to locking in profits and minimizing losses. In this strategy, our exit conditions are designed to match the high-probability nature of our entries. Here’s how we plan our exits:
First, we set a profit target using a risk-to-reward ratio, which depends on each trader’s risk appetite. For beginners, a minimum ratio of 1:2 is recommended. Since this scalping strategy focuses on capturing quick, small moves, it’s practical to target a fixed number of points when trading indices, typically 30-50 points based on market volatility.
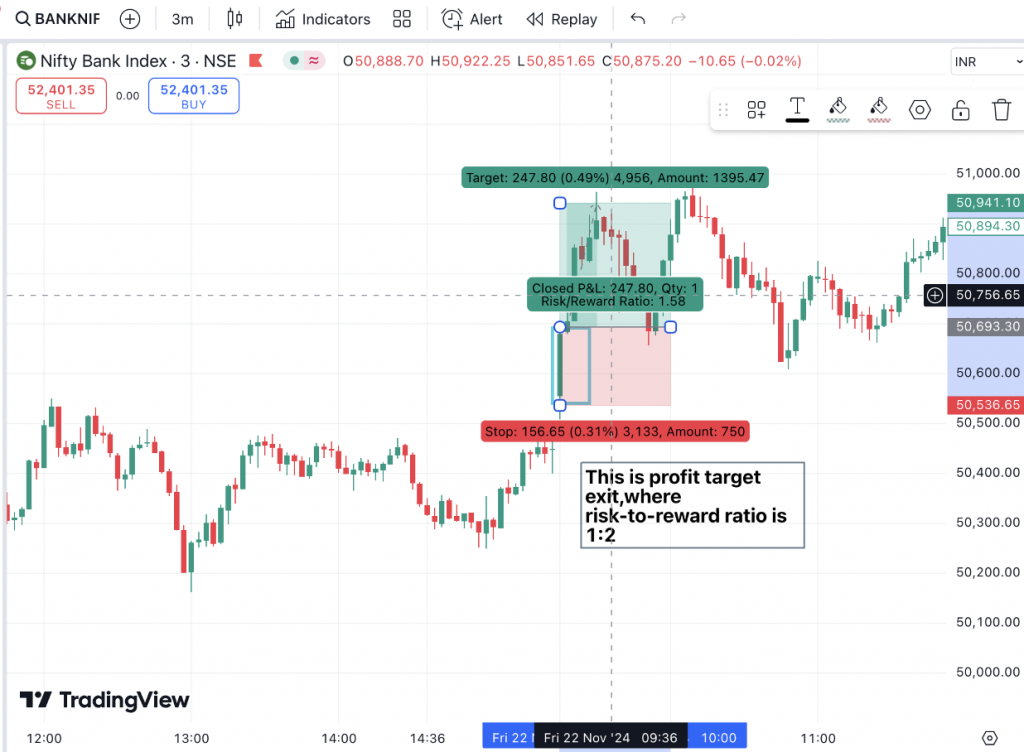
When we identify highly favourable trades, such as when the price is trading above the 20 EMA and VWAP, we can aim for a 1:5 risk-to-reward ratio. In such cases, it’s crucial to book profits promptly once the target is achieved.
The second type of exit is based on indicators like VWAP and EMA. If a long position is taken and the price trades above only one indicator (either EMA or VWAP), the other indicator can serve as the exit point.
This approach is particularly suitable for sideways or choppy markets, where price fluctuations are common. Exiting when the price falls below one of the indicators helps secure small profits or minimize losses before a potential market reversal.
Stop loss
With exits planned, we now focus on stop-loss placement. Let’s use our indicators to limit risk and keep the strategy effective smartly.
We can keep the stop loss based on the William Fractal indicator below the most recent fractal (for longs) or above it (for shorts) or using VWAP as a dynamic invalidation level; we ensure our risk remains aligned with the strategy’s precision.
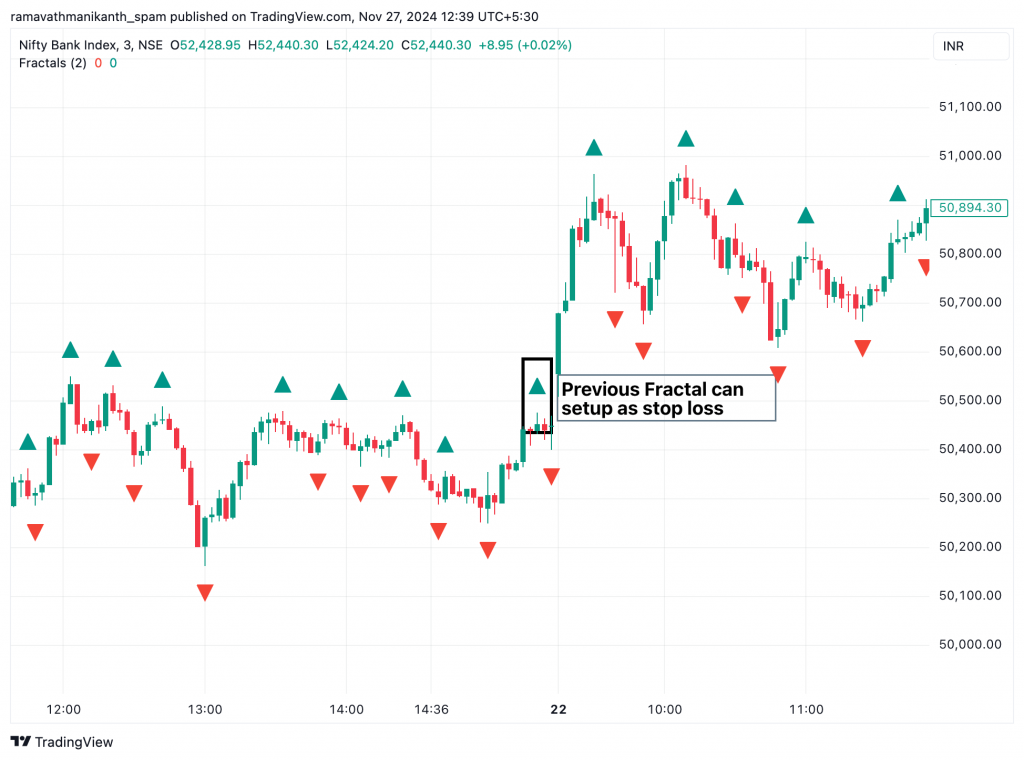
Another approach is to exit based on the risk-to-reward ratio, which depends on the trader’s risk appetite and the favorability of the trade. The ratio can be set to 1:2, 1:3, or even 1:5, depending on the market conditions and the confidence in the trade setup.
Example
Let’s explore specific examples in Nifty to see how these indicators align to create high-probability setups. In the chart below, the price is already trading above both the 20 EMA and 200 EMA, confirming a bullish trend and setting the stage for a potential trade entry.
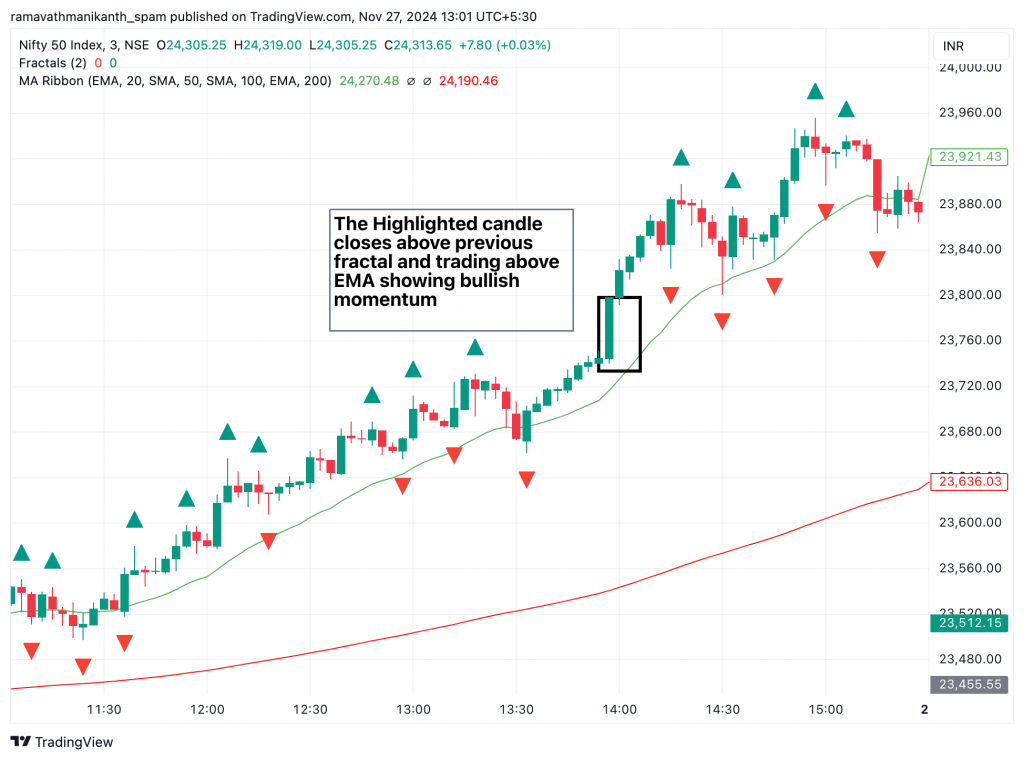
The formation of a bullish marubozu breaking the previous fractal indicates bullish solid momentum. Additionally, the candlestick trading above the VWAP reinforces the bullish sentiment. The entry signal is confirmed when the candlestick closes above the previous Williams fractal, signalling a favourable trade setup.
We would enter the trade immediately after the candlestick closes and confirms the signal, buying an ATM or nearby ATM option to capitalize on the potential profit.
The stop loss for this trade setup can be placed at the previous Williams fractal or determined based on a profit target using a risk-to-reward ratio of 1:2 or 1:5, depending on the trade’s favorability. Below is a visual representation of the stop loss placement.
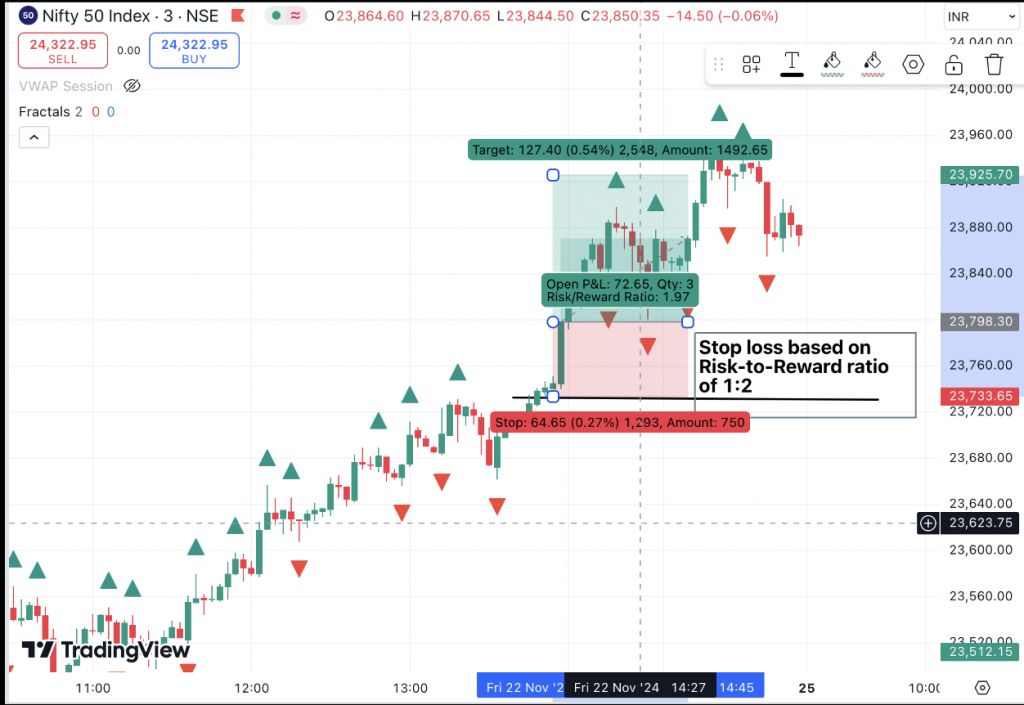
Things To Remember
- When setting a target, ensure a 40-50 point gap between entry and target to account for meaningful profit potential.
- Take a trade only if EMA alignment, VWAP position, and fractal breakout all lineup. This ensures you’re trading with a clear trend and strong momentum.
- If the 20 EMA and 200 EMA are flat or crossing each other, skip the trade.
- When the price breaks a fractal, check if it happens with high volume. Weak volume breakouts are unreliable and often fail.
- If the price returns to VWAP after you enter a trade and doesn’t bounce (for a long) or reject (for a short), consider exiting early to avoid losses.