Chapter 7: Support, Resistance, and Dow Theory
Demand and supply are the most essential things in the stock market that drive prices. The fundamentals are that stock prices increase as demand increases and decrease as stock supply increases. How do you identify these levels for any particular stock price?
Concepts of support and resistance are useful here. This chapter will teach us about support and resistance, which will also help set targets and control losses.
We’ll also explore the Dow theory, an old but valuable method of technical analysis used before candlestick charts became popular. Even today, many traders combine ideas from both Dow theory and candlesticks to boost their trading success.
The support zone
As the name suggests, a support zone is a level at which the price stops falling further. Market participants believe that the support zone is the price level at which demand is strong enough to prevent the price from declining further.
The logic behind using a support zone is that as the price declines towards this level and becomes cheaper, participants believe that the stock does not command a lower price. Buyers are more likely to buy, while sellers are less likely to sell. By the time the price reaches the support level, demand is believed to be strong enough to overcome supply, preventing the price from falling further.
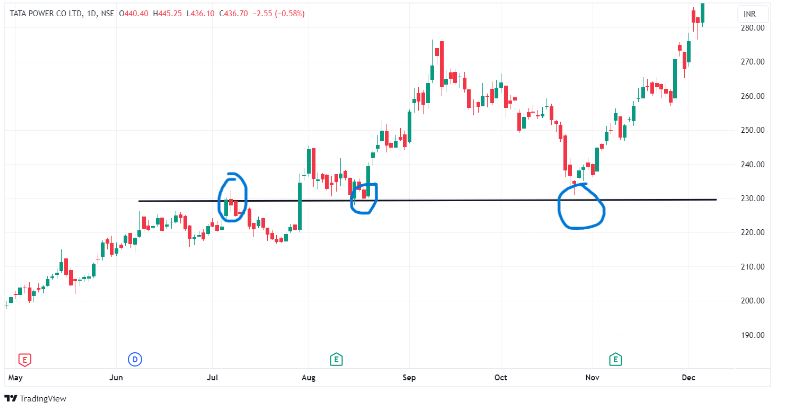
Here is an image of a horizontal line acting as a support level for Tata Power, from where the price has bounced back multiple times.
Types Of Support Levels
There are different types of support levels in technical analysis, but the most important are the horizontal support and the trendline support.
A horizontal support is formed by drawing a straight line horizontally that connects several low points on the chart, which hover along the same price. The more times the price touches and rebounds from this level without breaking it, the stronger the support is considered.
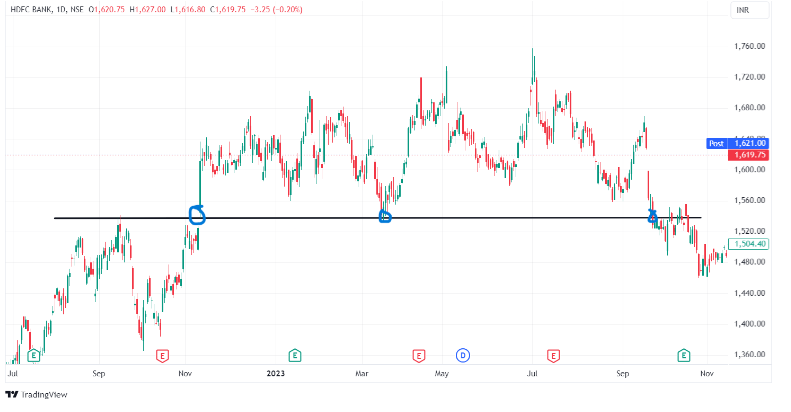
Here is an example of horizontal support in the HDFC Bank price chart:
A trendline support is a level where the price stops falling and bounces back up along a diagonal line. It is marked by drawing a straight line that connects several higher lows or lower lows on the chart. This line helps identify the general trend and provides support as long as the price stays above it.
The resistance zone
The resistance zone works conversely to the support zone. It is a level that stops the price from rising further. Market participants believe that the resistance zone is the price level where the supply is strong enough to prevent the price from rising further.
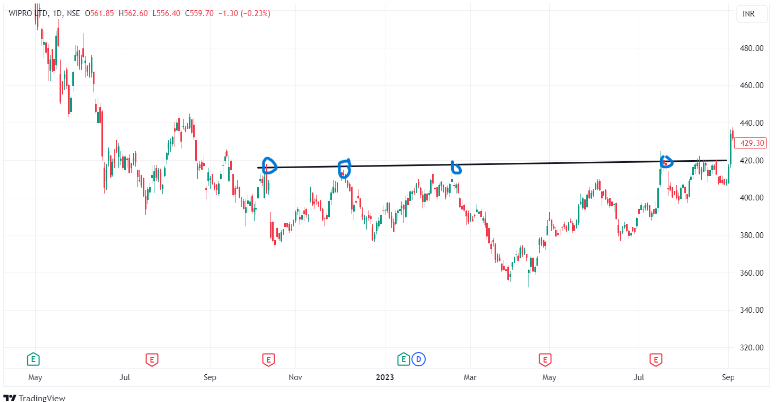
The logic of a resistance zone is that as the price rises and gets more expensive, more sellers are willing to sell, and fewer buyers want to buy. Here is the daily chart of Wipro Ltd. for better understanding:
Types Of Resistance Levels
Just like the support levels, there exist two variants: horizontal resistance and trendline resistance.
Horizontal resistance is a level at which the price tends to stop rising and drop back down. It is marked by drawing a straight line horizontally connecting several high points on the chart. The more times the price touches and falls from this level without breaking it, the stronger the resistance is considered.
The above chart of Wipro is an example of horizontal resistance.
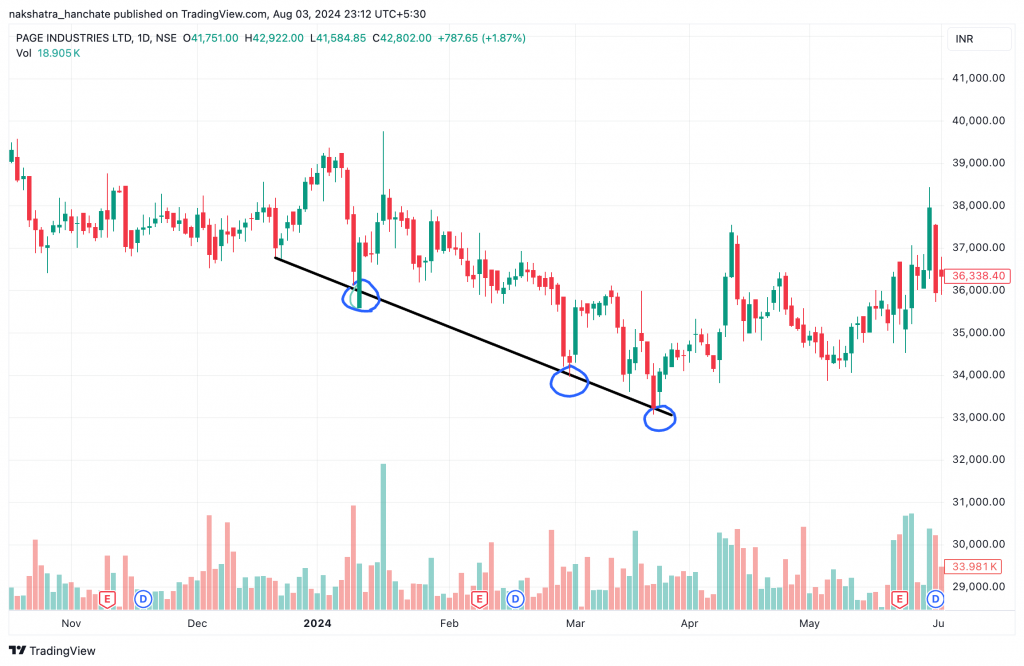
A trendline resistance is where the price tends to stop rising and pull back down along a diagonal line. It is marked by drawing a straight line connecting several declining high points (or lower highs) on the chart. This line helps identify the general downward trend and acts as resistance as long as the price stays below it. Here’s an example:
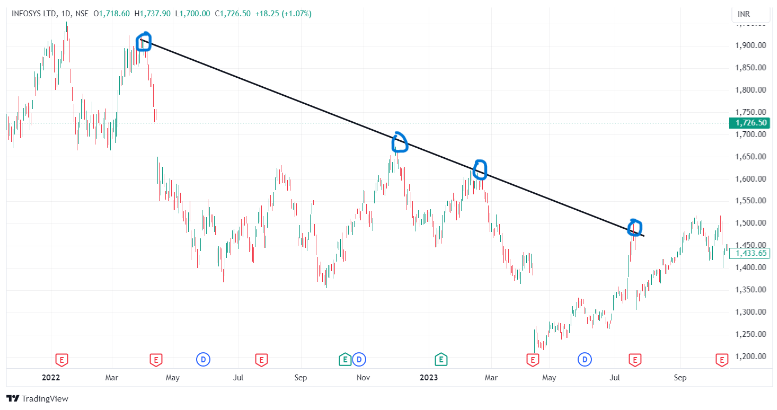
This indicates intense selling pressure, with sellers consistently preventing the price from rising above the resistance level.
Now that you understand support and resistance levels, let’s learn to draw them.
How do you draw support and resistance levels in a chart?
Step 1: Selecting your timeframe
Selecting a timeframe depends on your trading style. For example, day traders often use 15-minute charts, swing traders use hourly, daily, or weekly charts, and positional traders use monthly charts. Choosing a suitable timeframe is crucial for aligning your analysis with your trading strategy.
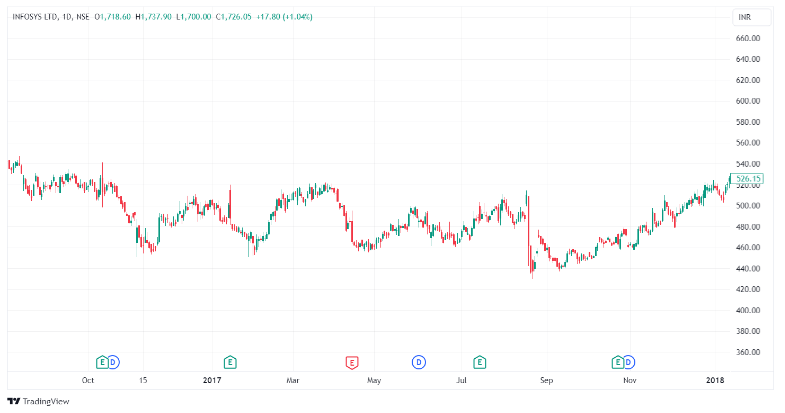
Zoom out the chart after selecting a particular time frame until a trend can be deciphered, something like this:
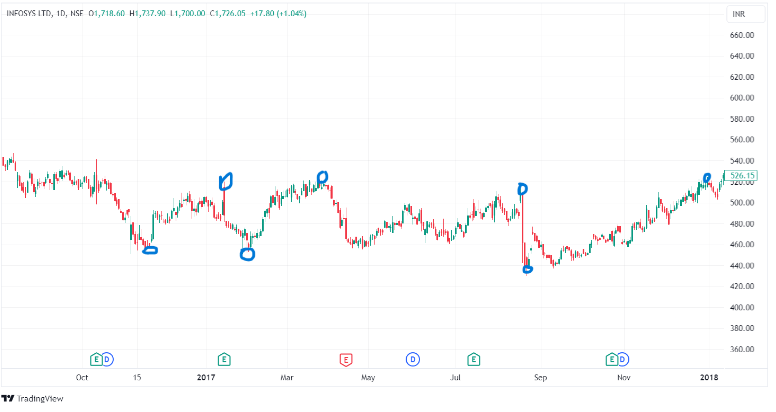
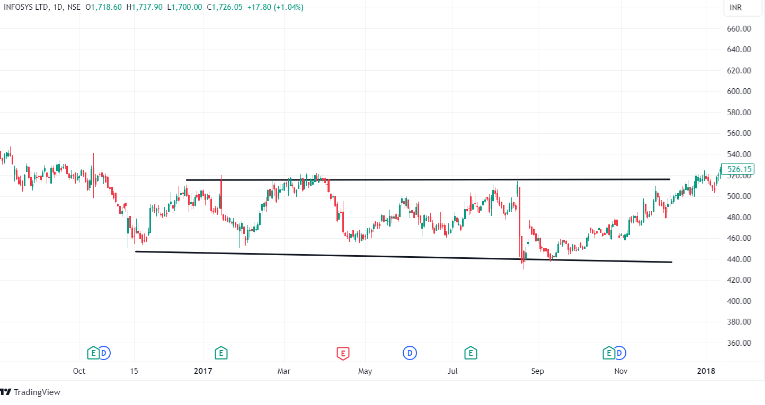
Step 2: Connecting the highs and lows
After loading the price charts according to your timeframe, as mentioned in Step 1, mark the high and low price points. Once you can spot them, draw a trendline connecting the highs and another connecting the lows.
How To Use Support and Resistance Levels
Support and resistance are areas with potential for reversals. We can mainly use them to set entry and exit points in our trading strategy. Let’s demonstrate with a simple example.
First, we aim to mark the highs and lows in the daily chart of Asian Paints Ltd.

Now, we draw a trendline connecting those highs and lows, respectively.
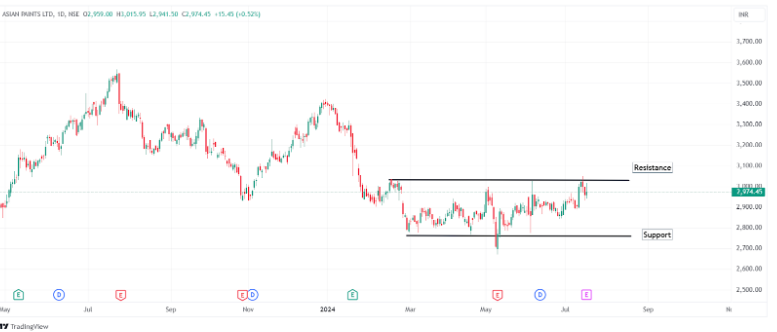
The chart shows that the current price of Asian Paints is testing its resistance level. If the resistance breaks with a candlestick confirmation, such as a bullish engulfing pattern, we can confirm the uptrend and build a long position. However, if the price gets rejected by the resistance, our potential entry point for a long position would be at the support level.
The Dow theory
The Dow theory is a fundamental principle in trading that helps identify the overall market trend. Even today, traders use the Dow theory along with candlestick patterns to make better trading decisions.
Charles H. Dow created the Dow theory in the late 19th century. Dow, who co-founded Dow Jones & Company and the Wall Street Journal, developed this theory from his writings between 1884 and 1902. Dow theory helps traders understand market trends by analyzing price movements, and it is a vital part of modern technical analysis.
Principles of Dow Theory
The Dow theory is built on a few core beliefs called tenets. Over the years, through market observation, nine tenets have been identified. Here are the nine tenets, backed by examples:
1. The market discounts everything.
The stock market reflects all available information in stock prices, including earnings reports, economic conditions, and political developments. Market movements are the cumulative result of all known factors. For example, when Reliance Industries announces its earnings, the stock price quickly reflects this news. Good earnings make the price rise; bad earnings make it go down. Essentially, Reliance’s stock price includes all available information.
2. Three trends form the market
Dow identified three types of trends: primary, secondary, and minor.
3. The primary trend
These are significant market movements that last several months to years. They are characterized by a sustained movement in one direction, either upward or downward. The trend reflects the overall market sentiment, indicating either an upward (bull market) or downward (bear market) direction.
4. The secondary trend
These are short-term fluctuations within the primary trends, lasting from several weeks to several months. They move opposite the primary trend and represent a counter-trend movement, like a pullback or correction. While long-term investors focus on primary trends, swing and day traders pay attention to all trends.
5. The minor trend
These are daily market fluctuations, often called market noise. Minor trends last from a few days to a few weeks and move in the same direction as the primary trend. Short-term changes in supply and demand cause them.
6. Indices must confirm
Other significant indices should also confirm a trend to be valid. For example, in the Indian market, the Nifty 50 and the Nifty Bank index must show the same trend direction. If one index is rising while the other is falling, it may signal a trend reversal or weakening.
7. Volume confirms trends
The volume should also support the ongoing primary trend. In a bull market, volume should rise as prices increase and fall during corrections. In a bear market, volume should increase during declines and decrease during rallies. Low volume during a trend may indicate that the trend is weak and may not be sustained. You can learn about volume here.
Volume
In the stock market, volume refers to the number of shares bought and sold during a specific period, usually within a day.
8. Sideways markets can substitute secondary markets
Markets can sometimes move sideways, trading within a specific range for an extended period. For example, Tata Motors traded between ₹300 and ₹350 for several months. These sideways markets, where prices fluctuate within a range without significant upward or downward movement, can often substitute for a secondary trend.
9. Closing price and signal confirmation
In Dow theory, signals are based on closing prices rather than intraday movements. For example, if the Bank Nifty index shows a strong upward movement during the day but closes lower, it doesn’t confirm an uptrend. We wait for the closing price to avoid false signals from intraday volatility. If Bank Nifty consistently closes higher over several days, it confirms an uptrend. Similarly, for a downtrend, we look for consistent lower closing prices.
Bank Nifty
Bank Nifty is a stock market index in India that represents the performance of the banking sector.
The Three Phases of Major Trends
According to the Dow theory, markets go through three repeating phases: the accumulation phase, the markup phase, and the distribution phase. Let’s discuss each one:
The accumulation phase is the first phase of a primary trend. During this phase, informed investors, known as “smart money,” start buying stocks. These investors have a deeper understanding of the market. Smart money generally refers to institutional investors who think in long-term perspectives. After a steep sell-off, they buy many shares over an extended period. This defines the accumulation phase. During this time, sellers can easily find buyers, preventing prices from falling further. Therefore, the accumulation phase usually marks the bottom of the market and creates significant support levels for any stock.
Once these institutional investors have bought a significant amount of stocks, short-term traders start to support the market. This begins the markup phase, also known as the public participation phase. This phase is marked by increased investor activity, significant price movements, and rising trading volumes. The markup phase is relatively quick and coincides with improved business sentiment. As people see the impressive returns, everyone wants to join in and participate in the rally.
When stocks finally hit all-time highs, everyone becomes very optimistic about the stock market. News reports turn positive, the business environment seems vibrant, and the public is eager to invest. A large number of people want to put their money into the market. This is when the distribution phase occurs.
At this time, smart money, or institutional investors, will start selling off their investments. Since prices have already peaked, no further appreciation has been seen. This selloff leaves the public frustrated as prices begin to fall. Institutional players then wait for a market reversal to start the cycle again.
When the circle is completed, the selloff phase follows a fresh round of the accumulation phase, and the whole cycle repeats. The entire cycle from the accumulation phase to the selloff is believed to span over a few years.
Now that we’ve grasped the principles of Dow theory, let’s examine how we can effectively trade using them.
Dow theory trading strategy
This trading strategy is rooted in the principles of Dow theory, emphasizing the importance of analyzing stock trends to make informed investment decisions. Here are the critical steps involved in using Dow theory in your trading approach:
Step 1: Identify the primary trend
The first step of this strategy is to identify the primary trend from a long-term perspective. This is done by analyzing the market’s price movements over several months to years. If the stock is forming continuous higher highs and higher lows, it is said to be in an uptrend. Conversely, it is in a downtrend if it consistently forms lower lows and lower highs.
Step 2: Confirm the trend
After identifying the primary trend, the next step is to confirm it, as confirmation is crucial before entering a trade. To verify the trend, examine the trading volumes. It is a good sign if the trading volume increases as the market moves toward the trend.
We have yet to discuss volume but think of volume as the number of shares being traded.
Step 3: Identify secondary trends
As we discussed, secondary trends within the primary trend can provide opportunities for traders to enter or exit the market. These are short-term movements lasting several weeks to a few months. Swing traders make the best use of these secondary trends.
Step 4: Look for trend reversals
One fundamental principle of the Dow theory is that trends will continue until there are clear signs of a reversal. Traders using this strategy look for indications of the trend weakening or changing direction, such as a shift in trading volume or a break in crucial support or resistance levels.
Step 5: Use technical analysis
Technical analysis plays a vital role in the Dow theory trading strategy. Traders use charts to identify critical support and resistance levels, trend lines, and other patterns to decide a trade’s entry and exit points.
We will now finally look at the pros and cons of Dow theory.
Pros and cons of the Dow theory
Some advantages of Charles Dow’s theory are as follows:
- Long-term perspective: Dow theory is based on long-term market trends, providing investors and traders with a big-picture view of market movements. It helps investors avoid knee-jerk reactions to short-term market fluctuations and focus on long-term growth potential.
- Easy to understand: Dow theory is based on simple principles and provides clear guidelines for identifying market trends. It can be a valuable tool for investors who want to better understand market behavior.
- Follows market trends: The Dow process is based on the idea that the market is always right. And it helps investors follow the current trend. By identifying the trend, investors can make better decisions about when to buy and sell securities.
Some disadvantages of Dow’s theory are as follows:
- Not consistently accurate: While the Dow theory helps analyze market trends, it is only sometimes correct when predicting future movements. Various external factors, such as political and economic events, can influence market behavior and make it difficult to rely solely on the Dow theory.
- Ignores other important factors: The Dow theory focuses mainly on market trends and does not consider other important factors, such as company fundamentals, macroeconomic indicators, and industry trends.
Summary
- Understanding demand and supply is essential for identifying stock price movements through support and resistance levels.
- Support is a price level where demand prevents further declines in stop prices. It is useful in deciding entry prices and stop loss levels for long positions.
- Resistance is a price level at which supply prevents a stock price from rising further. It is useful in deciding target prices and stop-loss levels for short positions.
- Select your timeframe to draw support and resistance levels, mark highs and lows, and connect them with trendlines.
- Use support and resistance levels to set entry and exit points in your trading strategy.
- Dow theory helps identify market trends through principles like primary, secondary, and minor trends.
- Primary trends are long-term market movements lasting months to years, indicating overall market sentiment.
- Secondary trends are short-term movements within primary trends, lasting weeks to months and offering trading opportunities.
- Minor trends are daily market fluctuations caused by short-term supply and demand changes, often seen as market noise.
- The Dow theory includes market phases: the accumulation phase (informed investors buy after a decline), the markup phase (increased investor activity and rising prices), and the distribution phase (institutional investors sell at market highs), followed by a potential market reversal.