Chapter 10: Indicators – Part 2
In the previous chapter, we explored the moving average, a well-known indicator for identifying trends and reversals in stocks. We’ll delve into other essential indicators like the RSI, MACD, Bollinger Bands, and Supertrend. Traders widely use these tools, which are crucial for gaining a deeper understanding of market dynamics.
For a quick recap, leading indicators give signals before the trend changes or continues, helping to predict future movements. In contrast, lagging indicators follow the price movement and are usually used to confirm trends rather than predict them.
RSI - Relative Strength Index
The relative strength index (RSI) is a leading momentum indicator developed by J. Welles Wilder. Its primary use is to identify overbought and oversold signals, meaning it helps spot potential trend reversals. The RSI oscillates between 0 and 100, and based on the latest indicator reading, the expectations for the markets are set.
The relative strength index (RSI) is a highly effective tool, especially when stocks are trading within sideways or non-trending ranges. This is because markets often move sideways, making it crucial to identify potential turning points.
The formula for calculating the RSI:
RSI = 100 – [100 / (1+RS)]
Where RS = Average Gain / Average Loss
Let’s calculate the RSI of the following dataset.
Sr. No. | Closing Price | Points Gained | Points Lost |
1 | 120 | 0 | 0 |
2 | 123 | 3 | 0 |
3 | 119 | 0 | 4 |
4 | 122 | 3 | 0 |
5 | 121 | 0 | 1 |
6 | 124 | 3 | 0 |
7 | 122 | 0 | 2 |
8 | 125 | 3 | 0 |
9 | 128 | 3 | 0 |
10 | 127 | 0 | 1 |
11 | 126 | 0 | 1 |
12 | 130 | 4 | 0 |
13 | 132 | 2 | 0 |
14 | 135 | 3 | 0 |
In the above table, points gained/lost denote the number of points gained/lost concerning the previous day’s close. For example, if today’s close is 104 and yesterday’s close was 100, points earned would be 4, and points lost would be 0. Similarly, if today’s close was 104 and the previous day’s close was 107, the points gained would be 0, and the points lost would be 3. Please note that the losses are computed as positive values (in absolute terms).
We used 14 data points for the calculation, which is the default period setting for the RSI indicator in most trading softwares. This is also called the ‘look-back period.’ If you are analyzing hourly charts, the default period is 14 hours; if you are analyzing daily charts, the default period is 14 days.
The first step is to calculate ‘RS,’. As you can see in the formula, RS is the ratio of average points gained by the average points lost.
Average points gained = 24 / 14
Average points loss = 10 / 14
Relative strength (RS) = 1.714 / 0.643 = 2.667
Plugging in the value of RS into the RSI formula:
RSI = 100 – 100 / (1+2.667)
RSI = 100 – 100 / 3.67
RSI = 100 – 27.7273
RSI = 72.73
The overbought region occurs when the RSI shows significant buying pressure compared to recent trends, often signaled by the RSI rising above 70. This typically indicates that the upward momentum may soon slow down. Conversely, the oversold region, marked by the RSI falling below 30, indicates intense selling pressure, suggesting that the downward trend might end.
How to trade relative strength index?
Trading with the relative strength index (RSI) is straightforward. The RSI ranges from 0 to 100, and technical analysts typically use the 30 and 70 levels as thresholds for generating buy and sell signals.
- Buy signal: Look for long opportunities when the RSI is in the oversold range (below 30) or moving out of it.
- Sell signal: Look for short opportunities when the RSI is in the overbought range (above 70) or moving out of it.
On a trading terminal, the RSI indicator will look like this:
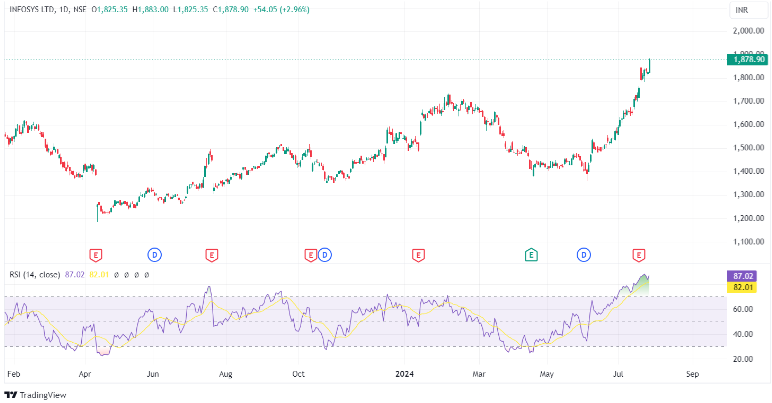
The RSI is just an indication of a stock being overbought or oversold. It is not a guarantee for price reversal. Different types of traders use RSI differently. We suggest you apply other technical analysis concepts like candlesticks, moving averages, the Dow theory, etc. to identify and take a trade, with RSI being one of the parameters for doing so.
MACD - Moving Average Convergence Divergence
The MACD is a lagging indicator, a momentum oscillator primarily used to trade trends, unlike the RSI, which identifies overbought and oversold zones. The MACD helps investors spot price trends, gauge trend momentum, and find market entry points for buying or selling.
It is constructed using two different exponential moving averages, one of which is a moving average of the other. This combination helps highlight changes in trend direction and momentum.
Here is an example of MACD on the daily chart of Infosys Ltd.:
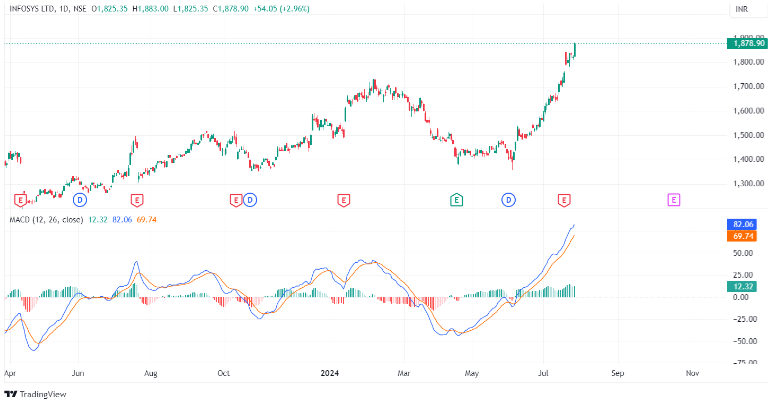
As you can see, the graph displays two moving averages. Here, one is the MACD line, calculated by subtracting the 26-period EMA from the 12-period EMA. The other line, called the signal line, is the 9-day EMA of the MACD line. In the above chart, the blue line represents the MACD line and the red line represents the signal line.
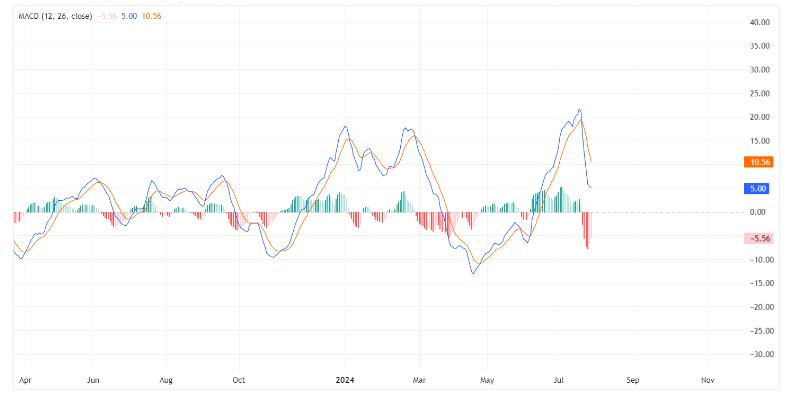
Below these lines, a histogram represents the difference between the MACD line and the signal line. The histogram is positive when the MACD line is above the signal line, indicating bullish momentum, and negative when it’s below, indicating bearish momentum. The positive histogram, above the zero line and green in color, indicates bullish momentum. Conversely, when the histogram is below the zero line and red, it signals bearish momentum. Here is another MACD example showing periods of bullish and bearish momentum:
How to trade the MACD?
Trading with the moving average convergence divergence (MACD) indicator is also straightforward.
- Buy signal: Go long when the MACD line crosses above the signal line. This indicates that bullish momentum is gaining strength.
- Sell signal: Go short when the MACD line crosses below the signal line. This suggests that bearish momentum is increasing.
Supertrend
The Supertrend is a technical analysis indicator that helps traders identify market trends. This indicator combines the average true range (ATR) with a multiplier to calculate its value. Here’s how:
- ATR, or the Average True Range, measures an asset’s average price movement over time, indicating its volatility. It helps the Supertrend enhance its sensitivity and accuracy in detecting trends. The formula for its calculation is ATR = [(Prior ATR x 13) + Current TR] / 14
- The multiplier is a constant value that traders and investors employ to make the indicator more or less sensitive to price movements.
The formula for calculating the Supertrend:
Supertrend = [(High + Low) / 2 + (Multiplier) ∗ (ATR)
The ATR length affects its sensitivity and signal frequency. Short periods increase sensitivity and signals; longer periods provide fewer but more reliable signals. In most trading platforms, the default ATR period is set to 10, and the multiplier is set to 3.
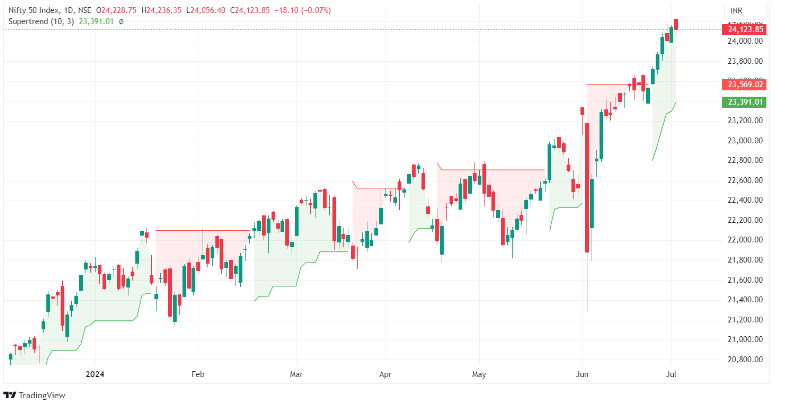
Here’s how the indicator appears when applied to a chart:
How to use the Supertrend indicator?
The line and shadows with changing green and red colors represent the Supertend indicator. It is interpreted as follows:
- When the Supertrend goes below the closing price, it turns, indicating a bullish trend.
- When the Supertrend goes above the closing price, it turns red, indicating a bearish trend.
Use the Supertrend indicator during solid uptrends or downtrends to effectively identify market trends. However, the Supertrend indicator is unsuitable for sideways markets because the price trades in a narrow range and can generate false signals or “whipsaws” in sideways or choppy markets, leading to potential losses.
It makes a superb choice for swing trading because it offers reliable entry and exit signals over a medium-term timeframe of several days or weeks. The indicator helps identify the prevailing market trend, making it easier to decide when to enter or exit a trade, maximizing potential gains from sustained price movements.
Long trade
- When the Supertrend indicator turns green, buy the stock at its closing price of that particular day.
- Keep the line of the Supertrend as the stop loss. As the price moves, the Supertrend line adjusts accordingly.
- If the Supertrend line turns from green to red, it may be considered a signal to exit the extended position.
Short trade
- When the Supertrend indicator turns red, sell the stock at the opening price of that particular day.
- Set the stop loss at the Supertrend line, and as the price moves, the Supertrend line will adjust accordingly.
- If the Supertrend line turns from red to green, it may be considered a signal to exit the extended position.
Bollinger Bands
Firstly, let’s talk about why volatility matters when we’re trading stocks. Imagine we’re fishermen living by the seaside.
We head out to sea with other fishermen every day to catch fish. But here’s the thing: we might face problems if we don’t pay attention to the weather, like high waves or fog. It’s like driving in heavy rain without knowing what’s coming – risky!
Think of fishing as trading stocks. Just like we need to know the ocean conditions for fishing, we need to understand market volatility for trading. Volatility means how much prices are going up and down. If we ignore this, we might lose money, like fishing on a stormy day.
Knowing about volatility can help us decide when to buy or sell stocks.
The Bollinger Bands are a great way to understand the volatility of a stock or index, it is made of three components:
- The middle line, which is the 20-day simple moving average of the closing prices.
- An upper band – this is the +2 standard deviation of the middle line.
- A lower band – this is the -2 standard deviation of the middle line.
Standard deviation is a statistical concept that measures how much a particular variable deviates from its average. In finance, the standard deviation of a stock’s price represents its volatility. For example, if a stock has a standard deviation of 12%, it means the stock’s price typically fluctuates by 12% from its average price.
Here is a pictorial representation of the Bollinger Bands indicator on the daily price chart of Wipro:
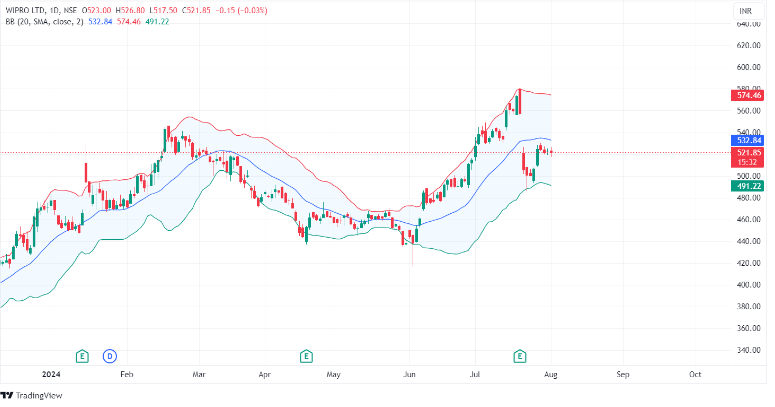
In the above chart, the three values of Bollinger bands as of August 1, 2024 are:
Current Market Price: 521.85
Upper Bollinger Band: 574.46
Middle Bollinger Band: 532.84
Lower Bollinger Band: 491.22
How to trade using Bollinger Bands?
- Long trade: Consider going long when the price touches or moves below the lower Bollinger Band. This may indicate that the asset is oversold, and a potential upward reversal could be expected.
- Short trade: Consider going short when the price touches or moves above the upper Bollinger Band. This may suggest that the asset is overbought, and a potential downward reversal could occur.
Summary
- Indicators like the RSI, MACD, Bollinger Bands, and Supertrend help traders understand market trends, momentum, and entry/exit points.
- RSI (Relative Strength Index) is a momentum indicator that identifies overbought and oversold conditions, helping spot potential reversals.
- MACD (Moving Average Convergence Divergence) identifies trends and momentum by comparing two moving averages.
- Supertrend helps identify the market trend based on the average true range (ATR) and a multiplier.
- Bollinger Bands consist of a middle SMA and two standard deviation lines, helping differentiate between volatile and non-volatile market periods.
- Indicators like these can generate buy and sell signals, identify trends, and provide insights into market volatility, aiding traders in making informed decisions.
- The effectiveness of these indicators can vary depending on market conditions; they are often more reliable in trending markets and may produce false or less accurate signals in sideways markets.