Chapter 4: How to Read a Profit and Loss Statement
In this chapter, we will examine hardcore fundamentals, reading the financial statement, determining where the figures came from, and making sense of each figure. When data speaks, a fundamental investor listens.
Now that we understand the general setting of our biopic, it’s time to get acquainted with each of the main characters and their individual stories.
First, the profit & loss statement.
Introducing the P&L statement
Some call it Statement of Income, some Statement of Earnings, and some Statement of Operations. They all end with a profit or a loss. This statement is the starting point of any company’s financials and can tell you a lot about its nature of operations, including how efficient or stressed the company is.
You can also make your P&L statement. It is similar to writing your household/daily expenses. It includes how you earn money and where you spend it. You prepare these records referring to the bank statements, credit card statements, receipts, bills, and invoices. Similarly, a company has a team of accountants and high-end software technology recording these transactions and accounting them in relevant categories.
Every business has one objective – to make profits. The P&L statement tells you how close or far the company is from achieving this objective.
To arrive at the profit, you need two things:
- Revenue, which tells you which product/service is selling and which is not, and which product is the real cash cow.
- Expenses tell you where you are spending more and how an increase in cost in a particular area could impact your business.
The process of deducting various expenses from the total revenue is reflected in the P&L statement.
Reading a P&L statement
To understand the story a P&L statement narrates, you must first understand how to read it.
So, put on your reading glasses, and let’s begin!
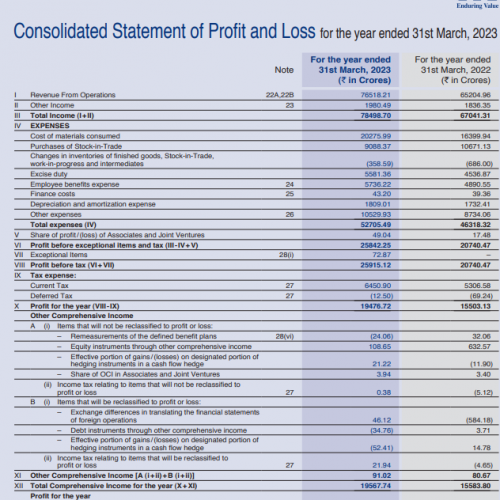
Here, we have taken an actual P&L statement for a large-cap company, ITC.

Headings
As discussed in the previous chapter, we will consider the consolidated statement. The headline specifies whether it is a standalone or consolidated statement and for which year. The left-hand column specifies the particular items, and their corresponding columns in the right state the total amount. The heading tells the period for which those figures are and their denomination.
The above case, the figures are in “Rs. crore” for FY22-23. These figures have been compared with the previous year’s figures.
Line items
Every row on the P&L Statement is called a line item. Most line items have “Financial Notes” or “Schedules,” which give the break-up of the financial figure. The P&L statement states the schedule/note number against the line item.

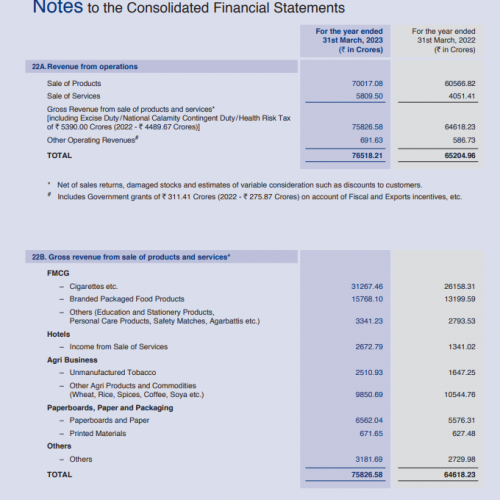
The first line item is Revenue from operations, also called the ‘top line.’ It tells you the value of sales the company made from its business. The second column, ‘Notes,’ reads 22A, 22B. You see the revenue breakdown when you go to “Notes to Consolidated financial statements” 22A, 22B.
In the above example, we will read the first line as follows:
ITC earned Rs. 76,518 crore in FY23 revenue, which is higher than last year’s Rs. 65,204 crore.
If you look at the notes, you will see that Cigarettes and Packaged Foods are two of its biggest revenue contributors.
You can read each line item on the P&L statement in the above format.
Why don’t you try reading the second line? Did you get it?
Now that we know how to read a line item, we will understand what each tells us about the company’s year.
Every P&L statement tells you something
Revenues
Revenue from operations: This is the revenue a company earns from its business operations, and it shows how well the business is doing sales-wise. The Notes will tell you which product is doing well and which is not.
If you look at the above example, ITC’s hotel business doubled its revenue, and all other segments reported good revenue growth except for other agri products. However, this segment forms a very small part of the company’s revenue. Hence, it had a minimal impact, and the company’s overall revenue surged.
Other Income: A company has other sources of income besides its business operations, such as interest/dividends on investments.
Expenses
This segment includes all types of expenses a company incurs to earn revenue from operations. It is divided into three segments: production cost, office cost, and finance cost.
Production cost: This cost will be high if your company is a manufacturing company. Some items included are:
- Cost of materials – the cost incurred to buy raw or finished goods to manufacture the goods/services.
- Stock-in-trade – the value of finished goods inventory a business holds for sale. For instance, a shopkeeper may hold 100 bags of sugar to sell in the market. The cost of those 100 bags of sugar is the stock-in-trade.
- Inventory – the goods that are already stored in the warehouse. Apart from new purchases, you also look at the inventory changes to help you determine the cost of goods sold.
Excise duty – the tax the company pays the government for certain goods for production, licensing, and sale.
In the airlines industry, they have aircraft fuel expenses instead of cost of materials.
Office cost: This will be high if your company is a service company. It includes:
- Employee benefits expense (salary, benefits, insurance, pension, etc.)
- Other expenses include utility bills, maintenance, repairs, advertising, legal charges, consulting fees, etc.
Employee cost is the highest in the IT industry.
Finance cost: It includes all costs a company incurs to raise debt or equity such as financial advisor charges, processing fees, interest paid, share-based payments to employees.
Other expenses
Depreciation and amortization expense: This is related to capital cost, which is a significant amount spent to buy an asset or a substantial amount of loan taken.
- Depreciation: Suppose company A buys a Rs. 10 lakh truck for business. The truck will keep working for 8-10 years (it is called the useful life of the truck). So how do you expense it? You cannot directly deduct Rs 10 lakh from your revenue as it will show a false picture of your operations. You will incur the Rs 10 lakh cost to buy the truck over its 10-year useful life. That deferring of the capital cost is called depreciation.
- Amortization: It is the principal amount you repay on the loans taken. Remember, the interest on the loan is recorded in the finance cost.
Exceptional Items: These are one-off expenses a company incurs beyond the ordinary course of business. For instance, a company received capital gains from selling one of its land or laid off 100 employees for which it incurred a one-time severance pay. If this is high, you might want to look into the cause. However, they will not affect daily operations.
Tax expenses: It is the corporate tax the company pays to the government on the profit earned.
Each of these line items is like the pixels of a photograph. They come together in a predetermined format to give you a clear picture of how profitable a company’s operations are.
Key elements of a P&L statement
Knowing about every line item is essential when doing a detailed study of a company. However, if you are doing a general health check of the company, you can directly jump to the 3 significant elements of the P&L statement.
- Revenue from operations
- Profit before tax
- Profit after tax
Revenue, as we discussed above, is the starting point of any business. It tells you how much demand your business has in the market. However, you should not look at the revenue figure in isolation. Compare it with historical data or with peers to identify trends.
The revenue trend can tell you much about its seasonality, cyclicality, or a one-off jump. For instance, electronics sales increase during the festive season (October – December). Hence, you might see a significant jump in sales due to a seasonal effect, which will vanish after January. Any one-off jumps or dips in revenue could be due to an incident or event, like a pandemic, boosted demand for sanitizers. And lastly, cyclicality occurs when there is an upgrade, like a PC upgrade cycle or consumer demand shift.
Profit or Loss is the outcome of the P&L statement. Hence, it is the most relevant part. Here, we have two types of profits:
Profit/Loss before tax (PBT) – It is the outcome after deducting all expenses except tax from the revenue. The tax expense is different for every company as it boils down to how tax-efficiently they process transactions. The PBT makes the company’s profits comparable with its peers.
Profit/Loss after tax (PAT) – This is also called net profit or bottom line of P&L. This is the after-tax amount left for shareholders after accounting for everything. When you divide this amount by the number of shares, you get earnings per share (EPS).
Every company strives to increase the above three metrics. All the strategies it undertakes, like expansion, new product launches, merger and acquisitions, etc., are designed to increase revenue sources and boost profits.
If you find anything out of place in the profitability picture, you can magnify the pixels and look more closely to identify what is causing the profit to rise or fall greater than anticipated.
Looking at the P&L statement through an investor’s lens
The P&L statement of every industry and company is different. Only after a thorough analysis of the P&L statement relative to peer companies and over time, will you be able to form a useful opinion on the same. Here is how a generic opinion might differ from a well-researched one:
General view | Fundamental lens |
An FMCG company will show a high cost of materials as it spends significantly on agricultural goods. | In 2023, when uneven monsoons increased the cost of most agricultural goods, FMCG stocks fell as their cost of materials increased significantly, affecting their profit before tax. |
An IT company will show high employee costs. | IT companies make major layoffs when their revenues are weak to reduce costs and maintain profitability. |
Profit or loss – the two words that matter most to both companies and investors. It’s what the entire business world revolves around. No wonder then that the main hero of our company biopic is the P&L statement.
However, other supporting characters in our movie play key roles, too. It’s time to meet the next one now.
Summary
- A profit & loss statement of a company tells you about the daily operations of a company. The end objective is to see what is left after deducting all expenses from the revenue.
- A P&L statement has various line items, which are either revenue or expenses. Most of these line items have a detailed bifurcation in the “Financial Notes” or “Schedules.” The P&L statement states the Notes no. too, which you can refer to to understand how the company arrived at that value.
- Revenue: This includes revenue from operations, which is the sales value generated by the business. It also includes other income, like interest and dividends earned from investments.
- Expenses: These are broadly classified into production costs (cost of materials, inventory, and excise duty to produce goods), office costs (employee costs, rent, maintenance, legal, advertising, and other charges), and finance costs (interest paid on loans and fees paid to raise loan and equity capital).
- Other expenses: These include depreciation and amortization, which are capital costs deferred over the life of the asset or loan to give a clear picture of daily operations. They also include exceptional items that are not part of daily operations and are just one-offs.
- The key elements of P&L are revenue, profit before tax, and profit after tax. Profit drives the business, and any unexpected change in profit attracts attention to a company’s expenses.