Chapter 7: Ratio Analysis Part 1: Finding Trends
This chapter will give an analytical view of financial statements. We will look at some popular financial ratios that show a connection between P&L and balance sheets to understand the trends within the company and its peer group. At the end of the chapter, you will know how to use ratios as clues to find anomalies.
We ended the last chapter by noting that financial statements are intertwined. The first half of the story begins with shareholders’ equity or debt used to buy assets to produce goods and services (operating expenses) and sell them (sales) with the intent to make a profit.
This profit is accumulated in reserves & surplus and sales on credit (yet to be paid for by the customer) are accumulated in accounts receivables.
You can analyze this interrelation between P&L and balance sheet using ratios.
What are ratios and how do you read them?
Ratios are a mathematical way of comparing two things that have a relation.
When we say the teacher-to-student ratio in a class is 1:10, it means that for every 10 students, there is 1 teacher. This 1:10 ratio can be applied to any volume – hundreds, thousands, millions, trillions. School A has 500 students and 50 teachers, whereas school B has 5 lakh students and 50,000 teachers. Both have the same ratio of 1:10. Ratios make such large numbers easily comparable.
Another way to look at ratios is through percentage, where you compare a portion with the whole. Suppose a pizza is divided into 8 slices, of which you eat 2. As the 2 slices were derived from those original 8 slices, your ratio would look something like this:
2/8, i.e., you ate 25% of the whole pizza.
Now that you know how to read ratios, we will look at some popular financial ratios and analyse them.
How to analyze data?
Remember, analysis is all about examining something in detail to discover more about it. The best way to start is to keep it simple. When you observe an object or behavior, you start with a base and see the trend over time and how it reacts to different situations.
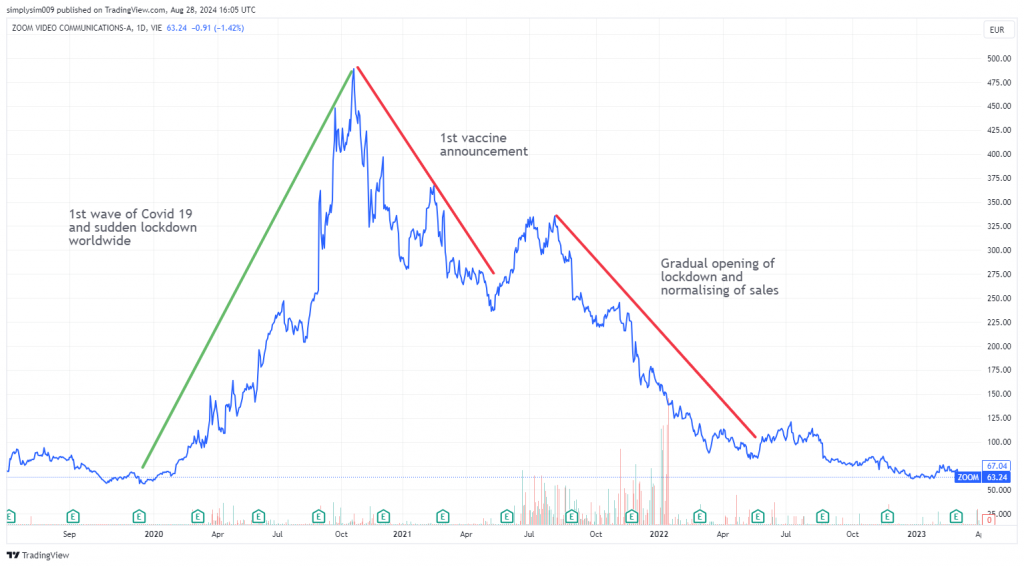
For instance, the Zoom video calling app saw a sudden surge in demand during the pandemic as the world took to virtual meetings. The company raked in good moolah in that one year. Once the lockdown was over, the demand fell, competitors came in, and the company could not sustain its profits.
Zoom Communications | 2018 | 2019 | 2020 | 2021 | 2022 | 2023 |
Net Profit Margin | -3% | 2% | 4% | 25.40% | 33.60% | 2.40% |
Another way to observe a company’s performance is by comparing it with its peers, i.e., comparing apples with apples. Even within apples, you should be specific about what you are comparing – are you comparing how red they are or their sweetness or size?
When you buy a phone, do you only consider the aesthetics and decide? No, you look at several parameters, such as battery life, camera quality, storage, quick charge, OS, and other features. But you won’t compare a button phone with a smartphone, even though both are phones.
For instance, if you compare a bowler to a batter based on batting skill, even though both are cricket players, you must factor in the difference. You must expect a bowler to give you a different run rate than your ace batter. But it is considered good if he gives you an average or above-average run rate.
This exercise adjusts your mindset to a fair analysis because ratios cannot be seen in isolation, and no absolute judgment can be derived just by looking at one ratio. You have to look at ratios in totality to get a clear 360-degree view of the situation before you make a decision.
Types of financial ratios
Financial ratios compare the balance sheet and P&L items to check a company’s financial skills on four fronts:
Operating Ratios – How efficiently the management is converting assets into revenue
Profitability Ratios – How much profit the management is generating from the capital and assets
Leverage Ratios – How efficiently the company is managing its debt and staying solvent
Valuation Ratios – Comparing the company’s book value with its stock price
💡Book Value: Book value per share tells you how much money the company holds for every share. A strong company’s share generally trades at a price higher than its book value.
As a fundamental investor, why do you need to know about these ratios to analyze the company’s trend over the years and compare it with peers?
Let’s say you invest ₹15 lakh in your friend’s business as an equity shareholder, becoming a part owner. You would want to know what he is doing with your money, wouldn’t you? Is he buying a vacation home or repaying his debt? Suppose he buys five tempos (for ₹3 lakhs each) for his logistics business. As part-owner, you would want to know how much revenue these tempos generate and whether they can cover their costs and generate profits. You would also want to know if your friend handles his debt without affecting your returns.
Wearing a business owner’s hat, let’s analyze each ratio. We will also share a basic formula, but you can tweak it according to the business and situation. There is no good or bad; the interpretation of these ratios is subjective to the company and situation. Hence, focus on understanding the logic behind the ratio, whether good or bad, not the computation.
You can look at operating and profitability ratios as follows:
- The numerator is the skill you are testing
- The denominator is the basis of your testing
Operating ratios
We are testing the company’s revenue-making skills in operating ratios from existing assets/debt/Shareholders Equity. Some of the common ones are:
- Fixed Assets Turnover Ratio
- Inventory Turnover Ratio
- Receivable Turnover Ratio
Before we get into ratios, here are the two financial statement terms you will keep running into. Here’s how you should look at these terms.
Revenue: Turnover refers to the revenue generated from operations. Companies also generate income from other sources but that will not tell you how efficient your business operations are. Hence, you might see two types of revenue (Operating Revenue and Total Revenue). We will understand this in more detail as we proceed with specific ratios.
Asset: During a financial year, a company may buy and sell assets and some assets may depreciate, changing the value of assets. Some analysts use the value of the asset at the end of the financial year and some use the average value of the asset of the last and current financial year. Here it is your call which value you want to use. We will be showing you the calculation for both Total Asset Value and Average Asset Value.
The relevancy of the first three ratios will depend on the type of business you are analyzing. We will take the Eicher Motors example and try to calculate the ratios simply by determining the base that you want to analyse the turnover with.
(i) Fixed assets turnover
Fixed Assets Turnover = Operating Revenues / Total Fixed Asset x 100
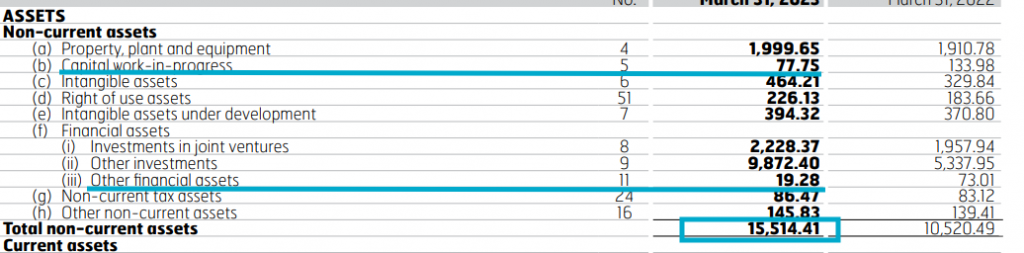
Eicher Motors is in the manufacturing and selling of bikes and trucks. Hence, it is a company whose fixed assets like plant, property, and machinery are important. In its fixed assets two segments may not be actively involved in generating turnover:
- ‘Capital work in progress’ comprises expenditure for buildings, plants during construction, and machinery yet to be installed. You can determine whether to keep it or remove it.
- ‘Other financial assets’ include investments in bank deposits above 12 months.
Since the above two items don’t meet our purpose, we will deduct them from the fixed asset (₹15,514.41 – (₹77.75 + ₹19.28) = ₹15,417.38).
Now that we have calculated the denominator (Total Fixed Asset), let’s calculate the actual ratio.
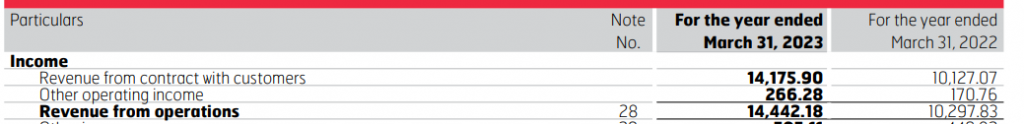
Hence, the operating revenue = ₹14,442.18
Eicher Motors Fixed Asset Turnover = 14 442.18 / 15,417.38 x 100 = 93.67%
What it means: The company is generating revenue of 93.67% of its fixed assets. This number looks good, but is it good? To identify this, we will compare it with the last five years.
Particulars | 2019 | 2020 | 2021 | 2022 | 2023 |
Operating Revenue (in crores) | ₹9,797.06 | ₹9,153.58 | ₹8,720.35 | ₹10297.83 | ₹14442.18 |
Fixed Assets* (in crores) | ₹6,677.37 | ₹6,024.30 | ₹5,663.36 | ₹10,313.50 | ₹15,417.38 |
Fixed Asset Turnover | 147% | 152% | 154% | 100% | 94% |
Looking at the last 5 years’ trend, the fixed asset turnover has decreased because the company tripled its fixed assets in the last three years to increase its revenue. You can read the Annual Report’s Management Discussion & Analysis, in which the company discusses its expansion plans and the road ahead.
A high Fixed Asset turnover is good, but a decline in the ratio could also be good, as it supports revenue growth. Comparing it with peers like Honda Motors or TVS Motors will give you a fair idea of the industry standard and where Eicher Motors stands.
We calculated the above ratio using the Total Value of the Fixed Asset. Now, we will see how to calculate the same ratio using the Average Value of the Fixed Asset.
Average Fixed Asset
Average Fixed Asset = 2022 Fixed Asset + 2023 Year Fixed Asset / 2
= (₹10,313.5 + ₹15,417.38) / 2
= ₹12,865.44
Average Fixed Asset Turnover = 14 442.18 (Operating Revenue) / 12,865.44 (Avg Fixed Asset) x 100 = 112%
Particulars | 2019 | 2020 | 2021 | 2022 | 2023 |
Operating Revenue (in crores) | ₹9,797.06 | ₹9,153.58 | ₹8,720.35 | ₹10,297.83 | ₹14,442.18 |
Average Fixed Asset (in crores) |
| ₹6,350.84 | ₹5,843.83 | ₹7,988.43 | ₹12,865.44 |
Average Fixed Asset Turnover |
| 144% | 149% | 129% | 112% |
You can experiment with the denominator and compare Reveneu with different parameters, such as
Average or Total Assets (Fixed + Current)
Average or Total Shareholder Equity
Average or Total Debt
Average or Total Working Capital (Current Assets – Current Liabilities)
FYI: Working Capital turnover is also called the Current or Net Capital.
The above ratios will tell you how much revenue the company is generating for every Re. 1 of the Denominator (Total Asset, Shareholder equity, Debt, Working Capital).
Which ratio to use: If a company has significant debt, you should know the debt turnover ratio. An asset-light company like Uber doesn’t have substantial fixed assets. In that case, you might consider Total Asset Turnover. The owner/investor might be interested in shareholder equity turnover in startups. These examples can help you start thinking analytically.
As you analyse more companies, you can build your own ratios. A company will likely compute ratios in a way that shows beneficial trends. The ratios can be easily manipulated depending on what you add and subtract from the numerator and denominator. Hence, it is suggested that you compute the ratios yourself.
(ii) Inventory turnover ratio
This ratio tells you how the company manages its inventory and whether it stocks enough goods to meet the demand and earn revenue. It can be divided into two parts:
(a) the turnover ratio tells you how many times a company restocks its inventory and
(b) how many days it take for the company to convert its inventory into revenue (turnover).
Unlike other turnover ratios, we take cost of goods sold (COGS) in the numerator as the inventory is held at COGS. For instance, Company A produces a pen at a cost of ₹5 and sells it for ₹7. Its COGS is ₹5 per pen. It sells 200 pens and has 100 pens stocked up in the inventory. In this case, its COGS would be ₹1,000 (₹5 x 200 pens sold) and the inventory value would be ₹500 (₹5 x 100 pens in stock).
This ratio is essential for companies that store goods until they are sold (retailers, manufacturers, and farmers).
To derive our Numerator (COGS) in the Eicher Motors example, we will add the 3 segments highlighted in the image below:
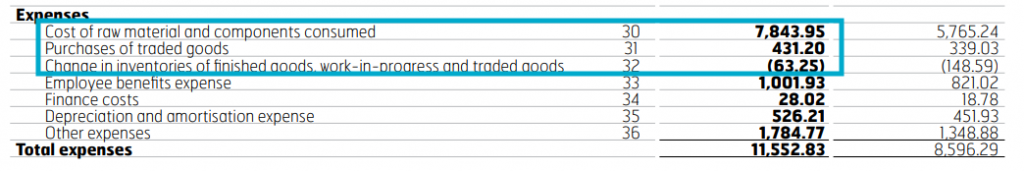
COGS = (7843.95 + 431.20 + (63.25))
= 8,211.9
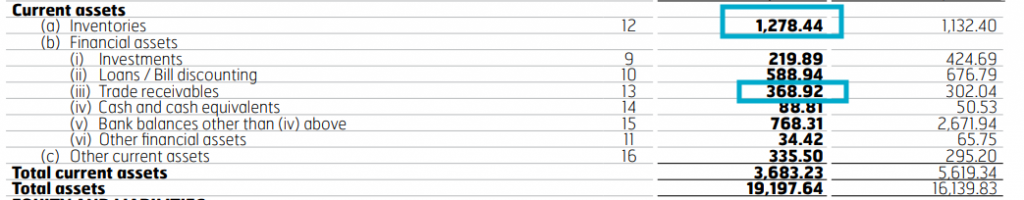
Inventory Turnover = Cost of Goods Sold / Inventory
= 8,211.9 / 1,278.44
= 6.4 times
This means the company replenishes its inventory 6.4 times in a year, which, if converted into days will be:
Number of Inventory days = 365 / 6.4
= 57 days
Particulars | 2019 | 2020 | 2021 | 2022 | 2023 |
COGS (in crore) | ₹5,057.38 | ₹4,995.94 | ₹5,112.77 | ₹5,955.68 | ₹8,211.90 |
Inventory (in crore) | ₹633.38 | ₹572.35 | ₹874.6 | ₹1,132.40 | ₹1,278.44 |
Inventory Turnover | 7.98 | 8.73 | 5.85 | 5.26 | 6.42 |
Days of Inventory | 45.71 | 41.82 | 62.44 | 69.40 | 56.82 |
The rupee value of inventories doesn’t tell you if it is high or low compared to the demand (COGS). Hence, you look at the inventory turnover ratio. Very low or very high inventory days might raise questions.
Low inventory – Why is the company not producing enough? Is it because of a lack of funding, low demand, or plant outage?
High inventory – Is there a supply shortage of raw materials? Has the demand for goods fallen, preventing the inventory from selling? Or is it because the company is stocking ahead of a new product launch or wedding season?
Again, you must look at the trend to analyze whether inventories are healthy or problematic.
Like this, you can also calculate the days of:
Accounts Payables
Accounts Receivables (here you will use Operating revenue instead of COGS)
Cash conversion cycle = Days of Inventory + Days of Receivables – Days of Payables
The cash conversion cycle tells you how many days the company takes to convert its inventory into cash.
Now try calculating the cash conversion cycle for Eicher Motors and analyse the numbers yourself!
So far, we have examined a company’s efficiency to generate revenue. The next most important aspect for an investor is PROFIT, the end objective of every business.
Summary
Ratios can be used to see the breakdown of things in numerics (3:2) or percentages (60%). A ratio standardizes the numbers and makes them comparable with others. For example, if you ate 2 slices of an 8-slice pizza, you ate 20% of the pizza.
Analysing data (ratios) requires you to observe a pattern in the ratios over time and in different situations and compare it with peers to understand where the company stands.
While analyzing the ratios, you have to keep clarity on two things:
What skills (profits, revenue) of a company you want to measure – Numerator
Against what parameters (assets, debt, equity) you want to measure it – Denominator
Fundamental analysts broadly use four types of financial ratios: operating, profitability, leverage, and valuation.
Balance sheet items can be used in two ways: the total value at the end of the financial year or the average of last year’s and current year’s values.
Operating ratios test the company’s revenue-making skills from assets, debt, or Shareholders Equity
Recalling all the important rations:
Fixed Assets Turnover = Operating Revenues / Total (Average) Fixed Asset
Days of Inventory = Cost of Goods Sold / Total (Average) Inventory
365/ Inventory Turnover
Cash conversion cycle = Days of Inventory + Days of Receivables – Days of Payables