Chapter 8: Ratio Analysis Part 2: Understanding the Nuances
This chapter will help you understand the nuances of EBIT and EBITDA, ROE and ROCE. We will analyse these profit measures through portability ratios and try to interpret the profit-making skills of the company.
Before we get into the nitty-gritties of profitability ratios, let’s take a halt and discuss EBITDA and EBIT, the two most commonly used – and often, confusing – terms.
EBIT = Earnings Before Interest and Taxes
EBITDA = Earnings before Interest, Taxes, Depreciation and Amortization
Lets say, Vinod is an average Indian with a monthly salary of ₹1 lakh. His monthly expense is ₹30,000 and ₹50,000 goes into EMI (car loan, home loan, personal loan) and ₹5,000 in taxes. If we were to calculate EBIT of Vinod:
Salary | ₹100,000 |
Monthly Expenses | -₹35,000 |
Loan EMIs | -₹50,000 |
Taxes | -₹5,000 |
Income in Hand | ₹10,000 |
EBIT | ₹65,000 |
Wait, what?! Where did that ₹65,000 come from???
Vinod would have ₹65,000 left after his expenses had he lived in a tax-free and debt-free world.
That’s EBIT and EBITDA for you!
If we compare a company’s expenses with an iceberg, EBITDA is just the tip of the iceberg. It only shows the income a company earned from its revenue without taking into consideration the cost incurred (debt and equity) to buy the assets.

But we live in a world where taxes and debt do form a significant part of our expense.
Then why consider EBITDA in the first place? Wouldn’t it be misleading?
It would if you look at EBITDA in isolation. The key reason for EBITDA is to compare one’s operations with that of another.
Let’s say Vinod has a colleague Suraj, with the same qualifications, experience, job profile and salary. But Suraj has an EBIT of ₹40,000 as he has higher expenses. In this case, everything else remaining constant, Vinod seems to be doing better than Suraj.
With this basic understanding of EBIT and EBITDA, now let’s understand the profitability ratios and why we introduced these terms now.
Profitability ratios
(i) EBITDA margin
EBITDA margin = EBITDA / Revenue
Unlike other ratios, it is a pure P&L ratio that tells you how much percentage of revenue was left as Profit after deducting the recurring expenses as in the case of Vinod. The recurring expenses that are directly related to generating revenue (cost of goods sold, marketing, distribution, salaries) are called operating expenses. They are common for all companies doing similar work.
When you deduct these operating expenses from revenue, you arrive at EBITDA, everything else remaining constant.
Suppose you have to compare Pepsi and Coca Cola, you will look at their EBITDA to determine which company is doing better on the operations front, which means at selling sugar water. EBITDA here could be the differentiator for an investor.
Now, how to calculate EBITDA.
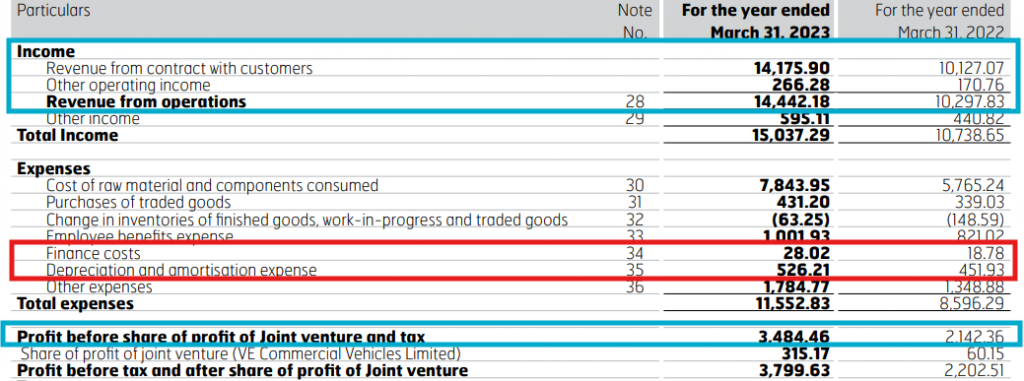
In the case of Eicher Motors, we have Profit Before Tax. We only have to deduct the Interest (Finance cost), Depreciation and Amortization from this profit to arrive at EBITDA.
Eicher Motors EBITDA = Profit before Tax – (Finance Cost + Depreciation and Amortization)
= 3484.46 – (28.02 + 526.21)
= 2,930.23
EBITDA Margin = 2930.23 / 14,442.18
= 20.23%
FYI: Going back to the pizza example in the previous chapter – if we ate 2 slices of the 8 slices of pizza, the EBITDA would be 2 and the EBITDA margin would be 25%.
EBITDA margin is a popular ratio as it helps you compare the operating profits of two companies.
You can replicate the margin (profit as a percentage of revenue) formula in other line items of P&L:
EBIT
Operating Expense
Net Income
You can choose a ratio depending on the relevance of the numerator. For instance, EBITDA is only relevant when the company has significant fixed assets or debt. Because then it will have a high depreciation and amortization expense.
Asset-heavy industries like manufacturing, airlines, telecom etc. place special emphasis on EBITDA to showcase their operating performance.
A software company has an asset-light model where depreciation and amortisation may not be significant. However, it might compete with peers of other countries that follow a different tax structure. Here you can use EBIT (before interest and tax) margin to compare their operating performance.
In a game of cricket, if you were to analyze the performance of a batter and a bowler, you would give more weightage to a batter’s run rate (numerator) and a bowler’s wickets (numerator). Similarly, you will first study a company’s business model and read the financial statements to understand which line items (EBITDA, EBIT, net income) you should give weightage to.
Till now we were comparing different types of profits with revenue. Now let’s change the denominator and compare the profit with the Balance Sheet items:
Capital Employed
Shareholders’ Equity
Assets
Here again, you can use the value of the above balance sheet items at the end of the financial year or calculate the average value of the last and current year.
(ii) Return on capital employed (ROCE)
Return on Capital Employed (ROCE) = EBIT / Capital Employed
Capital Employed means how much capital (debt + equity) is being used in the business to generate profit and is calculated as
Capital Employed = Long Term Debt + Equity
It excludes short-term debt as that capital will be paid off within 12 months and no longer contribute to profits.
EBIT: As short-term debt is excluded from the denominator, we have to exclude the cost of debt (finance cost) from the Numerator. Hence, we take EBIT (Earnings before interest and taxes) as the numerator. Remember, you have to adjust your numerator with the denominator.
The ROCE will tell you how much EBIT the company earned for every ₹1 of capital employed, without giving a bifurcation of how much return is from equity and how much from debt.
Startups and small companies may have low ROCE as they have deployed significant capital and have little to no profits. A high ROCE might look attractive but if the debt portion is high, it might not be attractive for equity shareholders.
Hence, you have to look at ROCE alongside ROE (Return on Equity).
(iii) Return on equity (ROE)
Return on Equity = Net Income / Shareholder’s Equity
(Here we used net income as that is what shareholders get as return.)
Remember the phrase, “Higher the risk, Higher the Return”?
In the case of ROE and Return on Capital Employed, the risk is Debt.
Let’s take a hypothetical scenario, and see how these ratios change with the change in the debt level, with everything else remaining constant.
EBIT | 60 | 60 | 60 |
Capital Employed (Debt + Equity) | 1000 | 1000 | 1000 |
ROCE | 6.0% | 6.0% | 6.0% |
1. Net Income | 50 | 50 | 50 |
a. Debt | 300 | 500 | 700 |
b. Equity | 700 | 500 | 300 |
ROE (1/b) | 7.1% | 10.0% | 16.7% |
The company’s debt grows from 300 to 700 while net profit, EBIT and total capital employed remain constant.
ROCE remains the same as it is a sum of debt and equity. However, ROE increases with an increase in debt as the net profit is distributed across a smaller portion of equity shareholders. If you look at the ROE table,
in the first scenario, ₹50 Net Income is being distributed among 70 shareholders (assuming 1 share = ₹10)
in the third scenario, ₹50 Net Income is being distributed among 30 shareholders, lowering the number of beneficiaries.
If a company has high debt, ROCE may not give you the true picture of the risk. In this case, a higher ROE will come with higher risk as creditors have the first right to the company’s assets.
Interpreting the ROCE and ROE from an investor point of view
A company can increase its return on equity either by increasing its net income (numerator) or decreasing its shareholder equity (denominator) through share buybacks. Hence, it is important to understand what is causing ratios to surge and if that cause is sustainable.
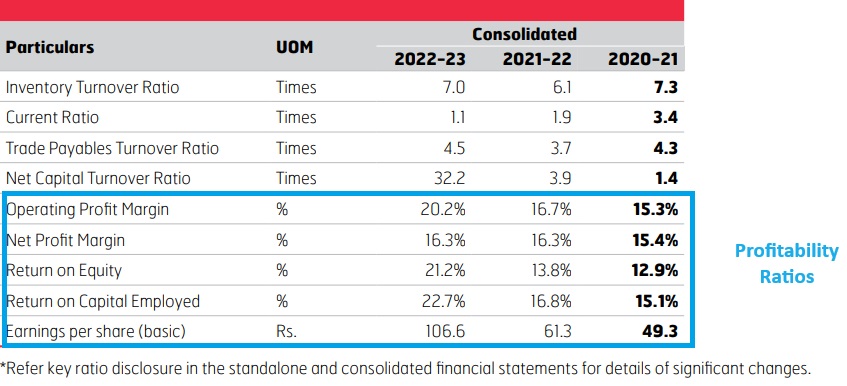
In the case of Eicher Motors, the company’s Return on Capital Employed and ROE increased simultaneously, alongside the operating margin, hinting that the surge was due to rising profits.
(iv) Return on assets (ROA)
ROA = Net Income / Total Asset
The ROA will tell you how much net income the company earned for every ₹1 of assets. If Company A has an ROA of 45% and Company B of 8%, which company would you choose?
The answer is more complex than choosing the one with a higher ROA.
ROA is especially relevant in companies with high fixed assets like real estate and airlines. Such companies have a low ROA since they are capital-intensive. As for asset-light companies like software and accounting services, ROA is high. Hence, it is important to compare the ratios of two companies in the same industry.
Then you have to look at the trend of the ROA, whether it is increasing or decreasing and Why?
Particulars | 2019 | 2020 | 2021 | 2022 | 2023 |
Net Income | ₹2,202.73 | ₹1,827.44 | ₹1,346.89 | ₹1,676.60 | ₹2,913.94 |
Average Fixed Asset |
| ₹6,350.84 | ₹5,843.83 | ₹7,988.43 | ₹12,865.44 |
Return on Asset |
| 29% | 23% | 21% | 23% |
In our Eicher Motors example, the company significantly increased its fixed assets in 2022 and 2023 to expand capacity and grow revenue and net income. Hence, its ROA saw a pullback in 2022 before increasing in 2023.
Interpreting Operating and Profitability Ratios
In all the above examples of operating and profitability ratios, you can see that a high ratio may not always be good and a low ratio might not always be bad. Ratios only standardize the overbearing numbers of millions and crores into 1 to 10 or 1% to 100% and make them comparable. You have to use your understanding of how the money flows in the business and use ratios as a tool to verify the efficiency of the money.
However, the efficiency and profitability ratios alone are not sufficient to tell you if the stock is a ‘buy’. You also have to look at the debt baggage the company is carrying, and identify if it is a “good debt” or “bad debt”.
The good and bad of debt
Debt as we know it is a loan that banks and bondholders give companies for a fixed period, in return for a fixed return called “interest’. This loan can bring immediate cash, helping fund business projects and expansions. Moreover, the interest on the debt is tax deductible, helping the company earn higher net income.
However, debt brings with it obligations to pay interest and repay the principal, irrespective of the company’s financial situation. And that is where the risk factor comes in. The good and bad of debt depends on the debt level a company can handle without impacting its operations.
Good Debt is when the return on capital is higher than the cost of debt. For instance, a company takes a loan at 5% interest to buy an asset. The return on the asset is 8%, the asset is earning its interest and also contributing to the company’s profit.
Bad debt is when the cost of debt is higher than the returns and the company doesn’t have enough liquidity to meet its debt obligations.
Leverage ratios
Leverage ratios are a warning sign, informing investors when a company’s debt obligations reach an alarming rate. We will look at the P&L and balance sheet segments related to debt and establish a numerator and denominator depending on what we want to analyse.
(i) Interest coverage ratios
The name of the ratio defines its purpose. It tells you if the company has enough profits to cover its interest payments. A company pays interest on debt from its EBIT (earnings before interest and tax).
Interest Coverage = EBIT / Interest payments
It tells you how many times over the company can pay its interest using its EBIT. If its interest payment is ₹200 and the company earned ₹1,000 in operating profit, its coverage is 5 times its interest payment.
You can use different variations of earnings and debt in this formula. Some companies use EBITDA (Earnings before interest, tax, depreciation and amortization). Some use interest and short-term principal repayment. The main objective of this ratio is to understand if the earnings can pay all debt obligations due in that year.
A perfect example of this is IndiGo Airlines. It has significant current liabilities and the non-current liabilities are significantly more than non-current assets.
Assets | 31-Mar-24 | 31-Mar-24 | Liabilities |
Total non-current assets | 463,714.00 | 494,297.67 | Total non-current liabilities |
Total current assets | 358,531.17 | 307,983.18 | Total current liabilities |
The airline uses interest payment, lease payments (aircraft lease) and the principal portion of the debt due in the year and EBITDA to calculate its coverage ratio. Since it includes more than interest, it uses the term debt service coverage ratio.
IndiGo’s ratio is 0.56, which means its EBITDA is only 0.56 times (half) the debt service cost. Its operations are not earning enough to meet its current debt obligations. This is the 2023 annual report. The pandemic significantly impacted airlines worldwide and pushed them into a debt spiral. Hence, the last three years were tough for IndiGo.
Once again, never look at a ratio in isolation, but at the trend over time to see signs of improvement or deceleration. Also, compare these ratios with peers to understand the industry standard. Debt is always a risk in the airline industry. Many airlines have even filed for bankruptcy because of huge capital and mounting debt.
(i) Debt to equity ratio
- Profitability ratios test the company’s profit-making skills from existing assets, debt, or Shareholders Equity
- EBITDA Margin = EBITDA/ Revenue
- Return on Capital Employed (ROCE) = EBIT / Capital Employed
- Return on Equity = Net Income / Shareholder’s equity
- ROA = Net Income / Total Asset
- Once you understand how to read and interpret the financial statement, ratios can help you understand the management’s efficiency in running the business.
- A company’s debt level, its ability to manage debt obligations, and impact on shareholder’s returns determine whether the debt is good or bad.
- Leverage ratio helps investors understand when debt obligations reach an alarming rate.
- Interest Coverage Ratio = EBIT / Interest Payments – It tells you if the company has enough profits to cover its interest payments.
- Debt-to-Equity ratio = Total Debt / Total Equity – it measures debt as a percentage of equity.
Summary
Profitability ratios test the company’s profit-making skills from existing assets, debt, or Shareholders Equity
EBITDA Margin = EBITDA/ Revenue
Return on Capital Employed (ROCE) = EBIT / Capital Employed
Return on Equity = Net Income / Shareholder’s equity
ROA = Net Income / Total Asset
Once you understand how to read and interpret the financial statement, ratios can help you understand the management’s efficiency in running the business.
A company’s debt level, its ability to manage debt obligations, and impact on shareholder’s returns determine whether the debt is good or bad.
Leverage ratio helps investors understand when debt obligations reach an alarming rate.
Interest Coverage Ratio = EBIT / Interest Payments – It tells you if the company has enough profits to cover its interest payments.
Debt-to-Equity ratio = Total Debt / Total Equity – it measures debt as a percentage of equity.