Chapter 9: In Search of Value
Until now, we have focused on a company’s efficiency and profitability, as well as the risk associated with debt. The next focus is on valuation ratios, which are crucial in making investment decisions. Here, you will understand how to identify the fundamental value of a share and compare it with the stock price.
Valuation ratios
The valuation ratio, even though a ratio just like the ones we explored in the previous chapters, deserves a separate chapter for one reason: it answers the all-important question every investor asks – “to buy or not to buy at the current stock price?”
To understand this better, we will revisit famed value investor Warren Buffett’s wise words: “Price is what you pay, and value is what you get.”
Let’s focus on value – What do you get?
As an equity shareholder, you have a right to the net profit after tax. The company divides the net profit in the following manner:
- Reserves and surplus is added to the shareholder’s equity
- Dividends and share buybacks are deducted from shareholder’s equity.
These adjustments are reflected in the “Other Equity,” as seen in the image below.

The total amount in the shareholder’s equity is divided among the number of issued shares. That is what you get (or lose) if a company discontinues its business. This amount is called the “book value” of the share, as it appears in the books of accounts.
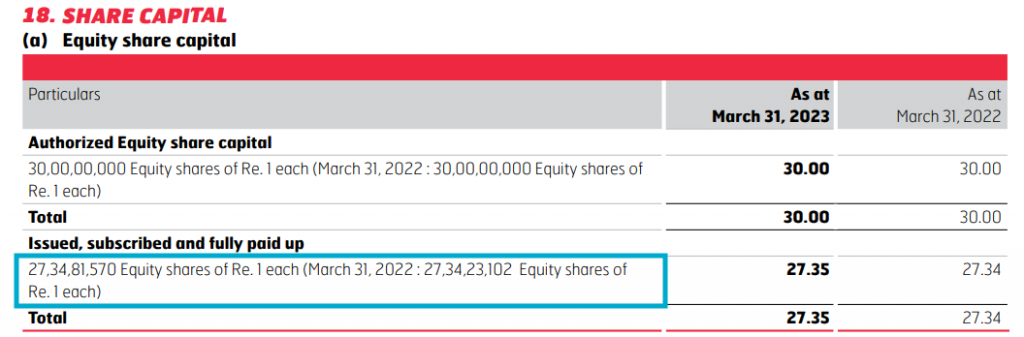
Tip: You can find the number of issued shares in the “Equity” section of Consolidated Balance Sheet or the accompanying Notes. Eicher Motors mentioned this data in the Note 17 of Equity Share Capital.
You can find the number of issued shares in the “Equity” section of Consolidated Balance Sheet or the accompanying Notes. Eicher Motors mentioned this data in the Note 17 of Equity Share Capital.
From here, we arrive at the first valuation ratio of Price to Book Value (P/BV).
Before we jump into the calculation part, let’s understand valuation ratios. They measure the stock price with the fundamental value of a single share. Note that any fundamental you take has to be divided by the number of issued shares.
(i) Price to book value (P/BV)
P/BV ratio = Stock price / book value per share
This ratio will tell you if the current stock price is above or below the book value per share.
In the case of Eicher Motors, we will take the stock price on May 11, 2023, when the company released its Q4 FY 23 earnings. The stock was trading at ₹3,626.35.
Book value = Shareholder Equity / Number of Issued shares
₹14,990,28,00,000 / 27,34,81,570 shares
= ₹548.12
[Note: (i) Shareholder equity is in crores. (ii) All figures have been taken from the images above]
Let’s plug in these values.
P/BV ratio = 3,626.35/ 548.12
= 6.6 times
The stock is trading at 6.6 times its book value. The 6.6x ratio might look expensive from the book value perspective, but you can only determine that once you compare it with the P/BV of peers and the industry ratio.
How do you interpret the Price-to-Book Value ratio?
Remember, the stock price reflects an investor’s expectation of future earnings potential of the company.
- A high P/BV ratio suggests that the market has overvalued the business. However, if the business is in a high-growth phase, a high ratio could also be attractive. Too high a ratio might be alarming.
- A low P/BV ratio suggests that the market has undervalued the business. But it may not always be the case if the company is making continuous losses or its sales are in a downtrend.
Hence, look at this ratio alongside the growth rate of sales and earnings trends to get a fair idea of whether the valuation is attractive.
Never base your decision on a single year’s ratio, as ratios could be skewed due to market volatility and short-term events. Always study the trend of ratios over the years to get a complete picture of the company.
You can replicate the above formula to derive:
- Price to Sales (P/S ratio)
- Price to Earnings (P/E ratio)
We have replicated the calculation to determine the PS and PE ratio.
We took Eicher Motors’s sales and net income after tax from its P&L statement and divided them by the total number of shares (27,34,81,570) to determine sales per share and earnings per share.
Particulars | Per Share | Valuation Ratio | Particulars |
Book Value Per Share | ₹ 548 | 6.62 | Price-to-Book Value |
Sales Per Share | ₹ 550 | 6.60 | Price-to-Sales Value |
Earnings Per Share | ₹ 107 | 34.03 | Price-to-Earnings Value |
When seen in isolation, these ratios may not tell you if the stock is undervalued or overvalued. You will have to compare it with industry peers to make an inference.
Eicher Motors P/E ratio of 34 might look high when seen in isolation. But when compared with the P/E ratio of two peers – Peer 1 (50.27) and Peer 2 (40.2) – Eicher Motors might look undervalued.
(ii) Price to earnings (P/E)
We will focus particularly on the PE ratio since earnings per share (EPS) are what shareholders get after the business pays everyone off.
In movies, you must have seen an affluent investor investing in the hero, who is still an underdog, because he sees “fire in his eyes.” The investor invests in the hero’s potential to do great things.
The same logic applies in the stock market minus the drama and cinematography.
A company’s share price reflects investors’ expectations about the company’s future earnings potential. If you look at a PE ratio of 30, you cannot make any interpretation. However, if you compare the PE ratio with the company’s earnings growth potential (earnings forecast), even a high PE ratio might be the right value for the stock. (We will learn how to forecast a company’s earnings in the later chapters.)
This is where we will introduce another popular ratio widely used in the stock market.
P/BV ratio = Stock price / book value per share
The PEG ratio compares the current PE ratio with the EPS growth forecast. Here, you forecast how much the company’s EPS will grow in the next 3 or 5 years.
PEG is an essential ratio if you are investing in a growing company whose EPS is also growing. To give you a crude analogy, when an eagle is on a hunt to catch its prey, it does not fly to the location where the prey is but to the location where the prey will be by the time it reaches the ground. Only when you look at the future will you be able to catch the growth.
Let’s take a hypothetical situation in which 3 companies operate in the same industry but have different PE and PEG ratios.
Company | P/E Ratio | EPS Growth (5 Years) | EPS 2024 | 2025 | 2026 | 2027 | 2028 | PEG Ratio |
Gati | 27 | 50% | ₹5.00 | ₹7.50 | ₹11.25 | ₹16.88 | ₹25.31 | 0.54 |
Madham | 13 | 25% | ₹8.00 | ₹10.00 | ₹12.50 | ₹15.63 | ₹19.53 | 0.52 |
Dheemi | 6 | 5% | ₹12.00 | ₹12.60 | ₹13.23 | ₹13.89 | ₹14.59 | 1.20 |
Gati has a high P/E ratio of 27 but is growing its EPS at an average annual rate of 50%. While P/E shows the stock is overvalued, the PEG of 0.54 shows it is undervalued as its high growth rate will compensate for the high P/E ratio.
How?
Standing at 2024, you see an EPS of ₹5. But like the eagle, you are not paying a 27 P/E ratio for the ₹5 EPS but for the ₹25 EPS you expect the company to report in 2028.
In this case, the stock Price is high, but the Value you could get in the next five years, as per your EPS forecast, could be higher.
At the same time, Dheemi has a low P/E ratio of 6, which might make it look like an attractive valuation. However it is growing its EPS at an average annual rate of 5%, which makes it overvalued from the PEG point of view.
So, while the PE ratio tells you value based on what has happened, the PEG ratio tells you value based on what could happen. Both ratios could be low or high or show opposite results.
These contrarian values of PE and PEG might put you in a dilemma about the better stock. As a fundamental investor, you must look at the company’s strengths and weaknesses to make this decision.
These valuations tell us that Gati is in the high-growth phase and carries high risk. To evaluate the risk and sustainability of the EPS growth, you will have to look at its operational and profitability ratios to make an informed decision.
Which ratio to use?
Which fundamentals (book value, EPS, sales) to choose to value a company depends on the type of business and your reason for being bullish on the industry. If it is a startup, you might be bullish on the sales as the company is in the early growth stages and may not have attractive earnings or book value. Similarly, a volume-based business (grocery) may not have strong profit margins, but its high sales might make the price-to-sales ratio a good measure.
At every stage of ratio analysis, the scenario changes depending on the growth phase and the industry your company is in. Hence, we first emphasize understanding the business model, then the growth phase, then reading and understanding the three financial statements, followed by financial ratios and valuation ratios.
For instance, in the case of Eicher Motors:
Business Model | Manufacturing Company |
Phase of Growth | Late Growth stage |
Essential line items in financial statements | Revenue and Net Profit (in the P&L Statement), Fixed Asset and Inventory (in the Balance Sheet). |
Important Financial Ratios | Fixed Asset Turnover, Inventory Turnover, Return on Equity, Return on Asset |
(Note: The company has very little debt, hence leverage ratios are not relevant) | |
Important Valuation Ratios | Price-to-Book Value, Price-to-Earnings |
Until now, we have only focused on the company’s past performance reflected in its P&L, Balance Sheet, and Cash Flows. It has already achieved these numbers. Next, we will understand how management’s corporate actions can impact the company’s future earnings.
Summary
- The valuation ratio helps you determine whether “to buy or not to buy at the current stock price?” It compares the company’s fundamentals with the stock price to determine whether it is undervalued or overvalued.
- The fundamental value of one share is determined by dividing the fundamentals (shareholder equity, sales, earnings) by the total number of issued shares. Just divide this number by the current stock price, and you get:
- Book value per share (Price-to-book value ratio)
- Sales per share (Price-to-sales ratio)
- Earnings per share (Price-to-earnings ratio)
- A general understanding is that a high valuation ratio (like the P/E ratio) means the stock is overvalued. However, these ratios should be considered alongside the company’s growth rate.
- A high-growth company may have a high P/E, P/S, and P/BV ratio. In such a scenario, even a high valuation will be attractive, but it will come with the risk of high-growth companies.
- Measuring the EPS growth and valuing the stock based on the future EPS is the PEG ratio.
- Which among the three ratios could best determine the value of a company depends on the company type, growth phase it is in, and which aspect of the business (EPS, sales, assets) you are bullish on.