Chapter 11: Fundamental Investing: Joining the Dots
As we near the end of our module, we have learned about business models, reading and making sense of financial statements, valuation, and qualitative analysis. But how do we put all these learnings into practice? This chapter will focus on a step-by-step process, from applying what is learned to generating a fundamental investment portfolio.
Before you invest in stocks, invest in yourself.
If you have reached this chapter, pat yourself on the back! You have cracked the most difficult part, which is investing your time in learning and sharpening the basics of fundamental investing. After all, a sharper axe can cut more trees than a blunt one.
Now it’s time to apply what we learned in building an investment portfolio. This process involves several steps and may take time at the start. But once you have your analysis ready, reviewing it will be much easier and faster.
The investing process begins with you
Before you analyze the stocks and business, you first have to analyse your own financial situation.
Take a pen and paper and list your expenses, income, savings, emergency funds, and financial obligations. What is left as free cash flow is the amount you can invest. Now ask yourself these questions:
- What do you want from your investment? – Wealth creation, passive income, or stable returns.
- How much can you invest, and for how long?
- What is your risk appetite? You may be a risk taker by personality and behavior, but if you have bills to pay and income is insufficient, take less risk.
- Determine your asset allocation across different assets, such as equity shares, bonds, fixed deposits, gold, ETFs, real estate, and more.
ETFs
Exchange-traded funds are like index mutual funds that trade on the stock exchange. ETFs mimic a stock index and strive to give you returns of the underlying index.
You can have multiple financial goals for different things and with different time horizons and risk profiles. You can build a portfolio for each goal and invest in specific stocks that meet your requirements.
- A growth portfolio mostly consists of stocks with significant growth potential, such as small and mid-sized companies, companies in their early growth stages, or companies in fast-growing markets.
- An income portfolio consists mainly of dividend stocks, bonds, and preference shares that pay regular dividends. It also involves stocks of large and stable companies in their mature growth stages.
- A value portfolio consists of stocks undervalued by the market and in which investors see huge potential. These stocks can be growth or dividend stocks of large, mid, and small-sized companies.
A balanced portfolio is a combination of all the above stocks.
Stock selection: top-down or bottom-up?
Once you are clear about your goal and the kind of portfolio you want, and are well aware of the risk, you can accordingly proceed to selecting stocks. Risk-averse investors are better off investing in large-cap stocks as they can sustain the downturn and grow in the long term.
Large-cap
Cap refers to market capitalization. Large-cap stocks are mostly well-established companies that are the market leaders in their sector and have a market cap of ₹20,000 crore and above. They have high trading volumes, and most mutual funds are invested in them.
Generating an investing idea depends significantly on your behavior, personality, and surroundings. Our decisions are often influenced by what we see, read, and experience. You might have heard of a stock in the news or your friend told you about a company. Some are marketing tactics a company uses to stay in the news. If any of these stocks excite you, you can study and observe their fundamentals. It is a random way of picking a stock.
A more structured way to approach stock identification (used even by institutions) is:
Top-down approach
You start with the macro trends, industry trends, and government policies to shortlist a sector. It is more broad-based and helps you invest in market cycles. It works well when you don’t have any stock in your watchlist. It is a more qualitative approach as you are targeting areas where you see opportunities.
For instance, the Russia-Ukraine war alerted countries to strengthen their security, and the government increased its defence budget, making investors bullish on defence stocks. Another instance is when the central bank began a series of interest rate hikes, making investors bullish on banks since they could earn higher interest income from their loan portfolio. Some cycles may be short, some long. For instance, secular growth trends like artificial intelligence and renewable energy could help you enter into long-term growth early.
Bottom-up approach
In this approach, you shortlist stocks based on fundamental ratios like price-to-equity, revenue, return on equity, profit after tax, market cap, price-to-book value, or even dividends. It is more stock-specific and quantitative. For instance, you are open to any sector, but the stock should have a market cap of ₹20,000 crore or a P/E ratio of below 12. This way, you eliminate risk.
You can use stock screeners for the bottom-up approach as they allow you to filter stocks using such parameters.
You cannot research every stock you shortlist. Studying 1 stock in detail could take 15-20 hours. Among your shortlisted stocks, you could take a stock trading below its 52-week high or a company in your area of competence. For instance, if you are a civil engineer, you could study an infrastructure or cement company. Starting fundamental research on a sector you are working in gives you an added degree of sector expertise that a finance or investment analyst may not have.
Evaluate the financial performance of the company
Once you have finalized the company you want to study, it is time to apply what you have learned from this module. Collect all the tools you need: Annual report of the last 3-5 years, market news, analyst reports, stock price, and Excel sheet.
- Start by studying the business model, and identify the growth phase the company currently is in
- Study the Porter’s 5 forces (customers, suppliers, competitors, substitutes and new entry). All this is available in the annual report and it will give you a fair idea of which segments of financial statements carry higher weightage.
- Read the financial statements and build a 5-year table of the key figures you believe you want to see the trends for. For instance, turnover plays a major role in FMCG stocks. So we will look at the turnover, cash flow from operations and any other information you need.
- See the growth rate and how the revenue or profit moved. Against every line item, you can create a column called Notes and mention any anomalies that drift the line item trend.
- Calculate the financial ratios you feel are relevant for the company. In Chapters 7 and 8 we discussed in length the important ratios and how to determine the relevant one.
Evaluate the management and leadership team
- Read the management discussion and analysis to know the company’s current state and management’s strategy to tackle risk and grab opportunities.
- Do a background check of the management (their experience, accomplishments, failures)
- Also, read the auditor’s report and do a corporate governance check. How? See if the MD&A acknowledges the risk and opportunity the financial statement presents.
Evaluate the economy, industry and competitive landscape
Look at the external macro, regulatory, and geo-political factors the company is sensitive to. If you used the top-down selection model, you already know the macro and industry factors. You just need to study the severity of the impact. The chairman’s statement will specify the same.
You could also examine the economic report, analysts’ statements, and management interviews to get a fair idea of the impact of an external event on the company’s fundamentals.
For instance, the RBI ban on Paytm Payments Bank sent tremors everywhere, and the stock fell drastically. At that time, a few institutional investors bought the stock at the dip because they believed the market had overreacted to the ban. They arrived at this conclusion from the analysis they had built.
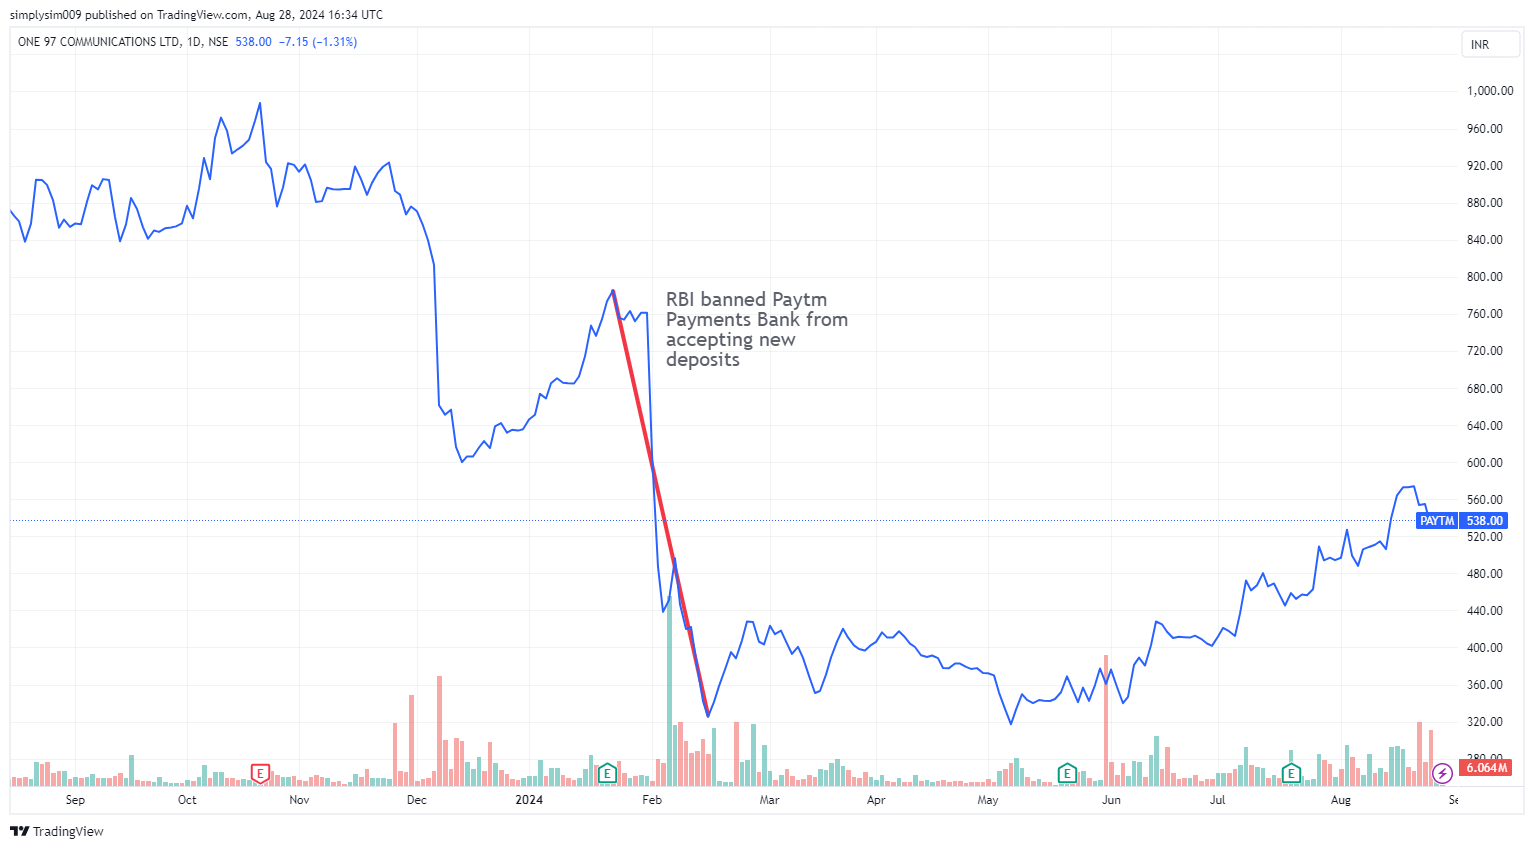
You should study the RBI law, the magnitude of its effect on Paytm’s revenue and business, identify the steps management can take to address the issue, and make changes to your analysis model accordingly.
f) Forecasting and valuation
At this stage, you have an Excel sheet with the key financial figures, their trends, future growth plans, and several factors affecting these figures. Now, it is time to use all this data to forecast future revenue, earnings, and free cash flow.
One of the easiest ways to forecast is to take the average of the past 3-year revenue or earnings growth and apply it in future years. As you make more models, you can learn advanced-level forecasting.
Year | Net Profit After Tax | YoY Growth | Notes |
2019 | ₹ 2,203 |
|
|
2020 | ₹ 1,827 | -17.0% | Pandemic |
2021 | ₹ 1,347 | -26.3% | Pandemic |
2022 | ₹ 1,677 | 24.5% |
|
2023 | ₹ 2,914 | 73.8% | Boost in Capital Spending |
2024* | ₹ 3,613.29 | 24% |
|
2025* | ₹ 4,480.47 | 24% |
|
2026* | ₹ 5,555.79 | 24% |
|
In the above table, we first noted Eicher Motors’ Profit After Tax (PAT) from FY19 to FY23. Now, we analyze the growth trend to make a fair assumption. The profit for FY20 and FY-21 fell due to the one-off pandemic. However, taking these numbers alone may not give a correct picture of its future growth. The FY23 PAT jumped significantly because of significant capital spending on production.
Since FY21 and 23 are outliers, the average of three years balances the growth rate to 24%. For some companies, you can also take the pre-pandemic growth rate if their earnings have normalized. Now, just multiply the 2023 PAT with the 24% average growth rate to get the future earnings forecast.
FY24* PAT = ₹2,914 crore x 1.24
= ₹3,613.29 crores
You can move to the valuations part now that you have future earnings and cash flows.
There are also some detailed methods, like the discounted cash flow (DCF) or dividend discounting model. This model bases its calculations on the difference between the amount you will earn from investing in a stock and the amount you will earn from putting that money in a fixed deposit.
If you invest ₹1 lakh in an FD for 5 years and ₹1 lakh in the stock, the stock should give you more returns as it comes with additional risk.
In DCF, we calculate the company’s future free cash flow and divide it by the FD interest rate to arrive at the stock’s present value. This model uses free cash flow, as that is the amount that belongs to shareholders after paying all other stakeholders. You could learn this model in advanced courses.
The valuation models will help you determine the fair price of a stock for the company’s future earnings potential. These future earnings forecasts are based on several assumptions. Events like corporate actions (M&A) or external factors beyond the management’s control (Policies, taxes, pandemic, natural disasters, changes in consumer behaviour) could significantly alter the forecast.
You could account for these events by adding a range to your forecast. If the company is large and resilient, you can see how much the stock price has moved on major events and put that as a range. For instance, a resilient stock whose fair market value as per your model is Rs 100, fell by an average of 10% in the past few crises.
Instead of forecasting the fair value as ₹100, you can consider a range of +/- 10%, which brings your forecasted value to ₹90 – ₹110.
If the stock is trading below this range, you could consider investing in it as you have built an expectation on future earnings and cash flow. The market might have probably undervalued the stock or overreacted to a short-term event, which could be balanced in the long term with higher recovery growth, as in the case of Eicher Motors.
Monitoring and Review
You can replicate the above process for multiple stocks. Each stock will give you a different outcome. You can build your own forecast model and a dashboard of each stock’s strengths, weaknesses, threats, and opportunities (SWOT).
Fundamental analysis and preparing a model sets the base. It is important to monitor and update your model from time to time to incorporate new market developments. Such reviews of your investments can help you identify red flags and exit an investment on time before the market crashes.
For instance, Warren Buffett sold his airline stocks worth $6 billion in less than a month when the pandemic broke in March 2020. He said the world has changed for the airlines. While some airlines recovered after three years, he was right to sell the stocks and cut losses because his reason for investing in airlines was improving operational efficiency and the profits they were making on every flight that took off.
There will be times when your decisions might not be right. But making mistakes is how you learn. The only thing you have to see in the learning process is that you are not losing money. Less profit is better than losses.
While this monitoring was of stocks you have already invested in, there is another angle to the review.
Doing a fundamental analysis of some stocks might be good. However, they might be overvalued at that time. You can add them to the watchlist and review their developments. Whenever they reach a favourable point, you can invest in them.
Some stocks look fundamentally weak when you review them. But you have your SWOT analysis with you. No business remains the same. The management keeps working towards making a business successful and profitable. You can put such stocks on another watchlist and keep reviewing them for fundamental developments. If you see any positive change, these stocks become a good investment as they can generate value.
Let’s take the case of Zomato. The company’s shares plunged after its July 2021 IPO as the loss-making company overvalued its shares during the IPO. The management changed its strategy and focussed on optimizing its operations and generating profits while growing revenue. The various efforts it took, such as reducing marketing expenses, closing underperforming branches in Tier 2 cities, charging platform fees, and more, helped the company report its first profit of ₹2 crores in Q1 2023 and increased it by 126.5 times to ₹253 crores in Q1 2024. During this time, its share price also surged.
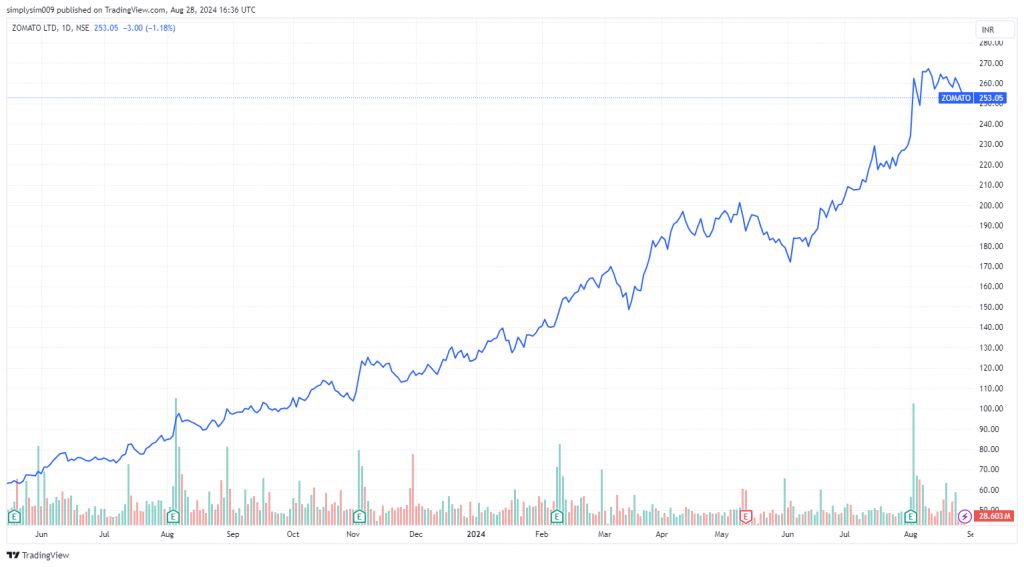
This shows that nothing is constant. The stock that was weak in the past may become strong in the future and vice versa. Hence, it is crucial to keep monitoring the market.
To put this in layman’s terms, Albert Einstein, the renowned scientist and genius, once failed a math test. Amitabh Bachchan, whose deep voice is one of the most recognised in the country, was rejected by All India Radio for his voice. These small setbacks did not define their future—indeed, they were overturned, and how!
Similarly, it would be incorrect to let one flaw cloud your analysis of a stock or company. Passing such a premature, one-time judgment over a single instance or data point could make you lose the opportunity for their recovery and future potential.
Moral of the story?
It is vital to keep monitoring the market at regular intervals to not miss out on opportunities and changed fortunes of a company. You can keep studying new companies and adding and deleting them from your portfolio.
This is just one method of fundamental analysis. You can use your knowledge of stocks and apply it to various investing styles to make the most of one stock.
Summary
- Fundamental investing can be structured in a step-by-step process to make it efficient.
- The first step is to analyze your financial goals, risk appetite, and investment horizon.
- Next, you select stocks based on your requirements and risk profile using a top-down or bottom-up approach. You could further shortlist the stocks by starting with the companies in your area of competence.
- You begin with understanding the business model and reading and analyzing the annual reports and financial statements.
- Evaluate management and leadership by reading management discussions and analyses and doing background checks on management.
- Study the external economic, industrial, and competitive landscape.
- Forecast earnings and derive the valuation of the stocks.
- Monitor the stocks you have studied and keep them on the watchlist.