Chapter 3: Stochastic RSI+Supertrend Strategy
Overview
In the previous chapter, we explored a positional trading strategy built around the exponential moving average (EMA) as a key technical indicator. Now, we will move on to another strategy that is versatile and suitable for all types of trading, including intraday, swing, and more extended time frames.
This strategy combines two powerful indicators: the stochastic RSI, a momentum oscillator that helps identify trends and predict potential reversals, and the super trend indicator, which assists in identifying the current market trend.
This strategy is particularly effective when a stock gains short-term momentum and is suitable for swing, positional, and intraday trading. Known as the ‘loss recovery strategy,’ a term coined by one of our experienced instructors, it works across different time frames.
Swing, positional, and intraday traders can benefit from this strategy. While it generates few signals, they are highly accurate, leading to trades that can last from days to several months, with a higher success rate across different time frames.
Let’s now explore the indicators we will use in this strategy.
Indicators used in this strategy
Similar to the RSI, It provides insights into trends and helps identify potential market reversals. This indicator is called the stochastic RSI because the oscillator’s values are calculated using the RSI rather than the stock price. It consists of two lines, %K and %D, which are effective in assessing overbought and oversold conditions. Here’s how %K is calculated:
%K = ((C – L14) / (H14 – L14)) × 100
%D = SMA(%K, 3)
Where:
C = Current close price
L14 = Lowest price in the last 14 periods
H14 = Highest price over the previous 14 periods
SMA(%K, 3 ) = 3-period simple moving average of the %K values.
The stochastic RSI is measured on a scale from 1 to 100. If the value is below 20, the market is considered oversold, and if it’s above 80, it is considered overbought, similar to the traditional RSI. When the two lines, %K and %D, intersect, it can signal a potential market reversal, indicating that the trend may be about to change direction.
In our strategy, we are modifying the stochastic RSI inputs by setting the stochastic oscillator length to 140, %K to 30, and %D to 30. The reason for this adjustment is to smooth out the signals, reduce noise, and ensure that only more robust, more reliable trends are identified.
The next indicator we are going to combine with stochastic RSI is the supertrend. It helps indicate the market direction by combining the average true range (ATR) with a multiplier, giving us a value that provides insights into market trends and direction.
The supertrend, based on price action and volatility, provides straightforward entry and exit points and enhances the trading strategy’s accuracy and efficiency. Check out more about super trend indicators here.
Here is a pictorial representation of inputs of both indicators
Spotting an entry
On a daily timeframe, we apply both the stochastic RSI and the super trend to generate entry and exit signals in the market. For a long trade entry, here is the checklist:
– The stochastic RSI value should be below 20, indicating a potential oversold condition in the market.
– An entry is triggered when %K crosses above %D, signaling a possible trend reversal.
– The supertrend indicator must be in the bullish zone, with all candles appearing above the green line.
The core idea behind the crossing of %K and %D is that slow stochastic K% crosses above D%, which indicates bullish momentum strengthening, potentially signaling a buy signal as it suggests the current price is rising faster than the average over recent periods.
Since this strategy is also suitable for intraday trading, we can short-sell or short futures based on the following checklist:
-Stochastic RSI value should be above 80, indicating an overbought condition.
-%K crosses below %D, signaling a potential downward trend.
The supertrend indicator should be in the bearish zone, with all candles appearing below the red line.
The supertrend helps in identifying the market direction, whether bullish or bearish, and plays a crucial role in setting stop-loss levels for our trades.
Just like in our previous strategy, we ensure that we are selecting stocks with a market capitalization above 1000 Cr. This helps in focusing on more liquid and stable stocks for better trade execution.
Now, we will look at our first example, which is Reliance.
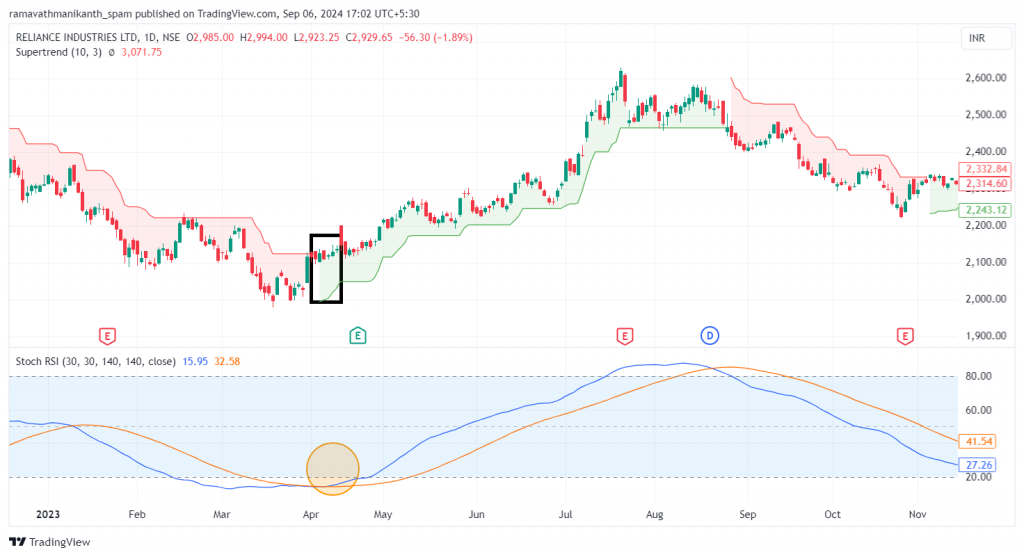
Planning the exit
The exit for this strategy is the exact opposite when taking a bullish stance on the stock value:
– We wait for the stochastic RSI value to reach 80, indicating an overbought zone.
– An exit is triggered when %K crosses below %D.
– The supertrend shifts to the bearish zone, with the formation of bearish candles.
This setup mirrors the conditions for a short trade entry, meaning when the market takes an opposite stance, we must also exit our current bullish position.
For the same example of Reliance, the exit will look like this.
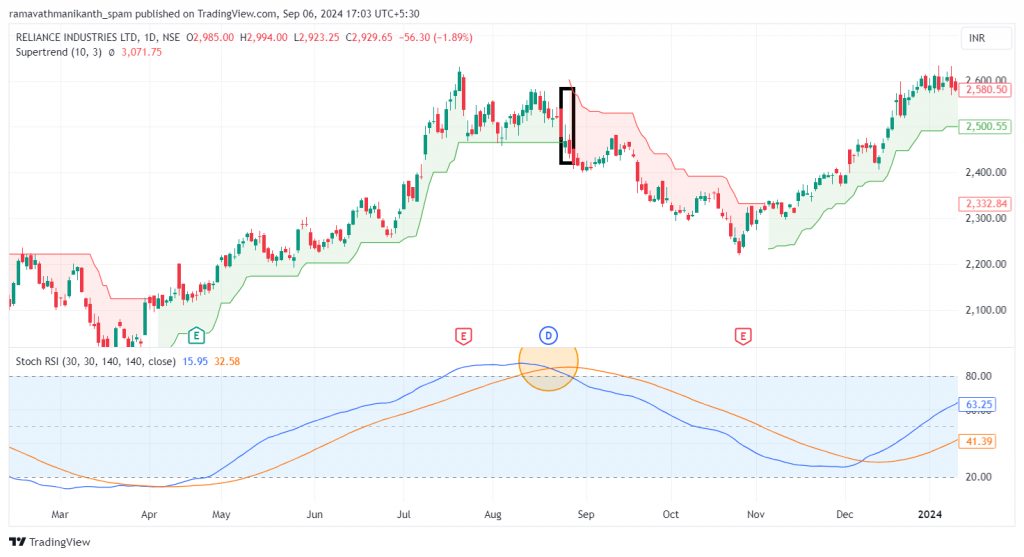
In the above example, as soon as the supertrend turns red, indicating a bearish signal, we exit our position. Additionally, it’s essential to keep an eye on the crossover of the stochastic RSI. The combination of both these signals provides a clear indication for an exit.
Stop loss
In this strategy, we use the supertrend as our trailing stop loss. This allows us to lock in profits while protecting against significant losses as it trails behind the price. The super trend adjusts automatically during periods of higher or lower volatility, reducing the risk of premature exits.
Additionally, it helps traders avoid making emotional decisions in volatile market conditions, providing a more structured approach to managing trades.
Examples
Here, our strategy gave entry into Ushamart’s daily time frame. Below is the chart of it.
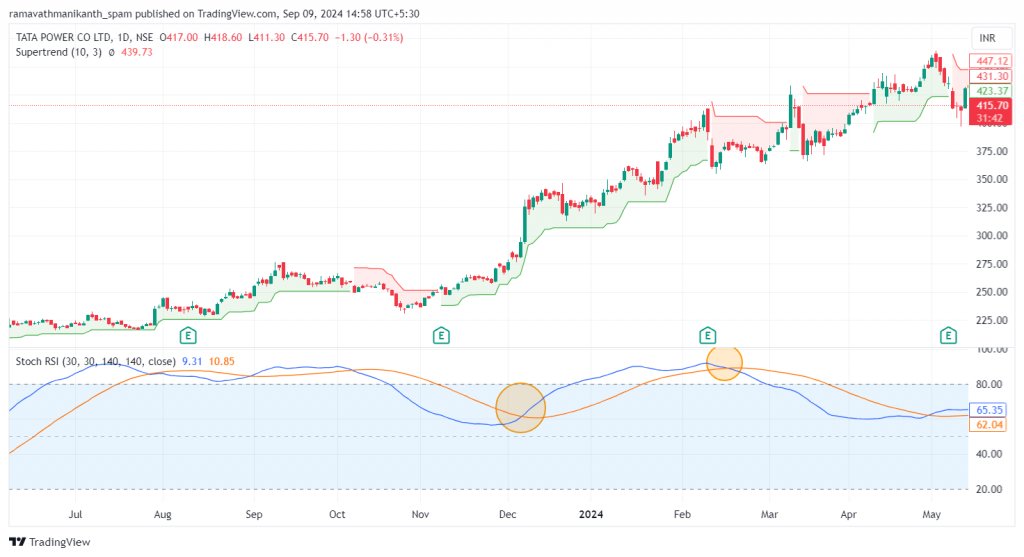
In the case of Tata Power, while the super trend indicator signaled a bullish entry, we held off until the two lines of the stochastic RSI crossed, confirming the momentum shift.Stochastic+RSI, the strategy, gave entry on 6th December 2023.
In the same image, the exit is highlighted by the stochastic RSI indicator. The bearish candles hit our stop loss, and the supertrend indicator turned red, signaling bearishness in Tata Power. This was our cue to exit.
This gave returns of 45% over a time frame of 65 days, which is quite decent.
Things to keep in mind
- This strategy works well for most stocks, as seen with examples like Reliance and Tata Power. For some stocks, it’s useful to zoom out to other timeframes, such as weekly or monthly, to achieve better results.
- Identifying the best timeframes for this strategy can be done through trial and error or by backtesting in TradingView to analyze results.
- This strategy generates a limited number of signals, so be cautious when using it in range-bound markets as frequent entries and exits can occur in a short time.
- In range-bound markets, small losses may accumulate due to commissions and slippage, which can reduce profits. Relying solely on this strategy may not be effective in such market conditions.
- To improve the validity of entries and exits, use volume as a key indicator, as it enhances accuracy, similar to its use in previous strategies.