Chapter 5: Fibonacci MA Crossover Strategy
This is the second swing trading strategy, which is unique because it uses only one powerful indicator: the exponential moving average. This indicator is applied across different time frames to determine entry points. The Fibonacci MA crossover strategy is suitable for capturing short- to medium-term price movements in the markets.
This strategy works best in trending markets where there is a clear trend or momentum, making it ideal for such conditions rather than sideways or highly volatile markets. Using different time frames helps capture short- to medium-term movements in the market. The core idea is that applying various time frames in the exponential moving average reduces market noise and provides clear signals, making it a straightforward yet effective method.
Let’s now dive deep into the strategy
Indicators used in this strategy
For this strategy, we are only using an exponential moving average (EMA), which is a weighted average of the closing prices of the last few trading sessions, with a higher weight given to the most recent sessions. For example, a 30-day moving average shows the average cost of the previous 30 trading sessions, where the weight given to the most recent sessions would be more than the weight given to older sessions. More about EMA’s here.
The three different EMAs help to reduce noise in the market and provide a signal in the market. In the Fibonacci MA Crossover strategy, we will use 8-day,13-day, and 21-day to construct the Exponential Moving average in the strategy.
Spotting an entry
We wait for the exponential moving averages to cross over to provide a signal. Once this crossover occurs, we take an entry into the market. Below are the criteria for this entry.
When the 8-day EMA crosses above the 13-day and 21-day EMA, and the 13-day EMA crosses above the 21-day EMA on a daily time frame.
Entry is confirmed when the crossover occurs. Specifically, when the 8-day EMA crosses above both the 13-day and 21-day EMAs, it indicates that short-term momentum is increasing, signaling a shift to a bullish stance and suggesting that the stock is in upward momentum, with a potential uptrend forming. Additionally, when the 13-day EMA crosses above the 21-day EMA, it shows that the medium-term trend is also turning positive, confirming that the short-term strength is evolving into a more sustained uptrend.
For a more ideal approach, it’s best to take an entry at the end of the day, entering on the next candlestick formed after the crossover. This method suits a risk-taker approach. However, for a risk-averse approach, it’s advisable to enter the stock only after the candlestick surpasses the high of the previous one. This ensures a strong confirmation of upward momentum, reducing the likelihood of entering a false breakout.
Just after the crossover occurs, it’s helpful to confirm the entry by identifying a bullish candlestick pattern like a bullish marubozu or morning star. These patterns provide strong confirmation for entering the trade, reinforcing the likelihood of an upward movement.
Let’s look at a clear example of the Fibonacci MA Crossover strategy.
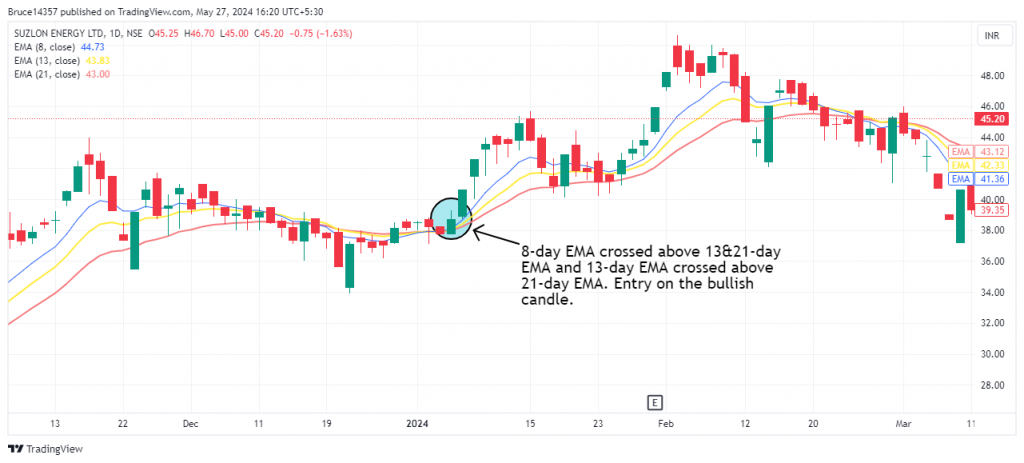
In the chart above, we can see the short-term moving average crossing over the long-term moving average. It’s helpful to color-code them differently to make this distinction clearer. Additionally, a bullish marubozu candlestick is formed, signaling a buying opportunity.
For a risk-averse approach, as we discussed, the next candlestick should surpass the crossover candlestick. We would have entered the market with the first candle for a risk-taker or the second candlestick for a risk-averse approach.
Planning an exit
We will exit our strategy and exit the trade in either of the following instances:
- When the price reaches the latest swing high or previously tested resistance level
- Shorter-term moving average (8-day) crosses below the longer-term moving average (13-day) with a distinct bearish candle
With the conditions above, spotting a bearish candlestick like a bearish marubozu or evening star along with either of the above conditions provides strong confirmation for exiting the trade.
The latest swing high or previous resistance level often acts as a ceiling, limiting further upward movement. This is a crucial price point where sellers may re-enter the market, causing the price to reverse. By exiting at this point, we lock in profits before a potential pullback or reversal occurs.
When the 8-day moving average crosses below the 13-day moving average with a bearish candlestick, it indicates a potential trend reversal or weakening momentum. The crossover, especially with a bearish candle, signals that the price may continue to decline, suggesting it’s a good point to exit and avoid further losses.
Here is the same example of Suzlon that gave exit for our Fibonacci MA crossover strategy
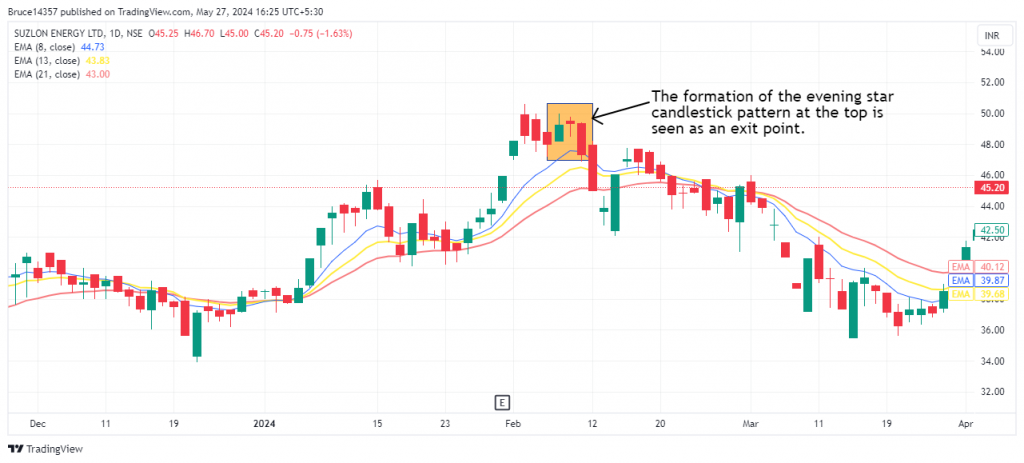
The chart serves as a strong example of a death crossover, where the long-term moving average overtakes the shorter-term moving average. This indicates that recent price momentum is weakening, and a longer-term downtrend may be forming. In our example, the 8-day moving average is the shorter-term, and the 13-day moving average is the longer-term indicator.
In the above example of the Suzlon chart, the highlighted box with a significant bearish candlestick pattern combined with the moving average crossover provided a clear exit signal for the strategy.
Stop loss
For the Fibonacci MA Crossover strategy, the 13-day EMA is used as a stop loss because it represents a critical level of support, reflecting the longer-term trend within a short-to-medium time frame. The 13-day EMA smooths out price fluctuations over a more extended period than the 8-day EMA. Using it as a stop loss ensures that the exit signal is based on a broader view of the trend.
Setting the stop loss based on the 13-day EMA prevents exiting too early due to short-term price volatility. It allows traders to ride out minor fluctuations while still exiting when the longer-term momentum weakens, thus managing risk effectively.
Examples
The strategy gave an entry signal in Suzlon Energy stock on 4th January 2024, where the 8-day moving average crossed over both the longer-term 13-day and 21-day moving averages, accompanied by a bullish candlestick pattern. Below is the chart of this event, which clearly illustrates the crossover and the bullish momentum it indicated.
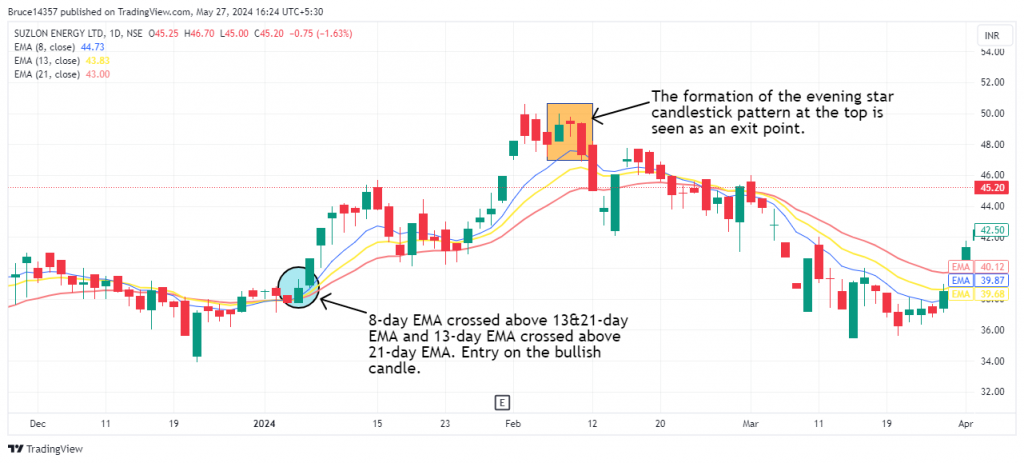
This strategy confirmed an exit when the evening candlestick pattern formed, a bearish pattern indicating potential bearishness in the market. As we can see, Suzlon’s stock took a downturn right after that. It is crucial to monitor bearish candlestick patterns and moving averages within this strategy. This trade would have yielded a return of 31.4%.
Things to keep in mind
- The Fibonacci MA Crossover strategy is best suited for the daily time frame for most stocks. However, for some stocks, other time frames, such as weekly or monthly, may produce better results. Finding the perfect time frame involves a trial-and-error approach and requires thorough backtesting to identify what works best for a specific stock or market condition.
- Over-relying on a single strategy is not advised, as strategies like the Fibonacci MA Crossover work well in trending markets but could underperform or lead to losses in other conditions, such as sideways or highly volatile markets.
- Diversifying your strategies can help mitigate the risk posed by changing market conditions, ensuring more consistent performance across different market environments.
- Volume is a crucial indicator for any strategy. High trading volumes indicate increased participation by traders.