Chapter 3: Single Candlestick Patterns – Part 1
We have learned that candlestick charts are a better way to interpret market movements than any other chart type. So, in this chapter, we will discuss the most prominent single candlestick patterns that can help us understand these movements better to take a trade.
As the name suggests, single candlestick patterns are formed by just one candle. The trading signal is generated based on a single-period trading action. Trades based on single candlestick patterns can be highly profitable, provided the patterns are identified, rules are followed, and the trade is correctly executed.
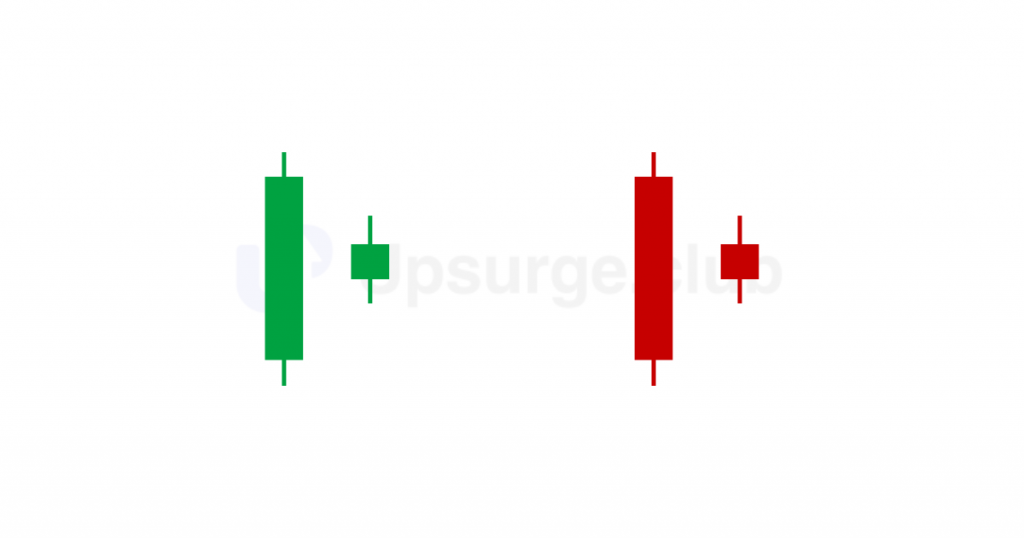
Another crucial factor to consider while trading based on candlestick patterns is the length of the candle. One candlestick shows the day's trading activity. Generally speaking, the longer the body, the more intense the buying or selling pressure. Conversely, short candlesticks indicate little price movement and represent consolidation. Here is an image depicting candles with long and short bodies, respectively:
Candlestick Trading Rules
Before we delve into single candlestick patterns, we must remember a few rules that must be followed.
Buy strength, sell weakness
The universal stock market rule says, “Buy low, sell high”. A bullish (green) candle represents a price strength, and a bearish (red) candle represents weakness. Hence, we must ensure it is a green day when we are buying, and whenever we are selling, ensure it’s a red candle day.
Be flexible with patterns
While the textbook definition of a pattern could state specific criteria, minor changes due to market conditions could occur. So we have to be flexible. However, one must be flexible within limits, so quantifying the flexibility is always required.
From now on, we will discuss the different single candlestick patterns. Let’s start with a simple but powerful pattern: the Marubozu.
Marubozu
How does a bullish marubozu form?
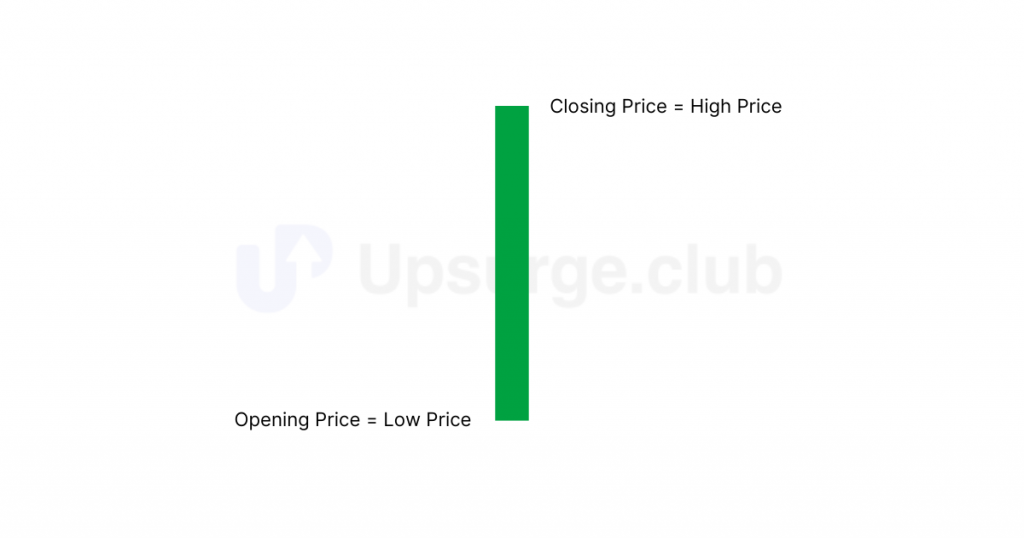
A bullish marubozu is a candle whose:
- The closing price is greater than its opening price
- The opening price is equal to the low price, and
- The closing price is equal to the high price.
Whenever a candlestick with the above characteristics occurs, a bullish marubozu is said to be formed. Irrespective of prior trends, a bullish marubozu indicates strong bullishness in the market. It may look like this:
A bullish marubozu signifies enormous buying pressure in the market. Considering a daily chart, market participants are willing to buy from the start of the day until the market closes for trading. This shows buyers have gained control of the market, and the overall market sentiment is bullish.
How to trade a bullish marubozu?
As traders, we should seek buying opportunities since the market outlook has turned bullish with the appearance of the marubozu candlestick. This bullish sentiment is anticipated to persist for the subsequent few trading sessions.
Ideally, a trade can be entered on the same day the marubozu is formed, just before the market closes at 3:20 PM. Still, the bullish marubozu must be validated by checking that the candle’s high equals the stock’s current market price (CMP). If these conditions are met, we will confirm that a bullish marubozu is formed, and we can go long on the stock.
Long
Going “long” on an asset means buying and holding it because you expect its price to increase. This involves purchasing stocks, bonds, or other securities to sell them later at a higher price for a profit. It reflects a positive outlook on the asset’s future performance.
- Entry point: Enter the trade at or just below the close of the bullish marubozu candle.
- Confirmation: An uptrend is confirmed if the next candle is bullish and breaks the high of the marubozu. If you prefer a more risk-averse approach, you can also enter here.
- Stop loss: A stop loss can be placed below the low of the bullish marubozu candle to limit potential losses.
Let’s understand with an example trade in Infosys.
Here, first, we will validate the physical characteristics of a candle as highlighted in the image.
Open = 1414
High = 1427
Low = 1413
Close = 1426
As we know, a bullish marubozu’s opening price should equal its low price, and a high price should equal its closing price. Although the opening price does not match its low price, there is hardly any difference between them. Remember that there can be minor variations in candlestick patterns, and we must be flexible as long as the logic of the concept holds.
Based on our method, the trade setup for the above Infosys stock would be as follows:
Entry price = Between 1427 and 1430
Stop Loss = 1413
But if we want to confirm the formation of a bullish marubozu or have a risk-averse approach, we must wait until the next day. The downside is that buying the next day results in a much higher purchase price and a deeper stop loss.
In our example, buying Infosys on the same or the next day would have been profitable.
Here is another example of a bullish marubozu pattern and a resulting uptrend:
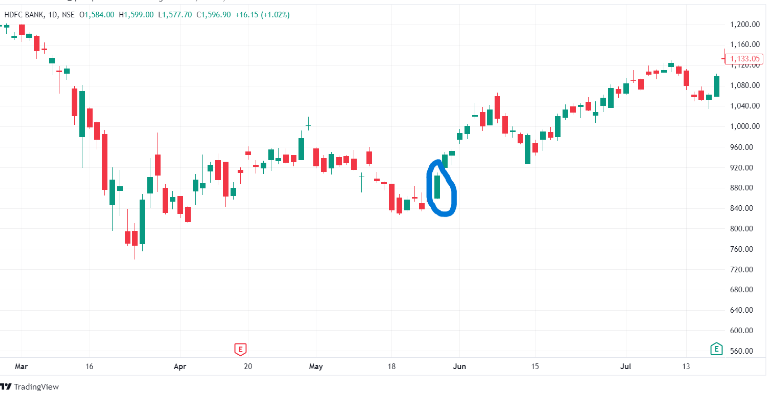
The above example of HDFC Bank shows that it would have been profitable here if we had bought this stock on the same day or the next day. However, there will be some cases where marubozu candlesticks fail, like the one below:

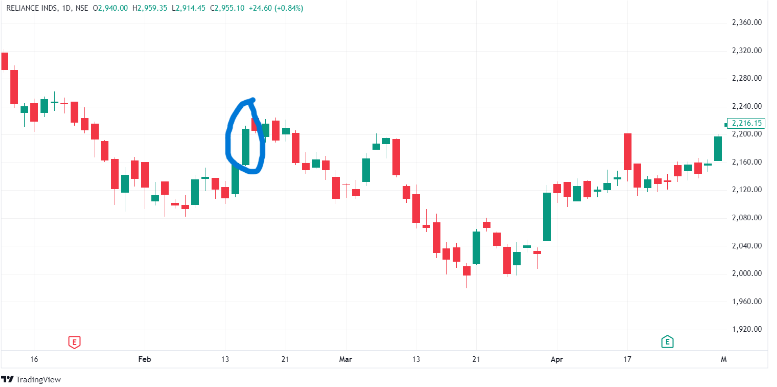
After a bullish marubozu formed on Reliance’s stock, a downtrend resulted. Hence, remember that not every marubozu is foolproof, and having a stop loss can help you deal with such situations.
Now, let’s move on to the bearish marubozu.
Bearish Marubozu
How does a bearish marubozu form?
As a bullish marubozu indicates a strong sentiment of bullishness, the bearish marubozu reflects bearish sentiment in the market, and it is formed when a candle’s
- The closing price is less than its opening price
- The opening price is equal to its high price
- The closing price is equal to its low price
This candlestick indicates selling is done for each price point throughout the day. It does not matter what the prior trend has been; the action on the marubozu day suggests that the sentiment has changed, and the stock is now bearish.
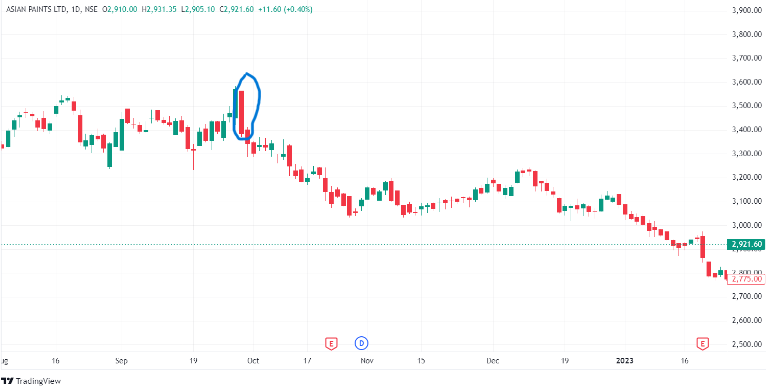
In the above chart of Asian Paints, a bearish marubozu pattern is formed after a significant drop in the stock. If we look at the OHLC data,
Open = 3563
High = 3563
Low = 3378
Close = 3378
As mentioned before, a slight variation in OHLC is acceptable up to a specific limit.
Typically, for a marubozu candle, the open and high (for bearish marubozu) or open and low (for bullish marubozu) can have a slight difference, generally not more than 1% of the stock's price. We use this 1% limit because it ensures the candle still clearly indicates strong selling (or buying) pressure without significant price fluctuations, which might otherwise weaken the reliability of the marubozu pattern.
For example, if the stock price is 3563, a 1% variation would be about 36 points. So, if the high were slightly higher at 3599, it would still be considered a valid marubozu pattern. This 1% limit maintains the integrity of the marubozu pattern by ensuring it accurately reflects market sentiment.
How to trade a bearish marubozu?
A trader should look out for shorting opportunities in the market because sudden changes in sentiment will be carried forward over the subsequent few trading sessions.
- Entry Point: Enter the trade at the close of the bearish Marubozu candle or the opening of the next candle.
- Confirmation: Confirm the downtrend by checking if the next candle breaks the marubozu low. If you prefer a more risk-averse approach, you can also enter here.
- Setting Stop Loss: Place the stop loss at the high of the Marubozu candle to limit potential losses if the trade goes against you.
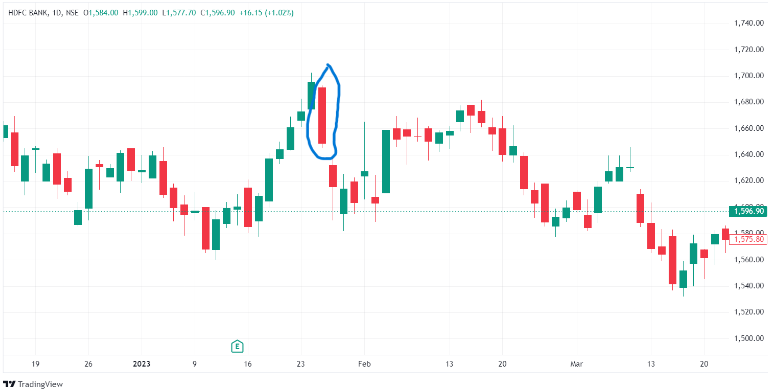
Let’s look at an example in HDFC Bank’s stock:
When the Pattern Falls Short
Earlier in this chapter, we discussed why a candle’s length is essential. We should avoid trading when the candles are small because they show low trading activity. Small candles make it hard to predict market movement because they indicate that prices are the same, making it unclear how the market is going. With fewer people trading, price signals are less reliable, increasing overall volatility.
Here is an example from the Tata Motors Ltd. chart:
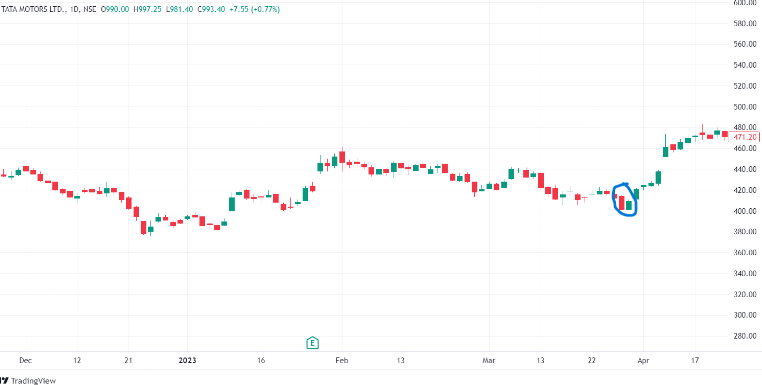
For this reason, one should avoid trading in too short candles.
Let’s move on to the second candlestick pattern – the Doji.
Doji
How does a doji form?
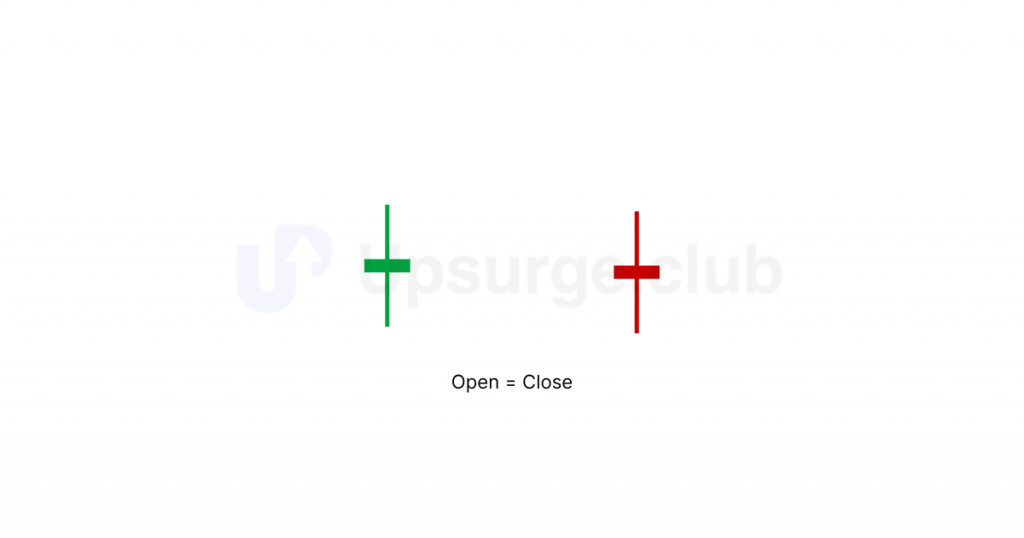
A Doji is formed when
- The opening price of a candle is equal to the closing price.
The upper and lower wicks can be of any length, resulting in the cross, inverted cross, or plus sign. It is a vital candlestick pattern that tells us about market sentiment. The word “doji” refers to both the singular and plural forms.
Though bullish and bearish dojis signify roughly the same sentiment, here’s a pictorial representation of the candlestick:
A doji conveys a sense of indecision or tug-of-war between buyers and sellers. Prices move above and below the opening level during the session but close at or near the opening level. The result is a standoff. Neither bulls nor bears could gain control, and a turning point could develop.
A doji can signal different things based on its place in the trend, making it a vital pattern to watch. Let’s discuss each one.
Doji in an uptrend
The relevance of doji depends upon the preceding trend or preceding candlesticks. The formation of doji after an uptrend or a long green candlestick shows that buying pressure is weakening. After a downtrend or a prolonged red candlestick, a doji signifies that selling pressure is easing.
Dojis indicate that supply and demand are balancing, and a trend change may be near. Dojis alone don’t confirm a reversal; further proof is needed.
Let’s look at the daily chart of the Infosys Ltd. chart.
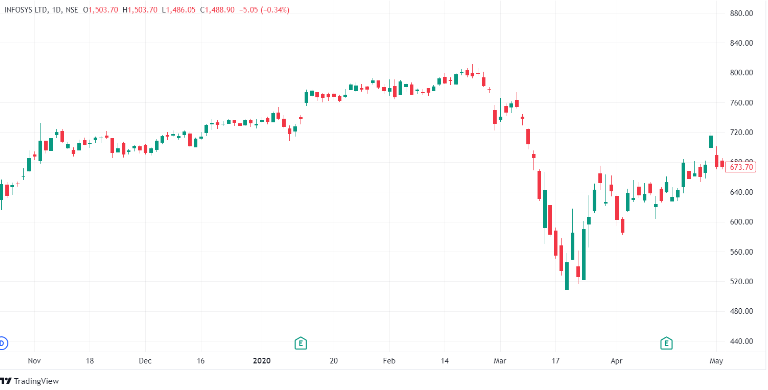
Here, the doji appears after a healthy uptrend, after which the stock reverses its direction and corrects.
Doji in a downtrend
After a decline or long red candlestick, a doji shows that selling pressure might be easing, and the downtrend could end. Though the bears are losing control, more strength is needed to confirm a reversal.
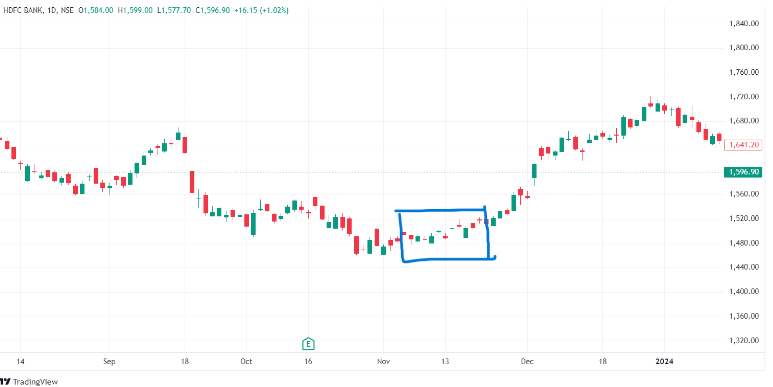
The chart shows an initial downtrend, indicating a period of selling pressure for HDFC Bank. Following this, several doji candlesticks suggest indecisiveness in the market, as buyers and sellers have a definitive upper hand. After this period of indecision, the buyers are marking a significant upward movement.
So, the next time you see a doji individually or in a cluster, remember that the market is indecisive. The market could swing either way, and you need to build a stance that adapts to the expected movement.
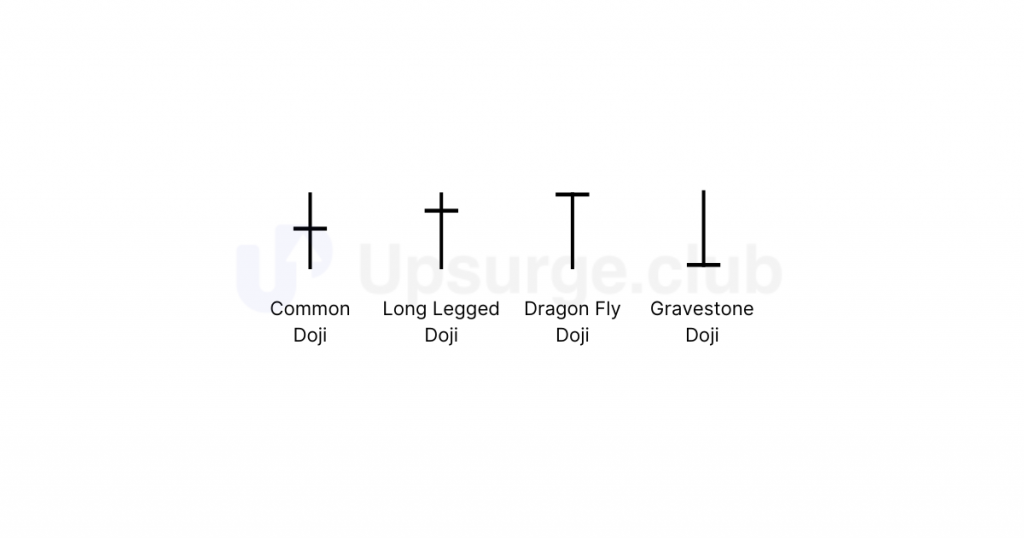
Other types of doji candles also exist, depending on their shape and size. Let’s decode each one.
- Long-Legged Doji: These candles have long upper and lower shadows almost equal in length. These reflect a significant amount of indecision in the market. Long-legged doji indicate that prices traded well above and below the session’s opening level but closed virtually even with the open. After much noise and commotion, the outcome was almost the same as the beginning of that day.
- Dragonfly Doji: A Dragonfly Doji forms when the open, high, and close prices are the same, creating a long lower shadow. The candlestick resembles a “T” because there is no upper shadow. This pattern indicates that sellers controlled the session, pushing prices down, but by the end, buyers returned and brought prices back up to the opening level. A Dragonfly Doji suggests a potential reversal or shift in market sentiment.
- Dragonfly Doji in a Downtrend: In a falling market or near a low point, this pattern can suggest a possible turnaround to higher prices.
- Dragonfly Doji in an Uptrend: In a rising market, a Dragonfly Doji means buyers tried to push prices up, but sellers were still strong. After a good rally, this pattern suggests a price drop. We need more proof to confirm this change.
3. Gravestone Doji: This candle’s structure is inverted to dragonfly doji, resulting in an upside-down “T” due to the lack of a lower shadow. It is formed when the open, low, and close are equal. The psychology behind this candle is that sellers had resurfaced by the end of the day and pushed prices back to the opening level and the session low.
- Gravestone Doji in a Downtrend: After a long downtrend, a long black candlestick, or near a low point, the focus shifts to the buying pressure, suggesting a potential bullish reversal.
- Gravestone Doji in an Uptrend: Gravestone Doji shows a failed rally despite some buying pressure in a rising market. Near a high point, this pattern suggests a potential bearish reversal.
Here’s an image representing all types of Doji
In the next chapter, we will study the hammer candlestick pattern and its different variations. We will also understand how to set targets while trading with single candlestick patterns.
Summary
1. A single candle represents day trading activity. The length of the candle is very crucial. Longer bodies indicate stronger buying or selling pressure, while shorter ones indicate consolidation.
2. A marubozu candlestick does not have an upper or lower wick, which indicates strong momentum on either side.
- Bullish marubozu candle’s open = low, close = high, shows bullishness
- Bearish marubozu candle’s high=open, low=close,showing bearishness
3. A doji candlestick represents indecisiveness in the market. One should also consider the preceding candle to anticipate future market sentiment.