Chapter 1: Introduction to Technical Analysis
If you’re here, you must have made peace with the fact that you cannot pick stocks randomly and expect to get rich one day. The stock markets don’t work that way.
You must follow a method or structure backed by reason to build wealth in the stock markets. There are many logical methods, one of the most popular ones being technical analysis.
Understanding Technical Analysis
It must be pretty clear by now that you must buy and sell the right ones at the right time to profit from stocks. But how do you know when to buy or sell a stock? And what things should you look at before choosing a stock? This is where technical analysis comes into play.
Technical analysis helps predict the directionality of financial assets such as stocks. But what is technical analysis all about? And what exactly does this mean for you as someone who wants to trade and make money through stocks?
Let us understand with a simple example.
Imagine you are a farmer. You have bought new land in another town for agricultural purposes, and you must decide which crop to plant to maximize your land’s productivity.
Option 1: Research by yourself
Imagine you try to conduct some research of your own. You might want to answer questions like:
- Based on the water conditions, which crop will suit this soil?
- What is the most appropriate crop for this climate?
- Which crop has the highest demand and will fetch a good price in the market?
After reviewing a vast checklist, you will try what seems ideal and hope for the best.
The advantage of this technique is that you will know more about the crop you are planting. However, this method will only give you an idea of what may happen, and you have to check for different crops in your limited time. Hence, there is a large uncertainty about the crop’s performance because it is based on a lot of guesswork and restricted information.
There are some advantages to this technique, too. You will have a deeper understanding of the crop you are planting. However, this method can be time-consuming, and there will be a long gestation period to determine if the chosen crop will yield the best results. The decision also risks being based on a limited set of data and personal assumptions, which may not provide the most reliable outcome.
Option 2: Learn from other who've done it
Another option to decide your crop too.
You can ask your neighbour farmers which crop they have been harvesting in the past. You will know that a particular crop has a high benefit in that area, and by following them, you can plant a crop that has worked for farmers in that area. There is a high chance that you would benefit by planting that specific crop because you’re relying on proven information from the market participants in that area.
The paramount comfort of this technique is its scalability. You need to know which crop is the best fit and has the most demand in that area. However, beware that your neighboring farmers might only sometimes be correct.
From Fields to Finance: Picking Winners
Option 1 is similar to fundamental analysis in financial markets, where you independently research the stock you buy.
Fundamental Analysis
Fundamental analysis is a way to determine a company’s actual value by examining its finances, business model, management, and the overall economy.
Option 2 is similar to technical analysis, where the idea is to select and trade stocks based on their historical data and market participants’ behavior.
Technical analysis studies market action, just like our farming analogy. You have farming tools and equipment to help you sow seeds and fertilize land. As a result, you get proper management to get the maximum yield of crops. Similarly, tools like historical price data and indicators help us estimate the market’s direction in technical analysis. Both technical and fundamental analysis solve the same problem: determining the direction in which prices will likely move. They just approach the situation differently.
Technical analysts focus on the effect, believing that the outcome is all they need to know, and do not unnecessarily consider the reasons or causes of that effect. On the other hand, fundamental analysts always seek to understand why something is happening and try to predict the factor instead of its impact.
Technical Analyst
A technical analyst studies past market data, primarily price and volume, to predict future price movements. They use charts and indicators to identify patterns and trends in the market.
Fundamental Analyst
A fundamental analyst examines a company’s financial health, such as its profits and growth, to determine whether its stock is a good investment. They study company earnings, revenue, and the overall economy to understand the stock’s value.
Like any other research technique, technical analysis has its own set of assumptions. As you trade based on technical analysis, you should know these to unleash the full potential of technical analysis.
Generally, people argue that one approach is more suitable for decoding the market. Each method has merits and demerits, and wise traders will educate themselves to look for investing and trading opportunities in the market.
Assumptions of Technical Analysis
Now that you understand the concept of technical analysis, it is crucial to know its assumptions. This approach is based on three premises:
- Markets discount everything: This assumption means that all factors—fundamental, psychological, and political—are already reflected in the market price. For example, if someone with inside information buys a lot of a company’s stock because they expect good earnings, the stock price might rise even before the announcement. This price movement hints to technical analysts that something significant will happen. Here, we are assuming that no such publicly available information is yet to be reflected in the market price.
- Price moves in a trend: Market prices always follow a trend. All significant market moves are the outcome of a trend. Most techniques used in technical analysis are trend-following, meaning they intend to identify and follow existing trends. For example, the recent rise in the NIFTY 50 index is a good illustration. The index has been reaching new highs and has surged significantly this year. Once a trend is established, prices tend to move in that direction.
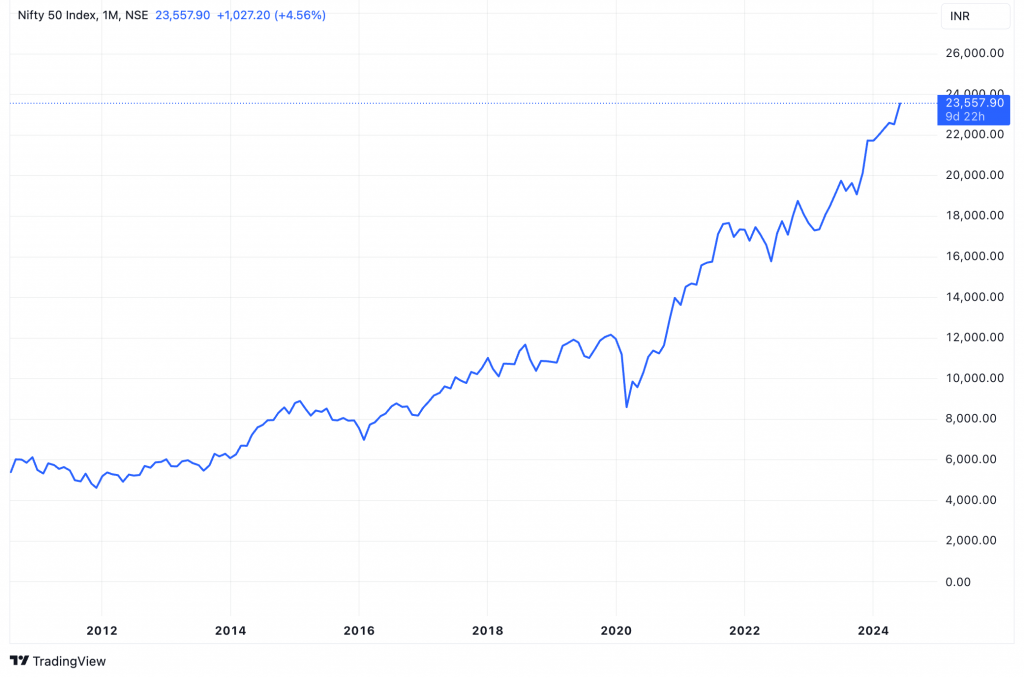
All Time High
An all-time high in the context of stocks is the highest price a stock has ever reached in its trading history.
Technical Analysis Fits Everywhere
One of the beauties of technical analysis is that it can be applied to any asset class with historical time series data. Time series data in technical analysis includes price information such as open price, high price, low price, close price, and volume.
Types of Prices
- Open Price: The first price at which a stock is traded when the market opens for the day.
-
High Price: The highest price at which a stock has been traded during a specific period, like a day.
-
Low Price: The lowest price at which a stock has been traded during a specific period, like a day.
-
Close Price: The last price at which a stock is traded when the market closes for the day.
-
Volume: The total number of shares of a stock that are bought and sold during a specific period, like a day.
Trading is just like learning to play guitar. Once you master the basic chords and techniques, you can play any song, regardless of the genre. Similarly, once you learn technical analysis, you can apply the concept to trade across Indian markets, such as equity, crypto, forex, and fixed income.
Fundamental Analysis vs. Technical Analysis
Technical analysis provides flexibility across asset classes, which is impossible with any other research technique. However, fundamental analysis requires studying many aspects of an asset class. And these fundamentals change with each asset class. For example, while you will have to research company financials and management commentary when analyzing companies, you will have to check factors such as rainfall, harvest, demand, supply, inventory, etc., while studying commodities. On the other hand, technical analysis will remain the same. It is independent of the asset you are studying. We can apply the same technical indicator to various asset classes because it’s primarily about historical data.
Annual Report
An annual report is a detailed document that a company publishes yearly to show its financial performance and activities. It includes information about how much money the company made and spent, what it owns and owes, and its plans for the future. It helps investors understand the company’s performance, history, and future plans.
Can Technical Analysis be Used Across Time Frames?
Another strength of technical analysis is its ability to handle different time frames. The same principles apply when trading minute-by-minute changes for intraday or focusing on longer-term trends. Some believe this technique is only valid for short-term analysis, but that’s not true. It can also be very effective for long-term forecasting. Using weekly and monthly charts that span several years, you can successfully apply technical analysis for long-term predictions, just as you do for short-term trades.
Intraday
Intraday means within the same trading day, i.e., buying and selling a stock between market opening and closing.
When to Use Technical Analysis and When Not TO
Market players often see technical analysis as an easy way to earn money in the stock market because it involves identifying patterns and making trading opportunities for them. However, one must try to learn the technique to reach that stage.
Before diving deeper into this technical analysis guide, it’s essential to understand when and when not to use technical analysis.
When to use technical analysis
- Short-term trading: Technical analysis is ideal for intraday or swing trading because it mainly helps capture quick gains based on short to medium-term trends.
- Identifying entry and exit points: Technical analysis reads price and volume to determine the directionality. It helps traders decide when to enter and exit trades by identifying patterns and signals that indicate potential price changes.
- Volatile and liquid markets: Technical analysis helps traders get more accurate signals in volatile markets where fundamental analysis might be less meaningful to deploy. For instance, forex markets have very high liquidity and volatility, and there is historical proof that technical analysis generates decent returns there.
Volatile
A market or stock is considered volatile when its prices change quickly and unpredictably, often with large swings up or down.
Liquid Markets
A liquid market is one where assets can be quickly bought or sold without causing a significant change in their price, typically because there are many buyers and sellers.
When to not use technical analysis
Just like you learned when to use technical analysis, you should also know when not to…
- Not Suitable for Long-Term: Fundamental analysis is more suitable for long-term investments because, over long periods, factors like a company’s fundamentals, industry trends, and overall economic conditions have a more significant impact than price trends. These long-term trends are guided by underlying factors, which fundamental analysis aims to determine. Let’s understand this with TCS, short for Tata Consultancy Services, an IT company whose stock trades on Indian exchanges.
Technical analysis doesn’t always work…
Take Tata Consultancy Services (TCS), a leading IT company in India. You’d choose to invest in TCS for its long-term growth, strong earnings, and solid business model. However, in the short term, regulatory concerns might arise. Technical analysis might signal a short-term decline, helping you avoid buying TCS at a lower value and suffering a loss. So, from a long-term perspective, fundamentals typically play a vital role in the price of assets.
2. Unpredictable Events: Technical analysis offers little help in predicting and capturing profits from significant news events, such as election results, geopolitical issues, or economic events, like changes in GDP and interest rates, because market sentiment shifts suddenly. Thus, technical analysis of stocks is of little use in these situations.
3. Illiquid Markets: Technical analysis often fails in low-liquid assets because low trading activity makes assets easy to manipulate, rendering the logic of technical analysis meaningless. Here, general patterns or indicators of technical analysis don’t work.
In the next chapter, we’ll explore how stock prices fluctuate and learn how to read and interpret them for effective trading.
Summary
1. Technical analysis helps determine the future direction of financial assets using historical data, such as price and volume.
2. This method can be applied to various assets as long as historical data is available, making it adaptable to different time frames.
3. Technical analysis is based on a few core assumptions:
- Markets discount everything: All factors are reflected in the market price.
- Price moves in trends: Significant market moves follow established trends.
- History tends to repeat itself: Price trends repeat due to consistent human psychology.
4. In liquid markets, technical analysis identifies short-term trading opportunities but is less suitable for predicting uncertain events and determining asset values in the long term.