Chapter 4: Single Candlestick Patterns – Part 2
This chapter will focus on the four candlestick patterns: hammer, inverted hammer, hanging man, and shooting star.
Hammer
How does a hammer form?
A hammer is a significant candlestick pattern that is formed after a downtrend. It is formed when
- The closing price is near the high,
- The opening price is near the high, and
- There is enough gap between the closing price (in case of bearish) or opening price (in case of bullish) and the candle’s low.
The longer, the lower the shadow, the more bullish the pattern. Here is how a hammer may look, whether bullish or bearish.
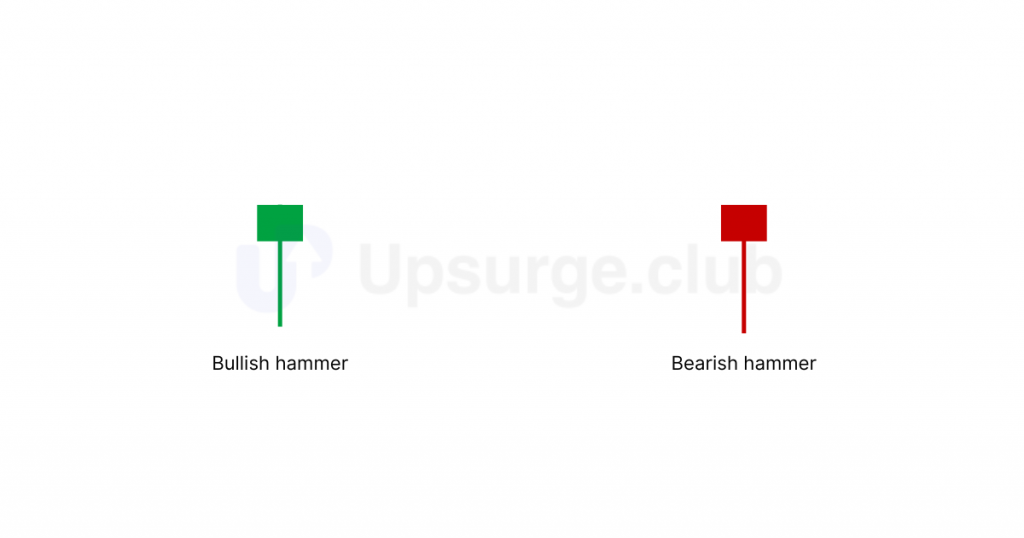
A hammer candlestick pattern forms when sellers push the price down, but buyers step in and drive it back up, showing strong buying interest and a potential reversal. The color of a hammer doesn’t matter much because its shape indicates a possible reversal. The key is the shadow-to-body ratio. The natural body of a hammer candlestick should be small compared to its long lower shadow, which should ideally be at least twice the length of the natural body.
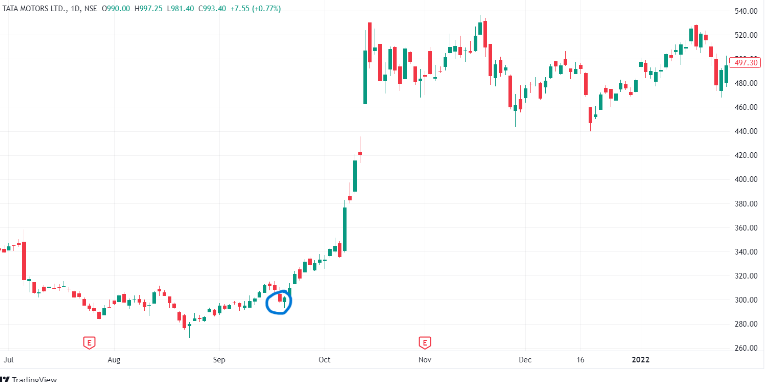
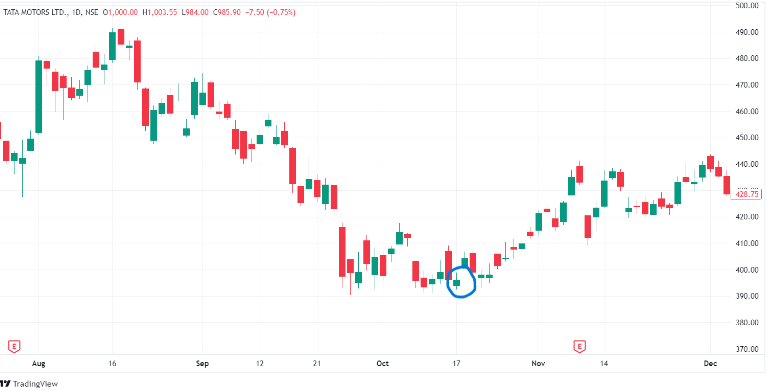
Let’s understand the above chart. Tata Motors faced a significant decline with sellers in control. Each day, the stock opens and closes lower than the previous day’s close, making a new low. When the hammer candlestick is formed, some buyers step in and start buying the stock, pushing it to near the day’s high.
The hammer’s occurrence shows that buyers are trying to stop the stock from falling further and becoming somewhat successful. This has resulted in a bullish market sentiment, making it an excellent time to look for buying opportunities.
How to trade a hammer?
The trade setup for the hammer candle is that we should go long if it occurs after a downtrend, entering at the closing price of the hammer and keeping the stop loss as low as the hammer.
- Entry: Enter a long position at the opening of the candle that forms after the hammer.
- Confirmation: A hammer is more reliable in a downtrend if the next candlestick shows a higher close, indicating a potential bullish reversal.
- Stop Loss: Place a stop loss below the low of the Hammer candle to limit potential losses if the trade goes against you.
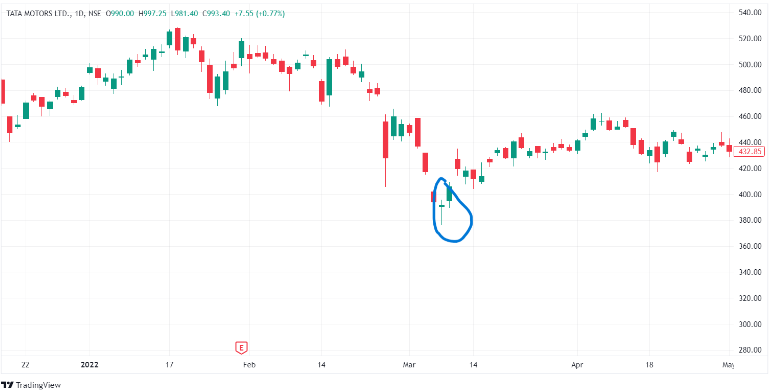
For instance in the chart of Tata Motors Ltd. below, the buying price is the closing of stock, at 391, and the stop loss is placed at 376. As the above candle has a slight upper wick, we can consider it as a hammer according to the second candlestick rule (be flexible). In the below trade, we would have been profitable.
Hanging Man
How does a hanging man form?
A hanging man is nothing but a hammer pattern appearing an uptrend. It is formed when
- The opening price is almost similar to the higher price,
- The closing price is nearly identical to the higher price,
- There is enough gap between the closing price (in case of bearish) or opening price (in case of bullish) and the candle’s low.
A hanging man signals a market high. The market is in an uptrend, signaling a bullish trend. The bears entered after the hanging man’s formation, depicted by a longer lower shadow. The entry of bears signifies that they are trying to break the stronghold of bulls. Forming after an uptrend, this candlestick pattern signals selling pressure.
A hanging man helps traders to set up directional trades. The color of the candlestick does not matter much, but the crucial thing we must consider is a shadow-to-accurate body ratio, where the length of the shadow should be at least double the size of the body.
Let’s look at the example of the hanging man below:
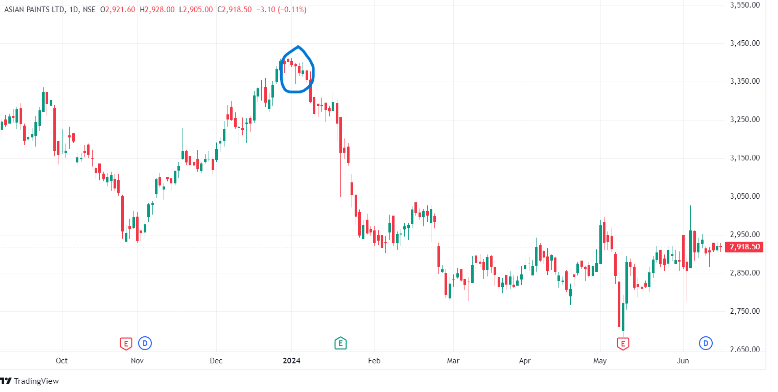
In the above chart of Asian Paints Ltd., a significant downfall can be seen after the occurrence of a hanging man.
How to trade a hanging man?
As a hanging man is a bearish reversal candlestick pattern, one should look for shorting opportunities in a particular stock or index. Wait for the formation of the closing of the hanging man candle.
- Entry point: You can create a short position at the opening of the candle after the hanging man
- Confirmation: Look for a bearish signal, like a gap down or lower close, after a significant uptrend and hammer pattern is formed, to ensure reliability
- Stop loss: Place a stop loss above the high of the hanging man to limit potential losses if the trade goes against you.
In the above chart of Asian Paints, the entry would be at 3396, and the stop loss would be the high of the candle at 3398.
Shooting Star
How does a shooting star form?
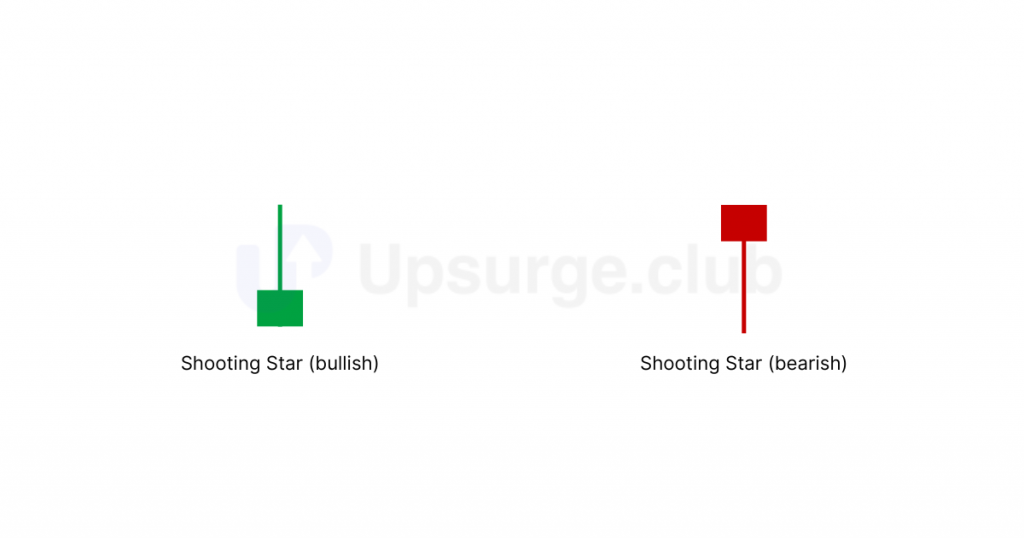
The shooting star is a candlestick pattern, indicating potential trend reversal. It has a long upper shadow where the shadow length is at least twice the length of the natural body.
- The opening price is almost equal to the closing price,
- The low of the candle is nearly equal to the closing price, and
- There is a significant gap between the closing price and the high of the candle
Though the color of the candlestick does not change its interpretation, it is comforting to know when a shooting star is bearish. Here is how it looks:
Let’s look at the pattern forming in a chart:
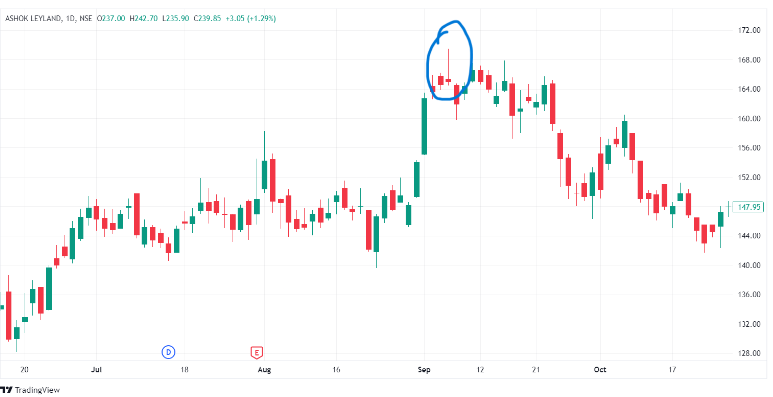
Here’s the logic for the shooting star candlestick pattern formation. The stock is in an uptrend, with bulls in control, making new highs and higher lows. On the day the shooting star pattern forms, the stock trades higher and creates a new high.
However, selling pressure at the high point causes the price to drop, closing near the day’s low and forming a shooting star. This indicates the bears have entered, successfully pushing prices down, as evidenced by the long upper shadow. The bears are expected to continue selling in the coming sessions, potentially reversing the uptrend.
The longer the upper wick, the more bearish the pattern. According to the textbook definition, the shooting star should not have a lower shadow. However, as the chart above shows, a small lower shadow is acceptable. The shooting star is a bearish pattern; hence, the prior trend should be bullish.
Here is another example of a shooting star forming on the chart of Cipla Ltd.:
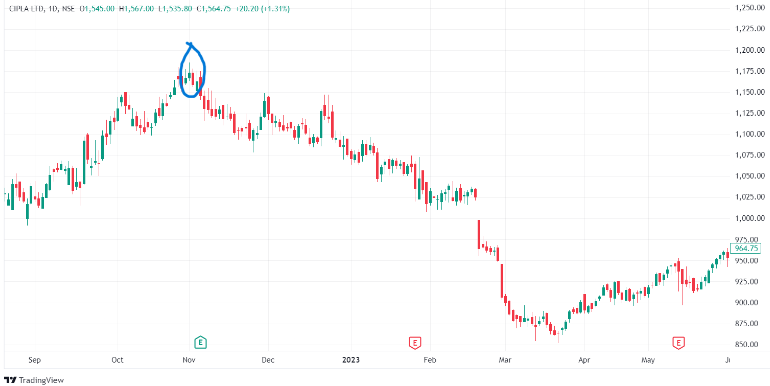
The highlighted candle has the following prices:
Open = 1167
High= 1185
Low=1167
Close=1173
The above candle qualifies as a shooting star since
- The prior trend is bullish
- The shadow-to-body ratio is 1.8 (~ 2)
How to trade a shooting star?
You should look for shorting opportunities when coming across shooting star candlestick patterns.
- Entry: Create a short position at the opening of the candle after the shooting star is formed
- Confirmation: A shooting star is confirmed if the next candlestick shows a lower close, indicating a potential bearish reversal.
- Stop loss: Place a stop loss at the high price of the shooting star candle to limit potential losses if the trade goes against you.
Inverted Hammer
How does an inverted hammer form?
The candlestick pattern is a shooting star formed at the bottom of a downtrend, signaling a bullish reversal.
An inverted hammer is formed when
- The opening price is almost equal to the closing price
- The low of the candle is nearly equal to the closing price, and
- There is a significant gap between the height of the candle and the close of the candle
Just like a hammer, the interpretation of this candlestick does not depend upon the candle’s color. But we have to look for a shadow-to-body ratio is double. This candlestick has a long upper shadow and no lower shadow.
The psychology of the inverted hammer shows a possible end to a downtrend, indicating that buyers are starting to take interest in the stock at lower prices. This means that after selling for a while, buyers step in and push the price up, forming a long upper shadow. Then, some selling happened again, bringing the price back near the opening level, creating a small body.
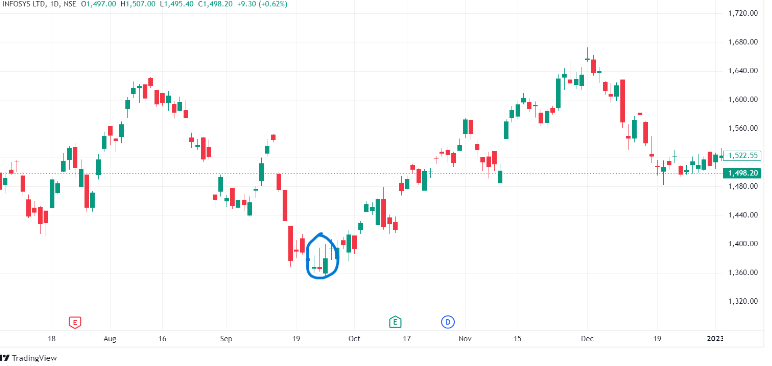
The below chart shows that Infosys’s inverted hammer took place at the end of the downtrend; after which the stock rallied significantly.
How to trade an inverted hammer?
An inverted hammer signifies an upcoming bullish trend. Here’s how a trade can be taken:
- Entry: Create a long position at the opening of the candle that forms after the inverted hammer.
- Confirmation: An inverted hammer is confirmed if the next candlestick shows a higher close, indicating a potential bullish reversal.
- Stop loss: Set a stop loss just below the low of the inverted hammer.
Let’s look at an example.
According to the rules, the trade setup for the above chart would be an entry at the closing of the inverted hammer at 398, and stop loss would be placed at the low of the candle at 392.
Target Setting for Single Candlestick Patterns
So far, we’ve explored the psychology behind single candlestick patterns and how to use them for entering trades. But have you ever thought about what our targets should be for these trades? Let’s dive into how we can set these targets strategically now.
To set a target, we need to know the risk-reward ratio concept.
The risk and reward ratio is a crucial concept in stock trading. It helps you understand how much you stand to gain compared to how much you might lose on each trade. This ratio can guide decisions to maximize profits and minimize losses.
Risk to Reward Ratio = Potential Gain / Potential Loss
If you buy a stock at a price of 100, and set a stop loss at 80, your potential loss (in case you hit the stop loss) is 20 (100 - 80). Similarly, if you set a target of 140, your potential gain (if you hit your target) is 40 (140 - 100).
Hence, the risk to reward ratio is 20:40, which can be written as 1:2.
We aim for a minimum risk-to-reward ratio of 1:1:5; let’s learn why.
Why Use the 1:1.5 Risk-to-Reward Ratio
The 1:1.5 risk-reward ratio means you aim to make 1.5 units of profit for every unit of risk. For example, if you risk ₹100 on a trade, your target profit is ₹150. This ensures your potential gains are more significant than your possible losses.
A key benefit is that it increases your chances of making a profit, even if not all trades are successful. With higher rewards for your risks, fewer winning trades can cover your losses and improve overall results. Setting a higher reward target keeps losses small compared to potential gains, which is crucial for long-term trading success. It helps you avoid significant losses that can impact your trading account.
Finally, the 1:1.5 risk-reward ratio offers a statistical advantage. Even if you win only 40% of your trades, this ratio can still lead to overall profits, making it an intelligent approach for trading in the volatile stock market.
Although it’s essential to choose a risk-reward ratio that matches your risk appetite, everyone’s comfort level with risk varies, so select a ratio that aligns with your individual trading goals and risk tolerance.
While knowing the 1:1.5 risk-reward ratio as a target is applicable, setting precise targets using a single candlestick pattern can be difficult. In the following chapters, we will discuss multiple candlestick patterns and indicators. These tools will help you set more effective targets and make better-informed trading decisions.
Let’s understand better with an example.
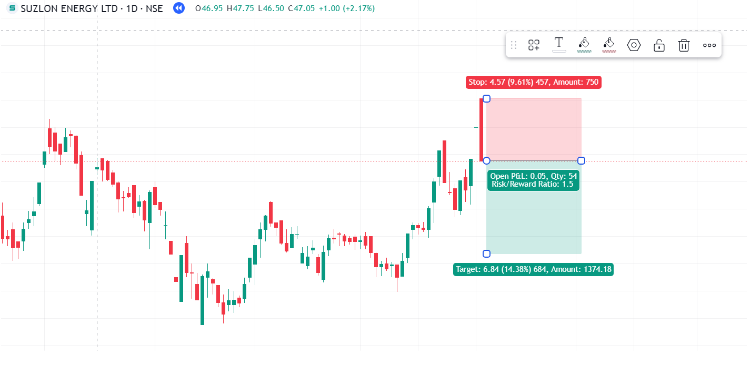
For instance, take Suzlon on a daily timeframe. It is forming a bearish marubozu angle candlestick. As we know, one should look for shorting opportunities because it signals bearishness. So we enter a short position at the closing of the candle, that is at 47.5, and we keep the stop loss at a high of the candle, which is at 52.40.
We now set a target of 40 so that Suzlon should go down by 7.5 points as our stop loss is approximately 4.5 points. In this way, we will have a risk of 5 in case it hits our stop loss and a reward of 6.8 points, maintaining the risk-to-reward of 1:1.5.
In the below image, you can see a short position on Suzlon’s stock, having a risk-to-reward ratio of 1:1.5:
Summary
- A hammer candlestick indicates a potential reversal from bearish to bullish sentiment. It is formed after a downtrend, with a small body at the upper end and a long lower shadow.
- The shooting star is a bearish candlestick that appears at the peak of an uptrend. It signals a potential bearish trend.
- The 1:1.5 risk-reward ratio helps ensure that your potential gains are greater than your losses, improving your trading results and protecting your capital.
- It’s difficult to set exact targets with single candlestick patterns alone, so we’ll examine more patterns and indicators for better accuracy.