Chapter 3: Big Bar Scalping Strategy
Overview
In scalping, the aim is to catch market trends fast, ride the momentum, and secure quick profits. This is especially important in options trading because a market that doesn’t move can lead to losses from time decay. This strategy focuses on capturing momentum in a specific stock or index to boost returns.
This is known as the “Big Bar Strategy’’, where we enter the market upon spotting a large candle. Since this strategy focuses primarily on options, we trade in highly liquid index stocks. The big bar strategy relies purely on price action without any specific indicators.
Price Action: Trend lines & levels
We determine entry and exit points in the big bar strategy using only support, resistance, and trend lines. Understanding these elements makes it easier to find reliable signals. Here’s an overview of each:
- Support: This is the stock price level where buying interest increases, preventing further price decline. It provides ideal entry points in a down-trending market.
- Resistance: A particular price level marks where a stock’s upward movement slows or reverses, typically as market participants perceive it as overvalued or due to other factors influencing sentiment.
- Trendline: A trend line is a straight line drawn on a chart to connect two or more price points, showing the overall direction of a stock’s movement. Whether upward, downward, or sideways.
Learn more about support, resistance, and trend lines in detail here.
3.3 Spotting an entry
Since options are involved, selecting the right strike price is crucial. Here is a table summarizing the weekly expiry days for significant indices in India.
Index | Weekly Expiry Day |
Nifty 50 | Thursday |
Bank Nifty | Wednesday |
Nifty Financial Services | Tuesday |
Spotting entries just after the weekly expiry is ideal, as options generally have lower premiums, and market direction is often more precise with reduced volatility. We use a 5-minute time frame here, ensuring sufficient liquidity in the index.
After the weekly expiry, we select OTM (Out of The Money) or ATM (At The Money) strike prices for options, as they are more sensitive to changes in the underlying asset and can yield quick gains. This approach gives option buyers sufficient time to benefit. However, as expiry nears, we prefer ITM (In The Money) options for entries, as they carry less risk and provide a better chance of profit.
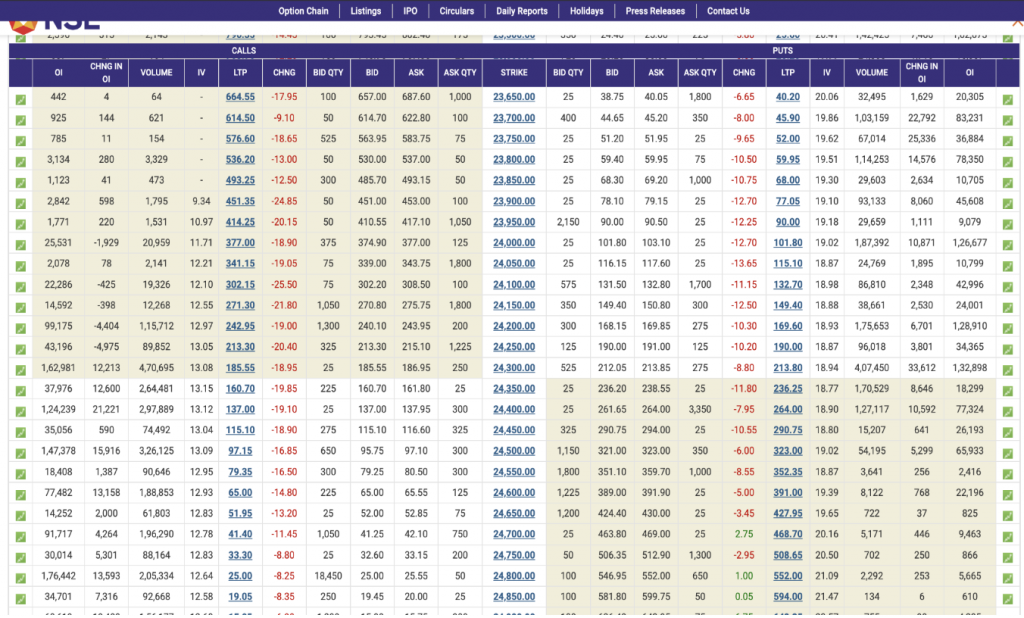
For instance, if we are trading in Nifty50 with a weekly expiry on Thursday, we begin searching for entries from Friday onwards. Below is an image of the Nifty option chain, whose current value is 24,304 (as of 2nd November 2024). The ATM strike option from the OI (Open Interest) chain is 24,300, with multiple OTM and ITM strikes available. With four more trading sessions before expiry, we will choose either the ATM strike or a nearby ITM strike for better positioning.
If we’re bullish on this strategy, we can choose the 24,300 ATM strike or go slightly more profound with a 24,100 ITM strike. Selecting the ATM or a lower ITM strike depends on individual risk appetite and predictions for Nifty’s movement.
Now, let’s find an entry using the big bar strategy. Here are the conditions for a long entry:
- The first step is to identify at least 4-5 candlesticks moving sideways within 30-35 points.
- The next step is to look for a big candlestick that engulfs these uncertain, sideways candles.
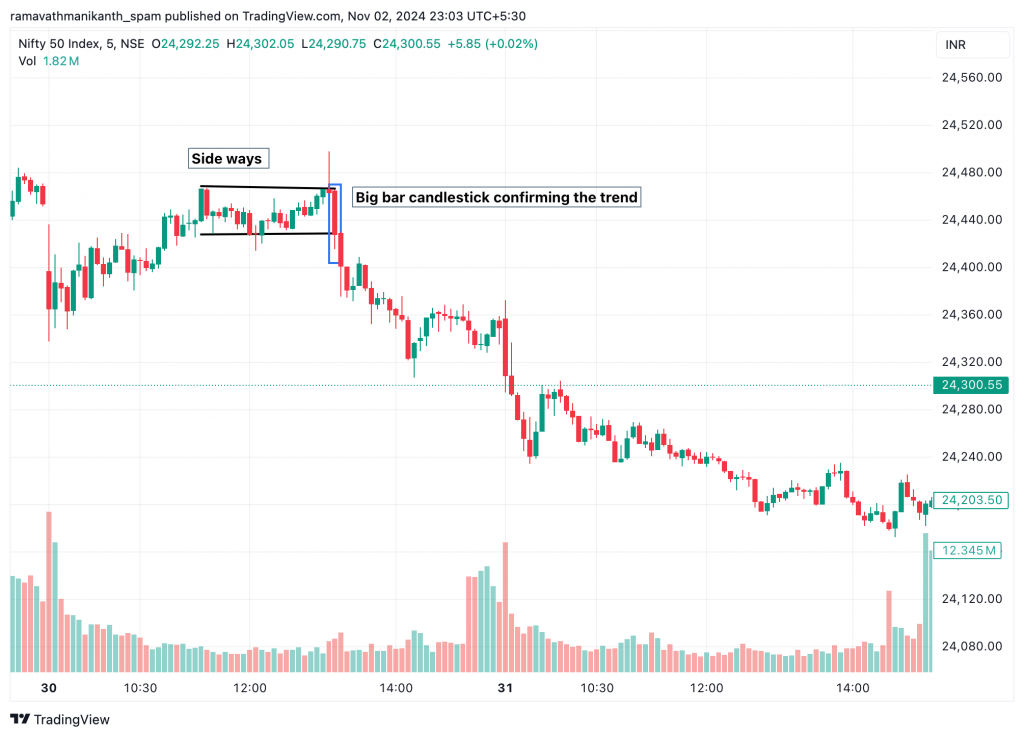
Exactly. We enter the trade by setting the high of the breakout candlestick as our entry point. For this strategy to work effectively, the market should remain in a sideways range for at least 30-40 minutes. A big candlestick confirms the direction, indicating that the index is likely moving with clear momentum.
This strategy becomes more apparent with an example. Below is a 5-minute chart of Nifty50. The black highlighted box shows the sideways movement, while the red highlighted candlesticks confirm the downward trend. Here, we’ve spotted an entry at the low of the breakout candlestick, indicating a potential downward move.
Planning the exit
In this strategy, planning exits is just as crucial as timing entries, so setting predefined targets is essential. We can book profits partially while keeping positions open. Here are some pointers for booking profits by trailing stop losses:
- The first step is to book 50-70% of our profits once we achieve a risk-to-reward ratio of at least 1:1.5. For example, if we have a stop loss of 30 points, we set the exit target at 45 points to capture sufficient gains.
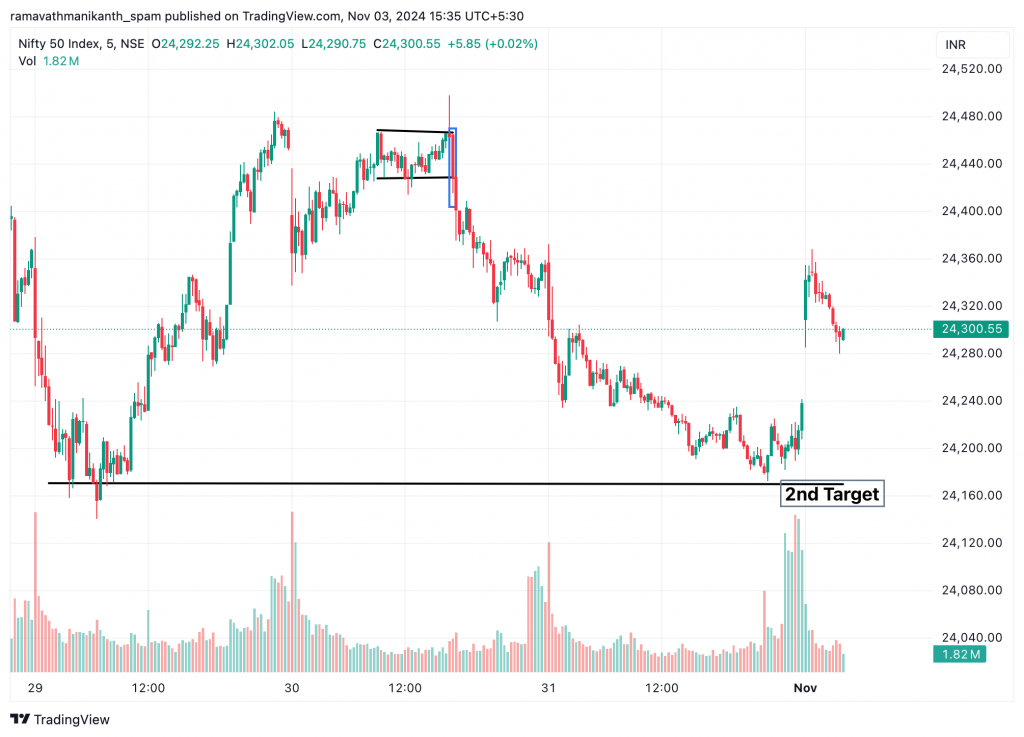
- We can set the exit for the remaining capital at the previous day’s OHLC level. This acts as a safeguard, as there’s a higher chance of the market reversing. Booking remaining profits at this level helps lock in gains while minimizing risk.
Don’t forget to trail your stop loss after reaching the first target. This step minimizes risk and provides an opportunity to secure additional profits as the trade progresses, even if the market doesn’t get the final target.
Now, let’s see the same Nifty50 example exit.
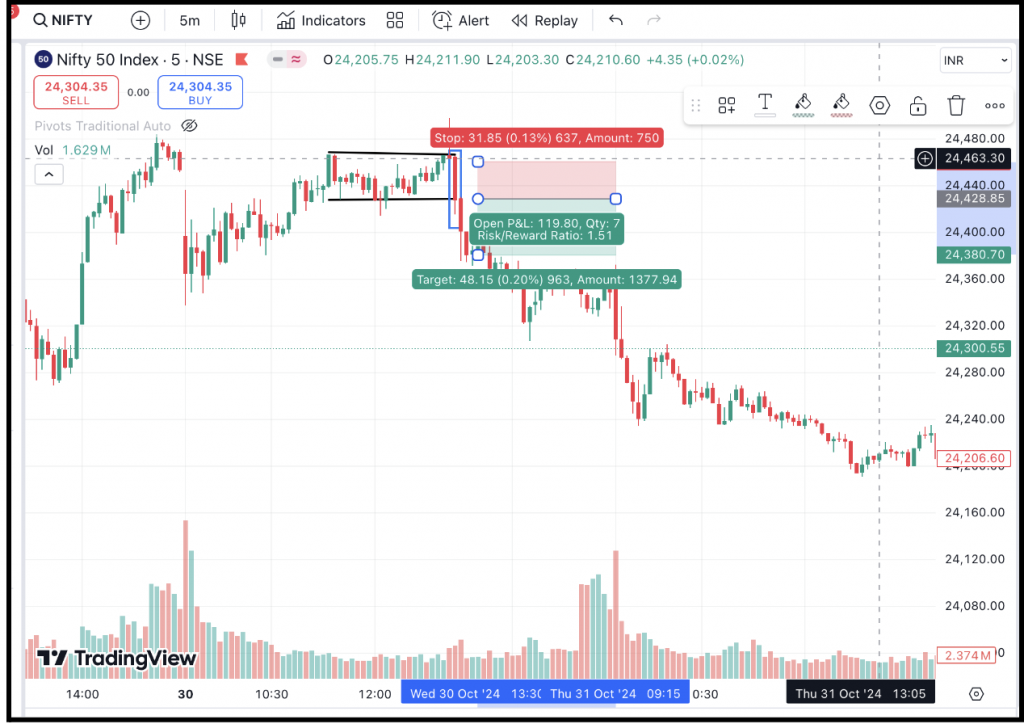
The chart above shows our first target set at a 1:1.5 risk-to-reward ratio. After booking profits at this level, the second target is ideally the previous day’s low, as we are in a short position.
The chart below illustrates this second target level, showing how we aim to maximize gains if the market continues downward.
Stop loss
Sometimes, the big bar strategy can result in false breakouts, often due to systematic risks in the market. To protect against losses, it’s essential to set a stop loss. For the big bar strategy, we can put our stop loss in two ways:
- We can also use a traditional approach by setting a 30-point stop loss from the entry point. This stop-loss level can be adjusted based on the trader’s risk appetite.
- Another way to set our stop loss is by identifying the swing low for a long trade or the swing high for a short trade. Using this exact level as the stop loss aligns with recent price action, providing a logical exit if the market reverses beyond these critical points.
Swing low and high are set as stop losses because they often act as natural support and resistance levels, where buying or selling pressure is likely to emerge.
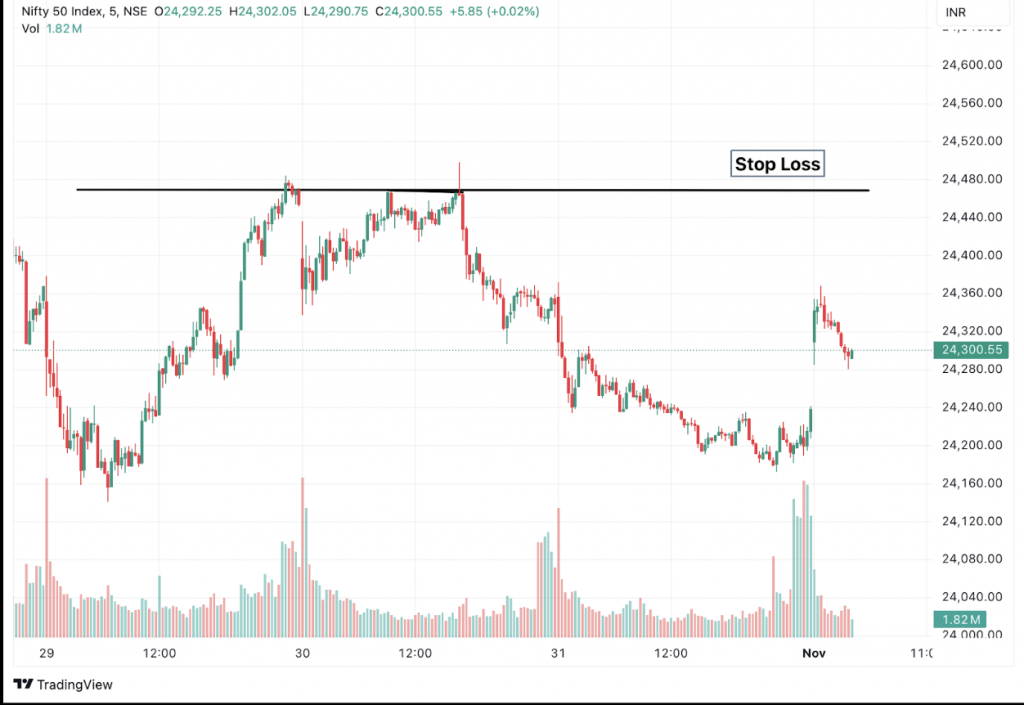
In this example, as a short trader, we can set the stop loss using both the risk-to-reward ratio and the swing high level. This means placing the stop loss at the recent swing high while ensuring the target aligns with a 1:1.5 risk-to-reward ratio.
Here is a pictorial representation of it:
Examples
Now, let’s explore some examples of applying the big bar strategy to Bank Nifty! Start by setting the chart to a 5-minute time frame and look for entry signals.
Identify a range where there’s an apparent struggle between bullish and bearish forces, often leading to indecisive candlesticks like doji or spinning tops.
The chart below shows several indecisive candles, followed by a big green candlestick, such as a bullish marubozu. This strong, decisive candle confirms direction, and we open a long trade precisely at the close of this candle.
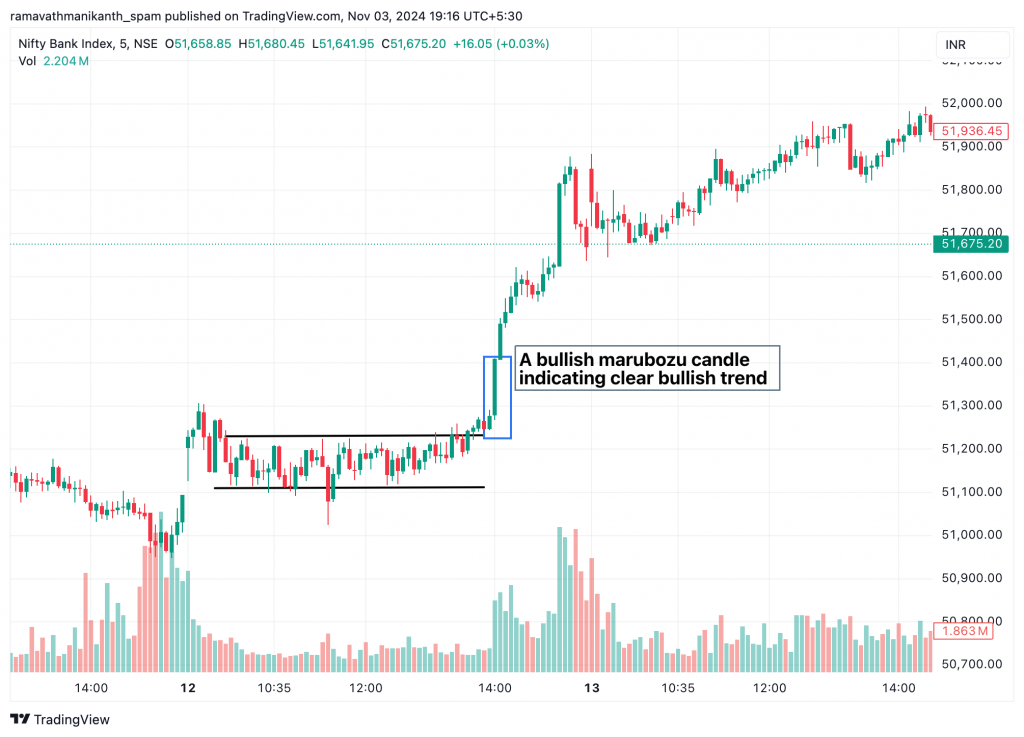
For this position in Bank Nifty, we set the stop loss based on a risk-to-reward ratio. Specifically, we place the stop loss at the exact low of the range, treating it as support since several candlesticks are within that range.
With the entry at the high of the big candlestick, we set our first target according to a 1:1.5 risk-to-reward ratio, aiming for a balanced and achievable profit level while managing risk effectively.
The image below shows the entry point, stop loss, and first target for our position.
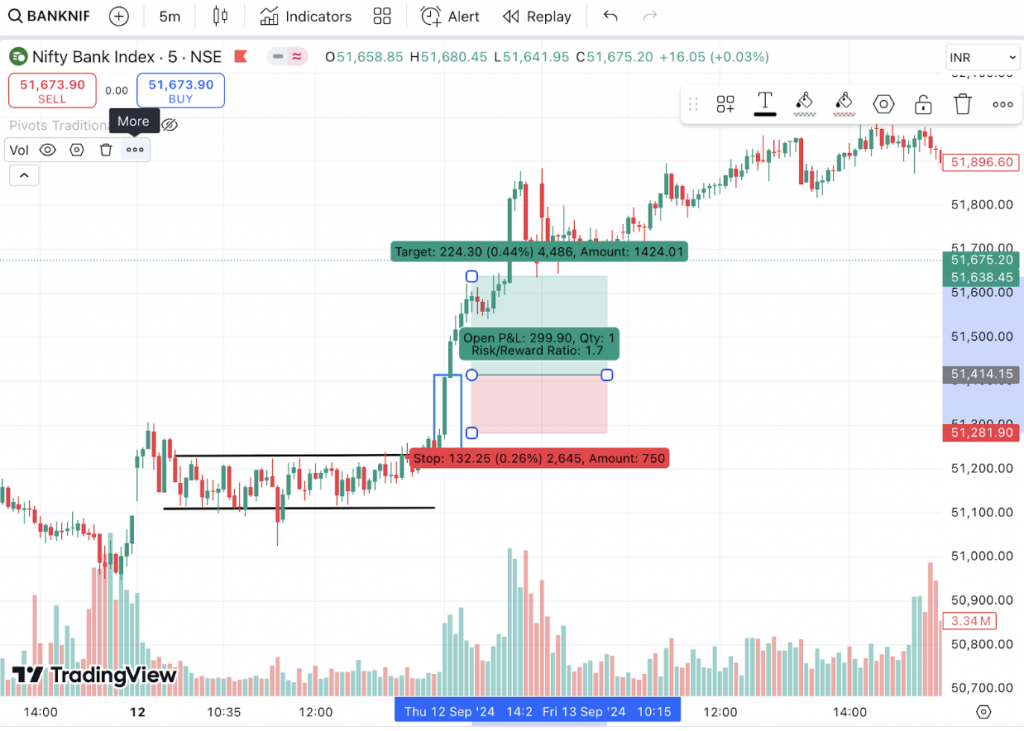
After booking our first profits, we can set the next target at the high on the previous day. If a clear swing low isn’t available, we can use a higher risk-to-reward ratio, like 1:2 or more, based on our risk tolerance. Additionally, we should trail our stop losses as we book further profits, helping to lock in gains while allowing for more potential upside.

This strategy has achieved a 1:2 risk-to-reward ratio, as shown in the image above.
Things To Remember
There are a few key points to remember when confidently trading this strategy and keeping risks in check. Let’s dive into the essentials to boost your trading game and protect your capital!
- When identifying entries in any index, ensure that at least 5-8 candlesticks are consolidated. The longer the sideways movement, the stronger the potential breakout, with a lower chance of a false breakout.
- Sometimes, even when our strategy aligns perfectly, large institutional players can trigger stop losses before the market moves as expected. To avoid this, set your stop loss slightly below (or above, for shorts) the usual level, adding a buffer against these stop-hunting moves.
- For the big bar strategy, use bullish marubozu or engulfing patterns for long trades and bearish marubozu or engulfing patterns for shorts. These candlestick patterns help reduce false breakouts, making entries reliable.
- When considering an entry, keep an eye on trading volumes. Ensure that the volume bar is at least 60% above the moving average volume.
- After we get the hang of this strategy on major indexes like Nifty and Bank Nifty, we can try it out on highly liquid stocks, such as Reliance.