Chapter 6: High Probability Scalping Strategy
Overview
Scalping is all about taking minimal risks, securing profits quickly, and exiting as soon as our targets are met. The core strategy revolves around keeping risk low and setting modest profit goals. Scalping works best with highly liquid instruments like Bank Nifty and Nifty, and that’s exactly what we’ll be trading here in a short 5-minute timeframe.
We’ll use three key indicators to make this a high-probability strategy: EMA, William Fractals Indicator, and VWAP. For added confidence, we’ll use EMA on two different timeframes. This combination helps in better decision-making and reduces uncertainty.
The plan is to buy at-the-money calls and put options in place to capture profits. These indicators will determine our stop loss, ensuring a disciplined approach to minimize losses. This way, we keep the strategy simple, effective and focused on quick, precise trades.
Indicators used in this strategy
In this high-probability strategy, we will see a new indicator, William Fractals, and other almost-known indicators in the stock market, such as the EMA and VWAP. Here, we will see a brief overview of each indicator to understand the crux of this strategy.
William Fractals indicator
This indicator is based on the price action that suggests potential reversal points in the market. These patterns are based on a series of candlesticks or bars, typically five in total.
A fractal is calculated based on the high/low of the preceding and succeeding candlesticks/bars, A arrow mark type is formed that is nothing but a fractal.
So first, we identify the market trend, whether it’s bullish or bearish. Then, we use the fractal indicator to refine our entries. Below are the conditions for bullish and bearish entry:
- Bullish entry with fractal: To enter a long position, wait for the price to break above the most recent up fractal during an uptrend.
- Bearish entry with fractal: Enter a short position when the price breaks below the most recent down fractal during a downtrend.
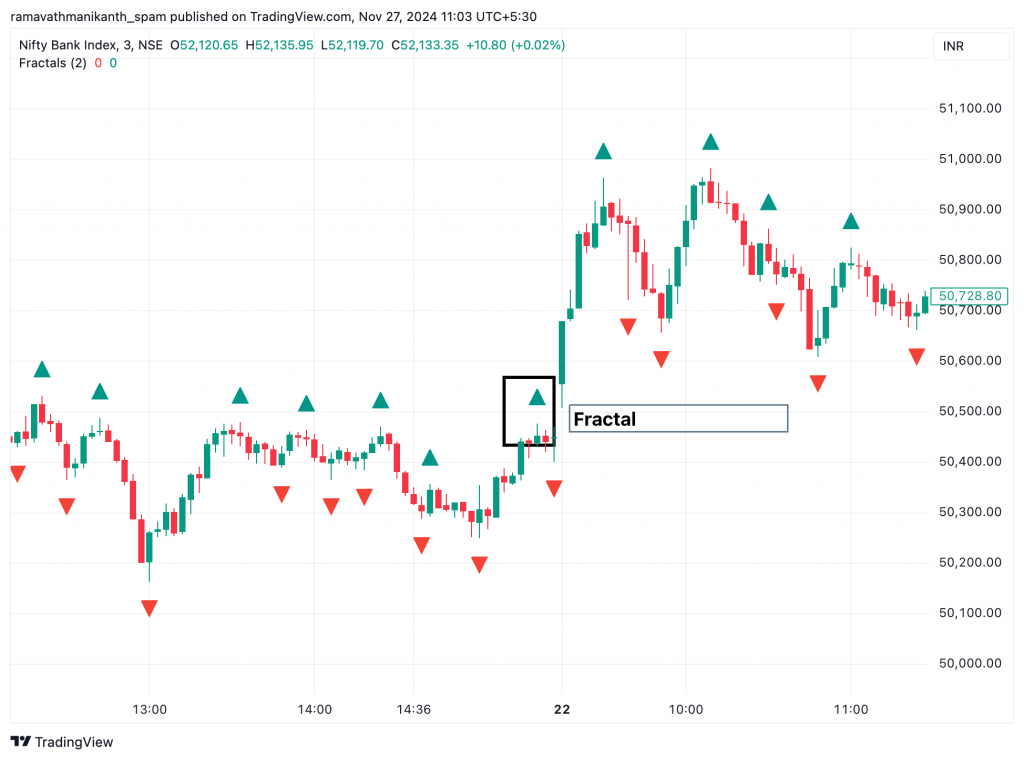
In the image above, the triangles represent fractals, which are used as the basis for identifying trade opportunities.
The other elements shown are popular indicators: the exponential moving average (EMA) and the volume-weighted average pierce(VWAP). We briefly review these indicators to provide additional context.
- Unlike the simple moving average, the EMA gives more weight to recent price changes, making it more responsive to current market conditions.
EMA_today=(Pricetoday×K)+(EMA_yesterday×(1−K)) K=smoothing constant
More in-depth explanation about EMA here
- VWAP (Volume Weighted Average Price) shows an asset’s average price for the day, weighted by volume, highlighting fair value levels and prioritizing high-volume prices.
VWAP = (Sum of (Price × Volume)) / (Sum of Volume)
Check out VWAP here.
Spotting an entry
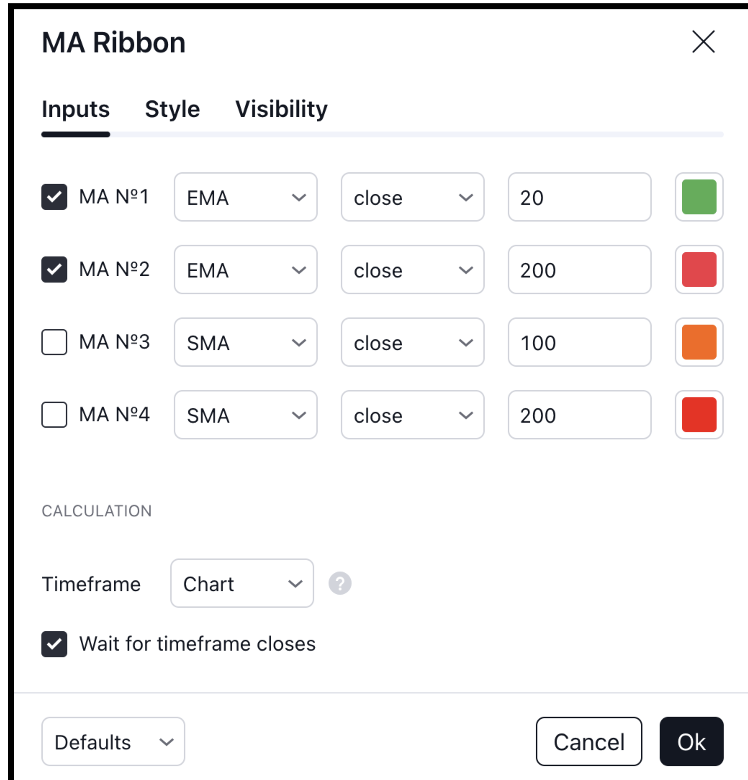
For this high-probability scalping strategy, we identify trading opportunities in a 5-minute timeframe and focus exclusively on highly liquid indices like Nifty and Bank Nifty. The strategy determines the trend direction using emas on two different timeframes. To implement this on TradingView, we use the moving average ribbon indicator and customize the settings as needed. Below is a snapshot of the moving average indicator settings for reference.
Long entry
Now, we will also set up the VWAP and Williams fractals on the chart. Since we are trading in indices, we trade the ATM (at-the-money) options to capture the momentum. Here are the conditions for a bullish entry with this strategy:
- The 20 EMA is above the 200 EMA
- The price is trading above the VWAP
- A bullish fractal (a green-up fractal) is broken by a candlestick closing above its high.
Here, we confirm the trend using emas. Generally, if the price is above 200 ema, it indicates bullishness. Additionally, if the price is also above the 20 ema, it suggests strong short-term bullishness. While it is not mandatory for the price to be above the 20 ema to go long, it adds confidence when taking a trade.
When the price is trading above the VWAP, it indicates that buyers are dominating and are willing to pay higher than the average price, signaling bullish momentum. In the stock market, institutional players often view VWAP as a fair value. If the price is above it, the market is generally considered bullish.
The breakout of the Williams fractal indicator suggests that the uptrend is resuming with strength, as market participants are confident enough to push the price past previous highs. This also confirms bullish momentum, making it a favorable entry point.
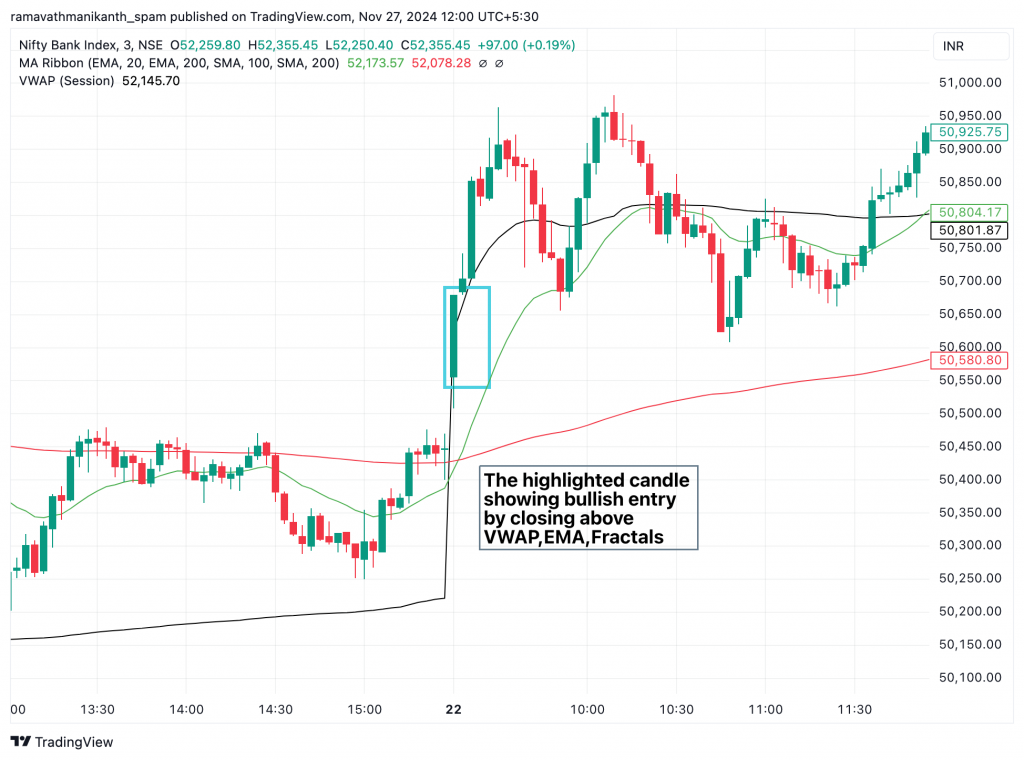
The image above provides a visual representation of a bullish signal. The highlighted candlestick breaks the previous fractals, indicating bullish momentum.
Short entry
For the bearish entry, that is almost the opposite of the bullish entry conditions. Here is the checklist for the bearish conditions:
- The 20 EMA is below the 200 EMA.
- The price is trading below the VWAP.
- A bearish fractal (a red-down fractal) is broken by a candlestick closing below its low.
Planning the exit
When we are scalping, precise and disciplined exits are critical to locking in profits and minimizing losses. In this strategy, our exit conditions are designed to match the high-probability nature of our entries. Here’s how we plan our exits:
First, we set a profit target using a risk-to-reward ratio, which depends on each trader’s risk appetite. For beginners, a minimum ratio of 1:2 is recommended. Since this scalping strategy focuses on capturing quick, small moves, it’s practical to target a fixed number of points when trading indices, typically 30-50 points based on market volatility.
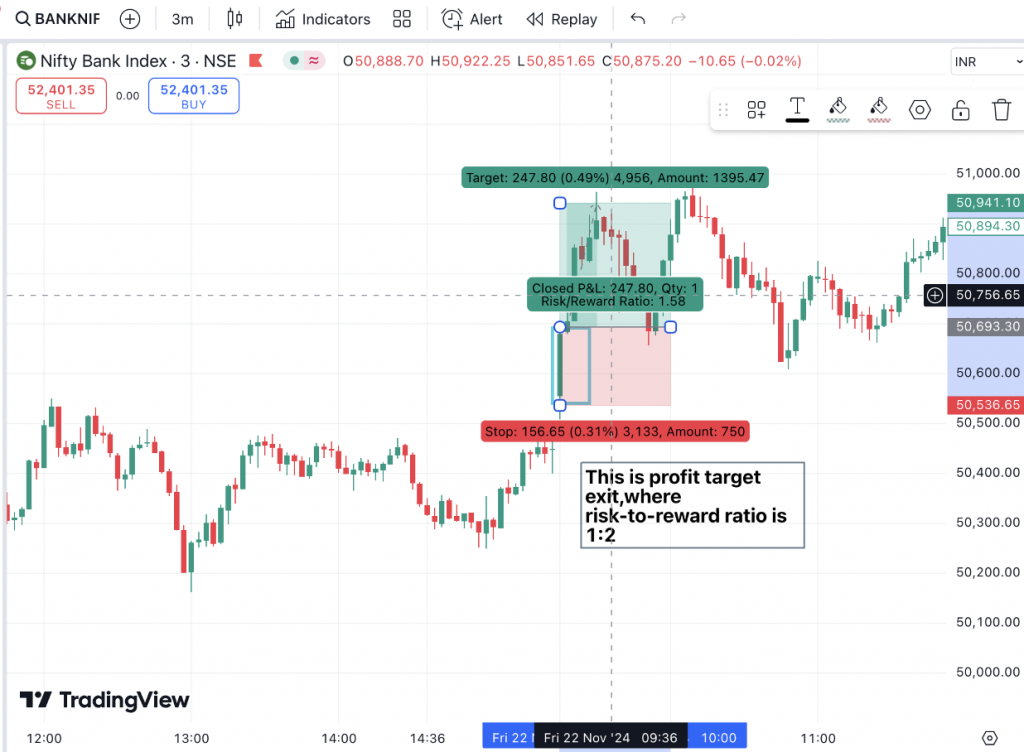
When we identify highly favourable trades, such as when the price is trading above the 20 EMA and VWAP, we can aim for a 1:5 risk-to-reward ratio. In such cases, it’s crucial to book profits promptly once the target is achieved.
The second type of exit is based on indicators like VWAP and EMA. If a long position is taken and the price trades above only one indicator (either EMA or VWAP), the other indicator can serve as the exit point.
This approach is particularly suitable for sideways or choppy markets, where price fluctuations are common. Exiting when the price falls below one of the indicators helps secure small profits or minimize losses before a potential market reversal.
Stop loss
With exits planned, we now focus on stop-loss placement. Let’s use our indicators to limit risk and keep the strategy effective smartly.
We can keep the stop loss based on the William Fractal indicator below the most recent fractal (for longs) or above it (for shorts) or using VWAP as a dynamic invalidation level; we ensure our risk remains aligned with the strategy’s precision.
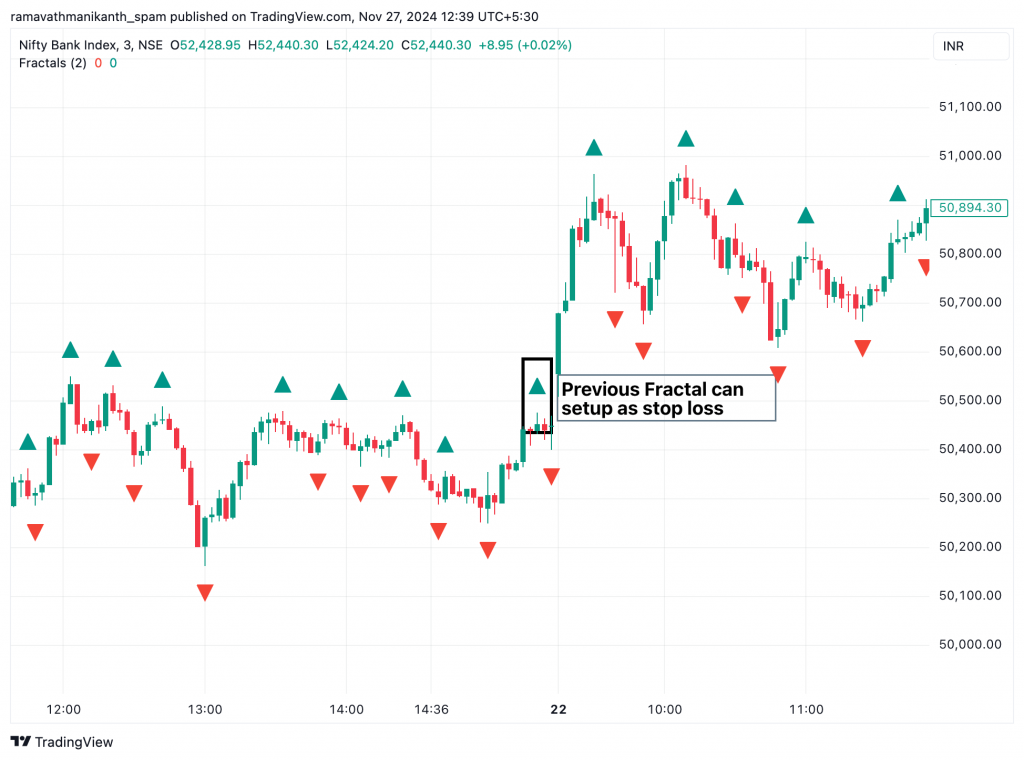
Another approach is to exit based on the risk-to-reward ratio, which depends on the trader’s risk appetite and the favorability of the trade. The ratio can be set to 1:2, 1:3, or even 1:5, depending on the market conditions and the confidence in the trade setup.
Example
Let’s explore specific examples in Nifty to see how these indicators align to create high-probability setups. In the chart below, the price is already trading above both the 20 EMA and 200 EMA, confirming a bullish trend and setting the stage for a potential trade entry.
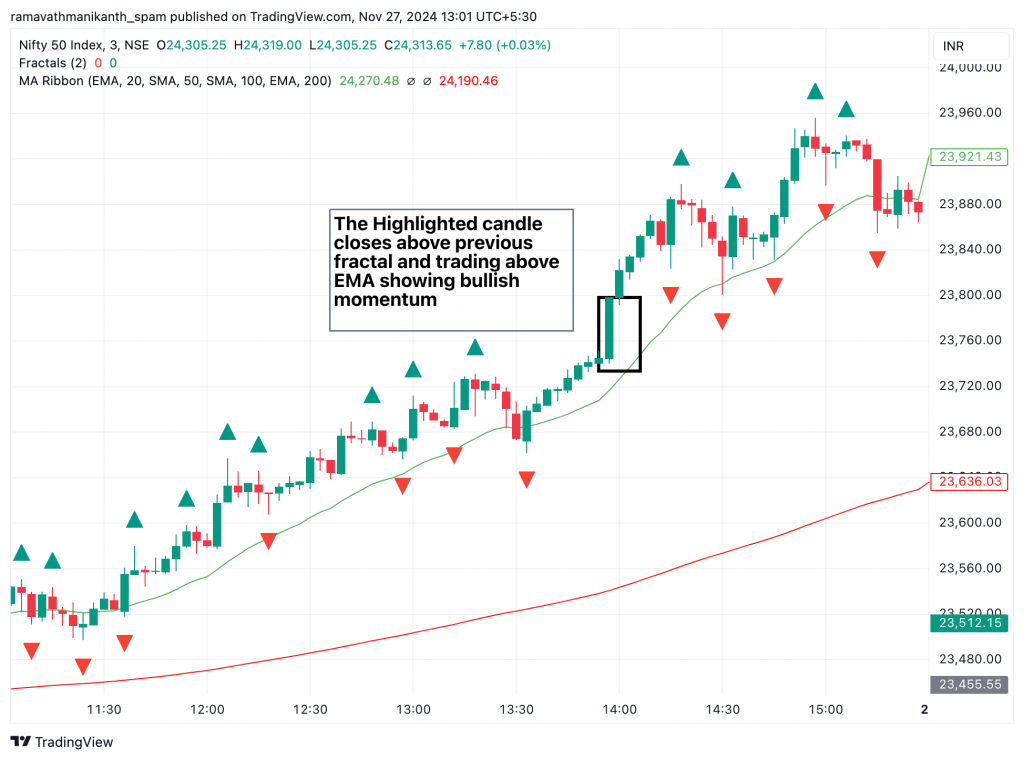
The formation of a bullish marubozu breaking the previous fractal indicates bullish solid momentum. Additionally, the candlestick trading above the VWAP reinforces the bullish sentiment. The entry signal is confirmed when the candlestick closes above the previous Williams fractal, signalling a favourable trade setup.
We would enter the trade immediately after the candlestick closes and confirms the signal, buying an ATM or nearby ATM option to capitalize on the potential profit.
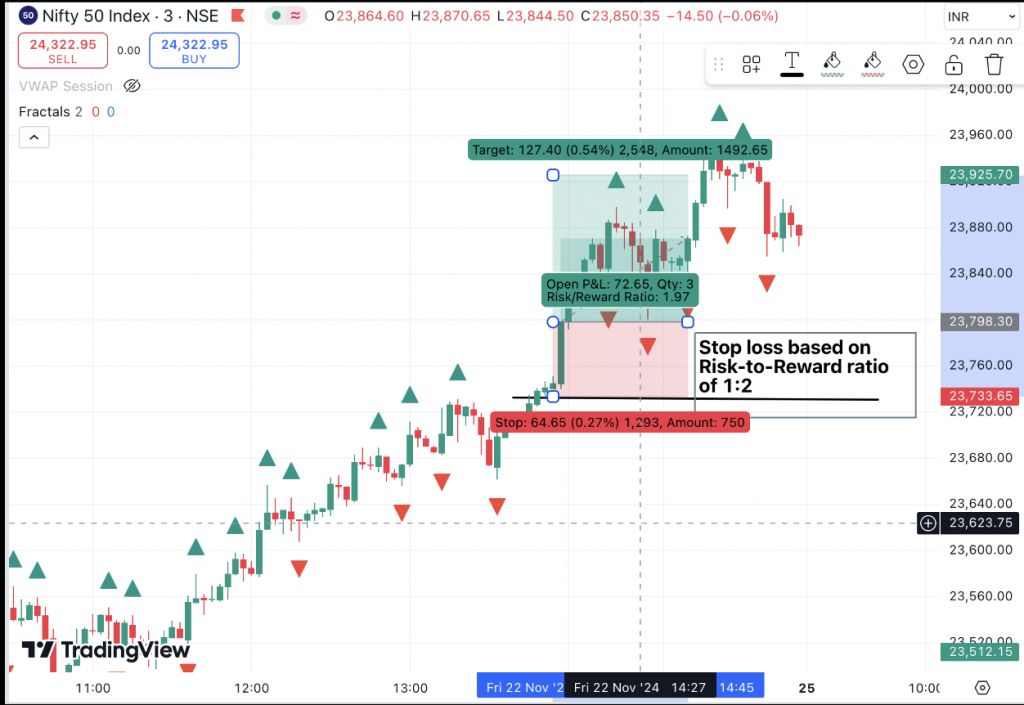
The stop loss for this trade setup can be placed at the previous Williams fractal or determined based on a profit target using a risk-to-reward ratio of 1:2 or 1:5, depending on the trade’s favorability. Below is a visual representation of the stop loss placement.
Things To Remember
- When setting a target, ensure a 40-50 point gap between entry and target to account for meaningful profit potential.
- Take a trade only if EMA alignment, VWAP position, and fractal breakout all lineup. This ensures you’re trading with a clear trend and strong momentum.
- If the 20 EMA and 200 EMA are flat or crossing each other, skip the trade.
- When the price breaks a fractal, check if it happens with high volume. Weak volume breakouts are unreliable and often fail.
- If the price returns to VWAP after you enter a trade and doesn’t bounce (for a long) or reject (for a short), consider exiting early to avoid losses.