Chapter 2: Reversal Scalping Strategy
Overview
Scalping offers a fast way to earn in the stock market, but success hinges on effectively spotting trend reversals or following trends. Finding a strategy that aligns with our style is crucial, as profits can come from catching trends or reversals, primarily influenced by our trading mindset and approach.
This chapter’ll cover a scalping strategy focused on seizing market reversals. We’ll use two technical indicators: Williams %R, which identifies overbought and oversold market conditions, and the exponential moving average to guide entry and exit points.
This disciplined, quick-response strategy is well-suited for liquid indexes and can be adapted by adjusting settings or using alternative indicators like stochastic RSI.
Ready to dive in? Let’s go!
Indicators used in this strategy
William %R and Exponential Moving Average(EMA) perfectly fit the scalping strategy because the combination of these can provide quick signals in fast-moving markets; here is a brief overview of each one:
- Williams %R: This momentum indicator helps identify overbought and oversold conditions in a stock or index. It can be used to time entries when the market shows signs of reversal. Williams %R is expressed as a percentage, where a reading of -80 or lower suggests the stock is oversold, and a reading of -20 or higher indicates it is overbought.
- Exponential Moving Average: One of the fundamental yet powerful indicators in the market, this gives weightage to recent price changes in assets. In this scalping strategy, this signals entry and exit points.
EMA_today=(Pricetoday×K)+(EMA_yesterday×(1−K)) K=smoothing constant
More in-depth explanation about EMA here.
Spotting an entry
Markets move in cycles, rising before reversing or falling before rebounding. As scalpers, identifying a profitable reversal is key. If we spot a promising opportunity, we can take a position. This strategy focuses on catching major market reversals for potential profits.
For this strategy, we set a predefined rule to help us determine if a stock has made a sharp move up or down. This is where the technical indicator Williams %R becomes useful. While the Relative Strength Index (RSI) can also be used, RSI tends to show dips even when there are slight declines, which might not be as effective in spotting more significant reversals.
Below is the chart of the Nifty50 time frame of 15-minute candlesticks with RSI technical indicator:
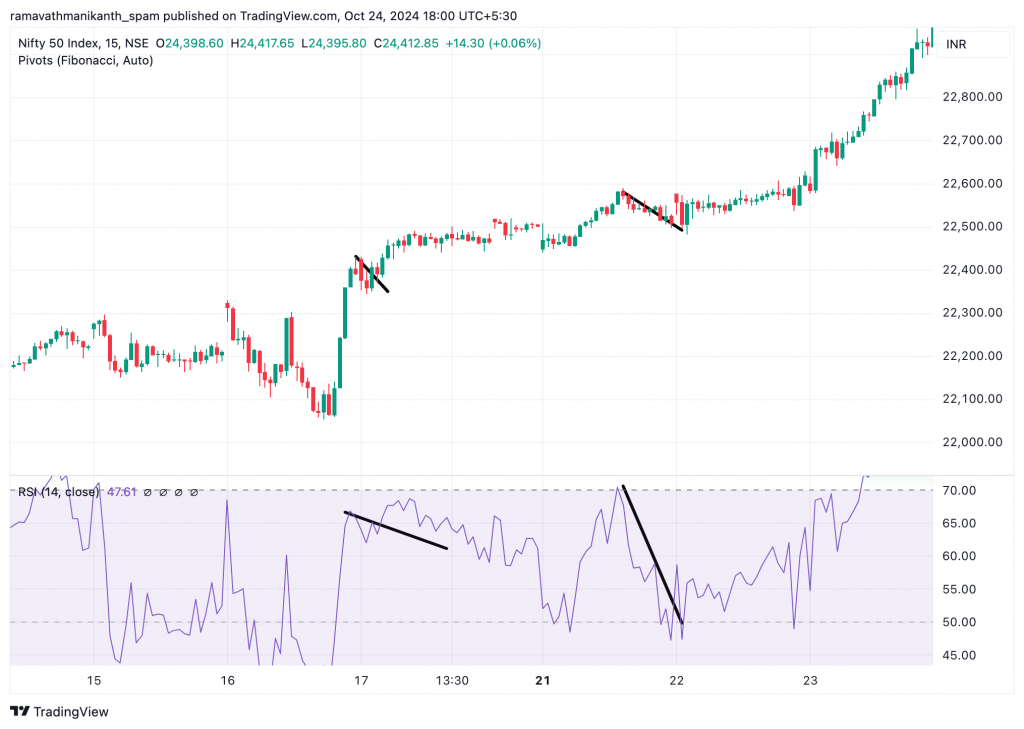
The above chart shows that while the market is moving up, the RSI is still showing dips. This isn’t ideal because we want an indicator that only dips when the stock or index is moving downward.
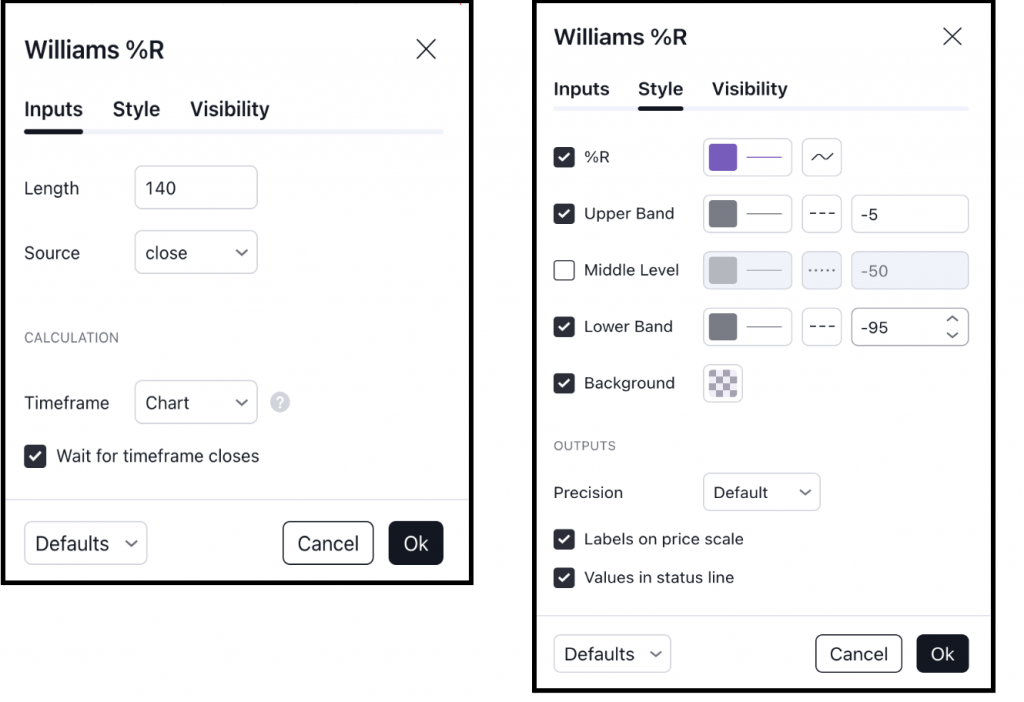
To overcome this, instead of using the RSI indicator, we will apply the Williams %R indicator. We can smooth the Williams %R by adjusting its inputs to make it more reliable. The default setting is 14, but we will change it to 140 for this strategy. This adjustment helps filter out small fluctuations and focus on significant market movements.
We will adjust the settings of the Williams %R technical indicator by modifying the overbought and oversold levels. The upper limit will be changed to -5 and the lower limit to -95. This adjustment will widen the range, making the overbought zone “deep overbought” and the oversold zone “deep oversold.”Here is a snapshot of the William%R indicator.
First, we will apply this strategy in the 15-minute timeframe to understand the market conditions, particularly the overbought and oversold zones. When the Williams %R indicator moves above the -20 line, the stock or index is in the overbought zone. When it goes below the -80 line, it signals that the stock or index is in the oversold zone.
If the stock or index is in the overbought zone, we will look for a short signal, and if it is in the oversold zone, we will look for a long signal. After identifying these signals on the 15-minute chart, we will refine our entries by shifting to a lower timeframe, such as the 1-minute or 2-minute chart, to time our trades precisely.
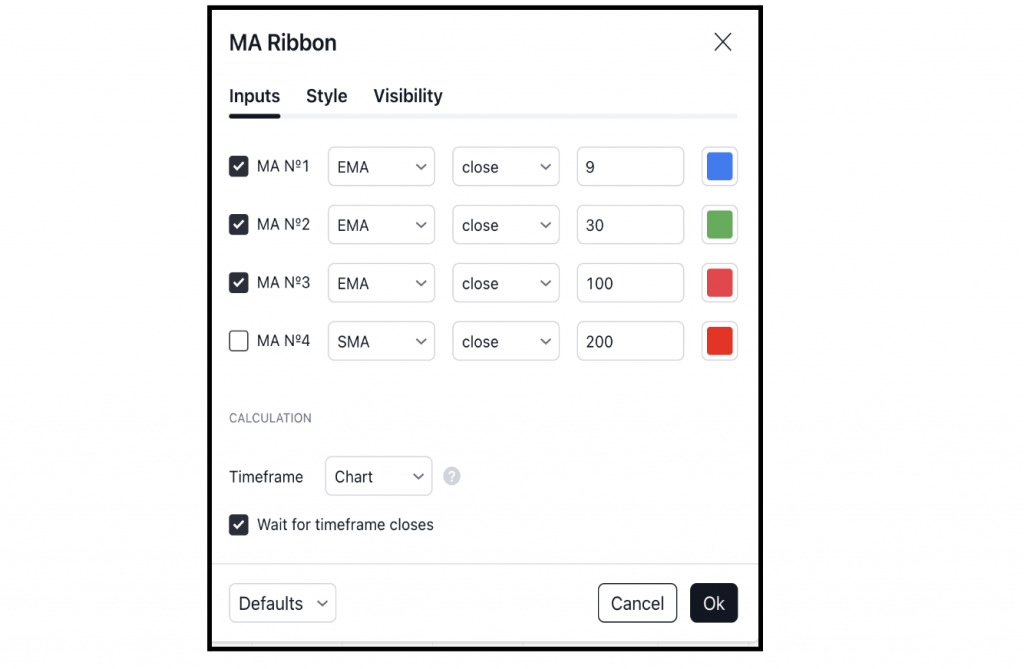
Here, we use a moving average ribbon and set up the indicator; we will change simple moving averages to EMA’s. The frame of the first line is 9, the second is 30, and this one is 100 to capture multiple trends and get quicker reactions to price changes. For better visibility, we change the color of the moving averages. Below is the picture
Long Trade Entry
- First, we will assess the market stance using the Williams %R technical indicator. If the value falls below -95, we consider it to be in the oversold zone, indicating a potential buying opportunity as the stock may be ready for a reversal.
- A potential entry signal is confirmed when the shorter moving average, EMA (9), and the medium-term average, EMA (30), crosses above the longer-term moving average, EMA (100).
This crossover signals a possible upward trend, giving us a more reliable entry point into the trade.
Short Trade Entry
We will first look at the Williams %R for a short entry to see if the stock or index is in the overbought zone. A potential short entry is triggered when the longer-term moving average, EMA (100), crosses below the medium-term EMA (30) and the shorter-term moving average, EMA (9).
Let’s look at an example to help us understand. We apply these indicators on the Nifty50 index on a 1-minute time frame chart.
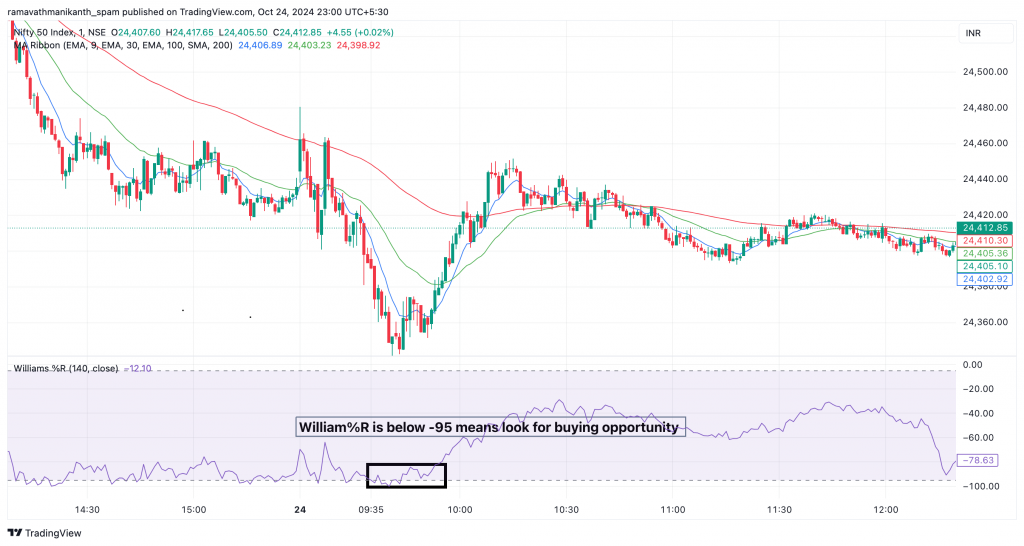
The above chart shows the Williams %R technical indicator, which shows the stock or index in the oversold zone, below the -95 level. This indicates a potential buying opportunity.
From the signal indicating the oversold zone through the Williams %R technical indicator, our next step is to confirm an entry using the EMAs.
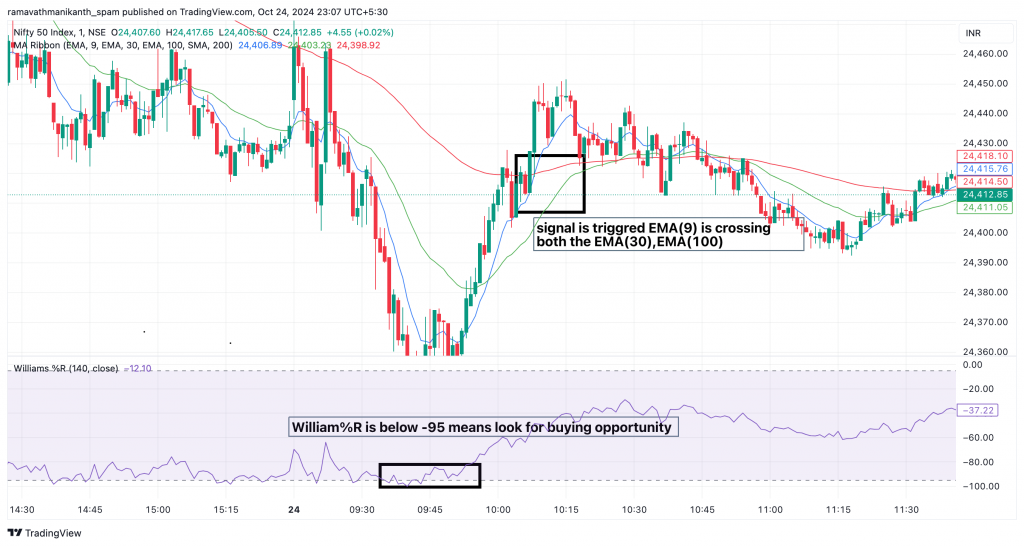
Next, as highlighted in the box, we see the blue line EMA(9) crossing above both the green line EMA(30) and red line EMA(100). This confirms the upward trend, and we quickly take our position to scalp the trade, aiming to capture profits from the reversal.
Planning the exit
Now, we will look at how to plan our exit. In scalping, exit strategies are just as crucial as entry points, if not more, because we are trading within minimal time frames. A delayed exit can turn a profitable trade into a loss in just a few seconds. So we have to lock our profits quickly.
Long Trade Exit
When holding a long position, we must exit once we lose bullish momentum. To identify this, we set our exit signal when the longer-term moving average, EMA (100), crosses below both the medium-term EMA (30) and the shorter-term EMA (9). This crossover signals a potential shift in momentum, indicating it’s time to exit the position and protect our gains.
Exit is for a long positon is triggered when EMA(100)>EMA(30)>EMA(9)
Short Trade Exit
Conversely, for a short trade, the opposite applies. The exit signal is triggered when the shorter-term moving average, EMA (9), crosses above the medium-term EMA (30) and the longer-term EMA (100).signaling uptrend in the amr
Exit for a short position is triggered when EMA(9)>EMA(30)>EMA(100)
Let’s continue with the previous example that was discussed in the entry.
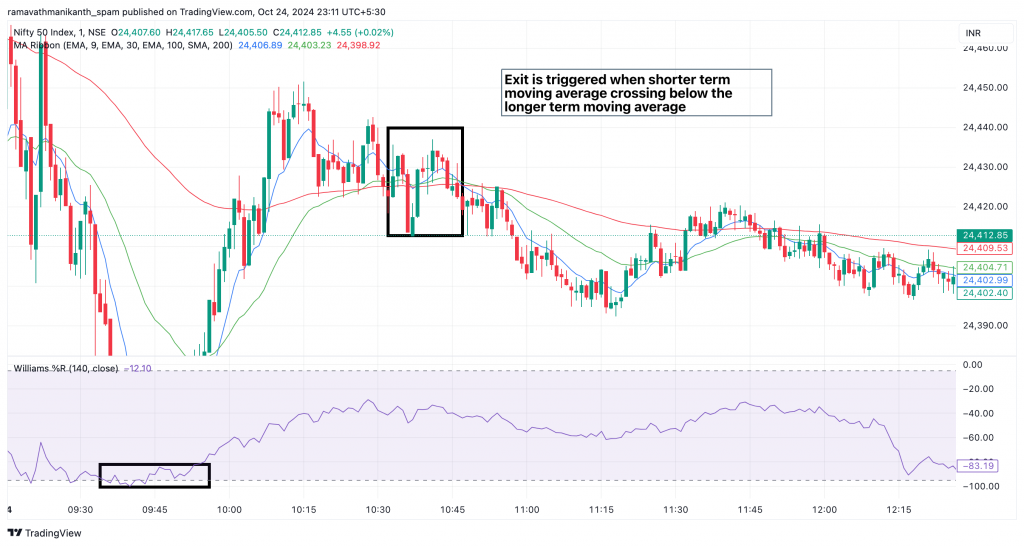
In the above pictorial representation, we can see all the EMA’s have converged, finally EMA(9) crossing below EMA(30), EMA(100)
Target And stop loss
Scalping requires a lot of discipline, which can be maintained by having predefined targets and stop-loss levels. Setting these limits helps minimize losses, especially in scalping, where trades are executed in shorter timeframes, and markets can be highly volatile.
For this scalping strategy, we will set specific targets and stop-loss levels based on our trading index. We will book profits in two stages: first, we secure around 60-70% of our earnings, and then we trail the remaining position until an exit signal is generated. Below is a table outlining the targets and stop-loss levels:
Index | First Profit Booking (Points) | Stop Loss (Points) |
Nifty | 15-20 | 20-25 |
Bank Nifty | 70-80 | 80-85 |
BSE Sensex | 100-120 | 140-160 |
Table Caption: Profit booking and stop-loss points for Nifty, Bank Nifty, and BSE Sensex in the scalping strategy.
Example
Let’s apply the scalping strategy using the Williams %R and EMA indicators to the Bank Nifty index and see how it performs.
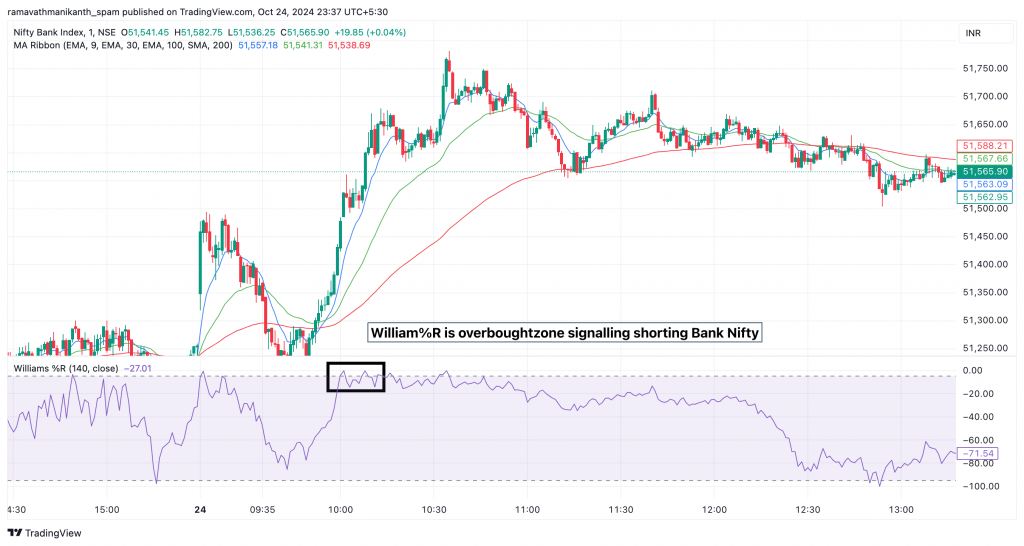
In the Bank Nifty chart, we first identified an overbought zone using the Williams %R indicator, which signalled that Bank Nifty was in an overbought condition, indicating a potential shorting opportunity.
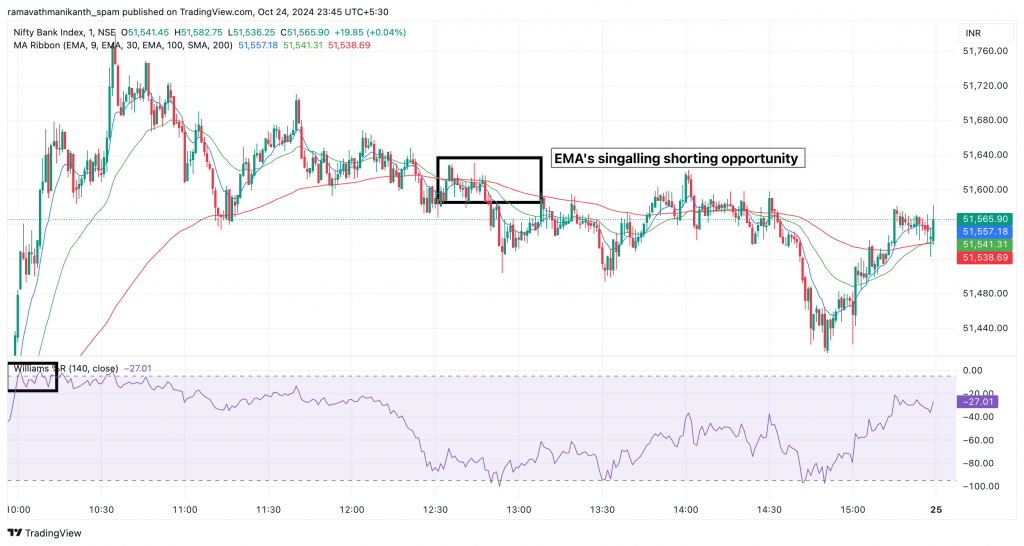
In the above chart, following our strategy, we identified an exit point after the short entry. We aimed to capture 70-80 points to book our first profit. After observing the price movement in line with the downward momentum, we successfully reached this target, allowing us to book the first part of our profits.
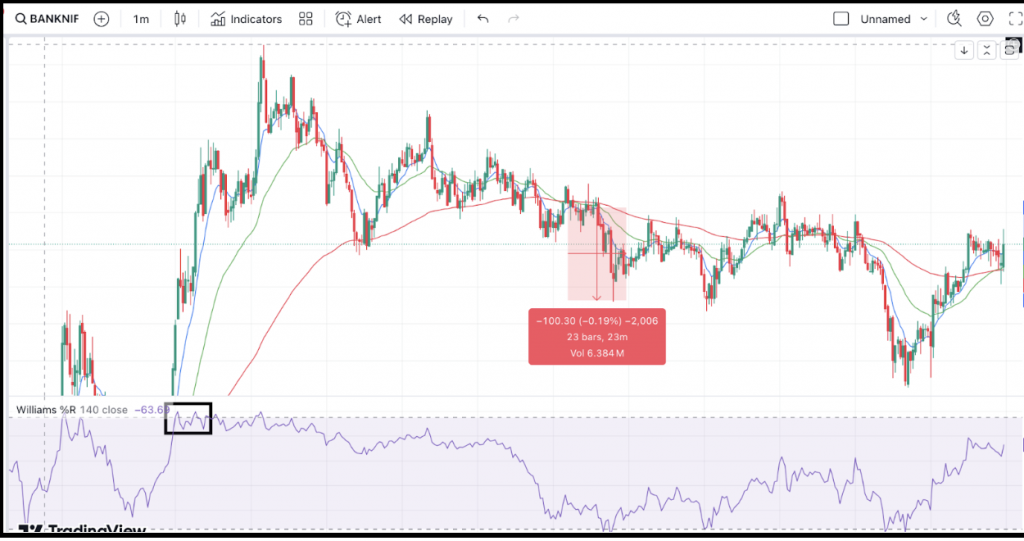
In this chart, we can see the first profits made by the trade in just 23 minutes.
Things To Remember
This scalping strategy is a great way to catch the quick reversals in the market, but there are some things to remember so that this strategy will work best for us.
- When EMAs trigger an entry, ensure they cross with a clear upward or downward slope. This confirms a strong trend and helps avoid false signals.
- This strategy is more suitable for extensive indexes like Bank Nifty because we are scalping in the 1-minute time frame. It should have sufficient liquidity to get executed; if we apply for stocks like Reliance or Infosys, then increase the time frame.
- Look for entries in the different correlated indexes or stocks to find trades with entry. For example, this can be (Nifty 50, Fin Nifty)
- We must remember that this strategy can be replaced with other technical indicators. We can use stochastic RSI instead of the William%R oscillator; this depends upon trading psychology.