Chapter 5: VWAP Scalping Strategy
Overview
Scalpers look for quick profits by entering and exiting trades fast. They focus on assets with high liquidity and strong movement, like Nifty and Bank Nifty in India. This strategy works on smaller time frames using highly traded stocks or indexes.
The method uses the VWAP (Volume Weighted Average Price) indicator to find entry and exit points. It is combined with RSI (Relative Strength Index) and EMA (Exponential Moving Average) to improve the scalping process. The VWAP strategy involves both buying and selling options contracts. To manage risk, stop-loss levels are set in two ways: using a risk-to-reward ratio and a trend-based EMA indicator.
Indicators used in this strategy
In this VWAP strategy, we’ll combine three powerful indicators to find the best entry and exit points. Each indicator plays a unique role, making trading smoother and more effective. Let’s break it down:
VWAP
The VWAP (Volume Weighted Average Price) is a technical indicator that shows the average price of an asset traded during the day, weighted by both price and volume. It gives more importance to prices with higher trading volume, making it a valuable tool for identifying fair value levels. Here’s the formula for VWAP:
VWAP = (Sum of (Price × Volume)) / (Sum of Volume)
This helps traders understand whether the price is overvalued or undervalued based on market activity. Check out VWAP here.
EMA
We’ve used EMA (Exponential Moving Average) in several other strategies, but here’s a quick recap. Unlike the simple moving average, EMA places more weight on recent price changes, making it more responsive to current market trends and better suited for dynamic trading conditions.
EMA_today=(Pricetoday×K)+(EMA_yesterday×(1−K)) K=smoothing constant
More in-depth explanation about EMA here
RSI
The final indicator we’ll use is the Relative Strength Index (RSI), a momentum indicator that tracks the speed and direction of price movements. RSI ranges from 0 to 100, with readings above 70 signaling that an asset may be overbought and readings below 30 indicating it may be oversold. Traders rely on RSI to identify potential buy or sell opportunities and to anticipate trend reversals based on market momentum.
Add Your Heading Text Here
We are analyzing entries based on 3-minute candlestick patterns. The settings for the 20 EMA are configured to consider the closing prices of the last 20 candles. We will use the RSI with a period setting of 20 to refine our entry points.
The leading indicator, VWAP, will be adjusted by unticking the boxes for the upper, lower, and bands fill #1. This modification ensures that only the VWAP line remains visible. Below is a snapshot of all the indicators for better clarity and understanding.
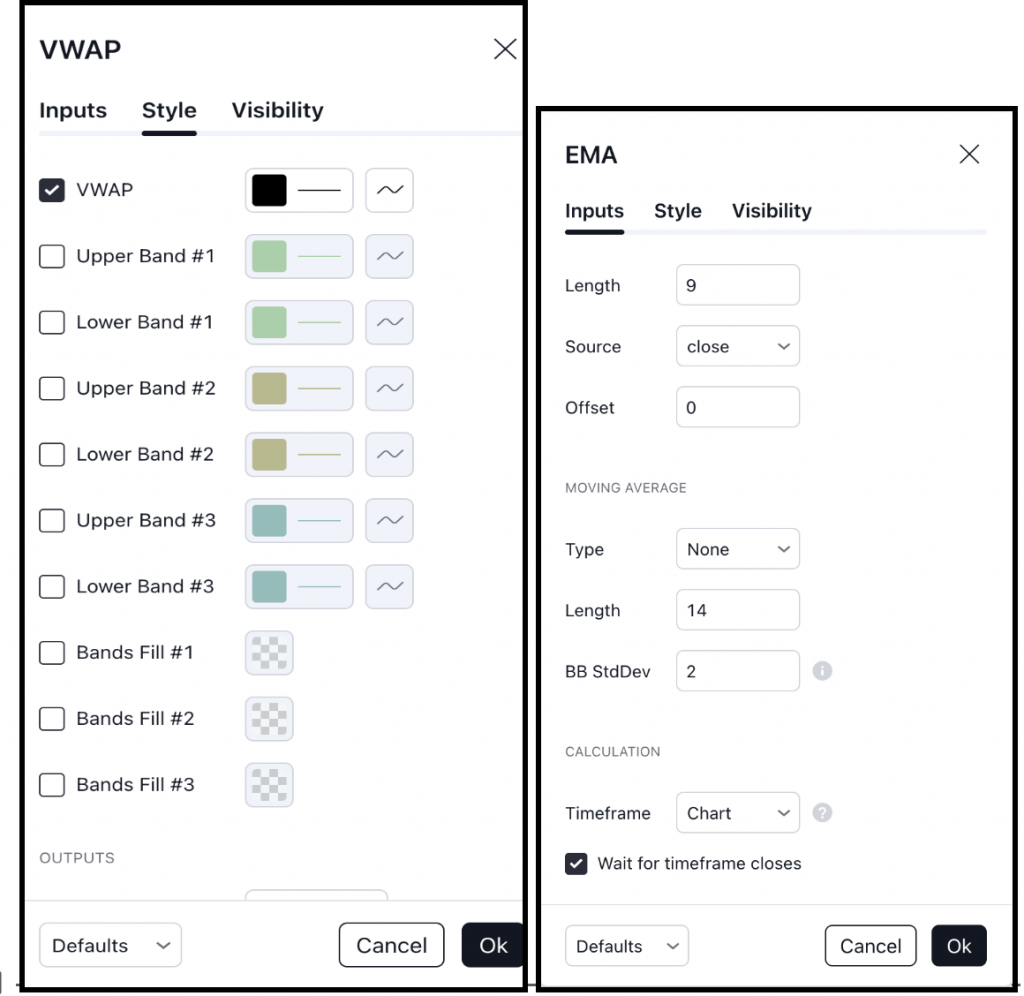
Below are the specific conditions for implementing this strategy effectively:
- The index price is more than 20 EMA technical indicator
- The closing price of the candlestick was more than VWAP
- The oscillator indicator RSI should be more than 50 level
Using the EMA technical indicator, we ensure a bullish entry by confirming that the trend is intact. The VWAP helps us identify buyer dominance, as the price trading above the average paid for the asset indicates vigorous buying activity. When the RSI is above 50, we interpret it as a sign of bullish momentum, confirming an upward trend and its strength. This approach helps us avoid weak or fading trends, increasing the chances of entering a strong and sustainable move.
Let’s take an example of a Nifty chart on a 3-minute time frame to understand better how bullish this strategy is in action.
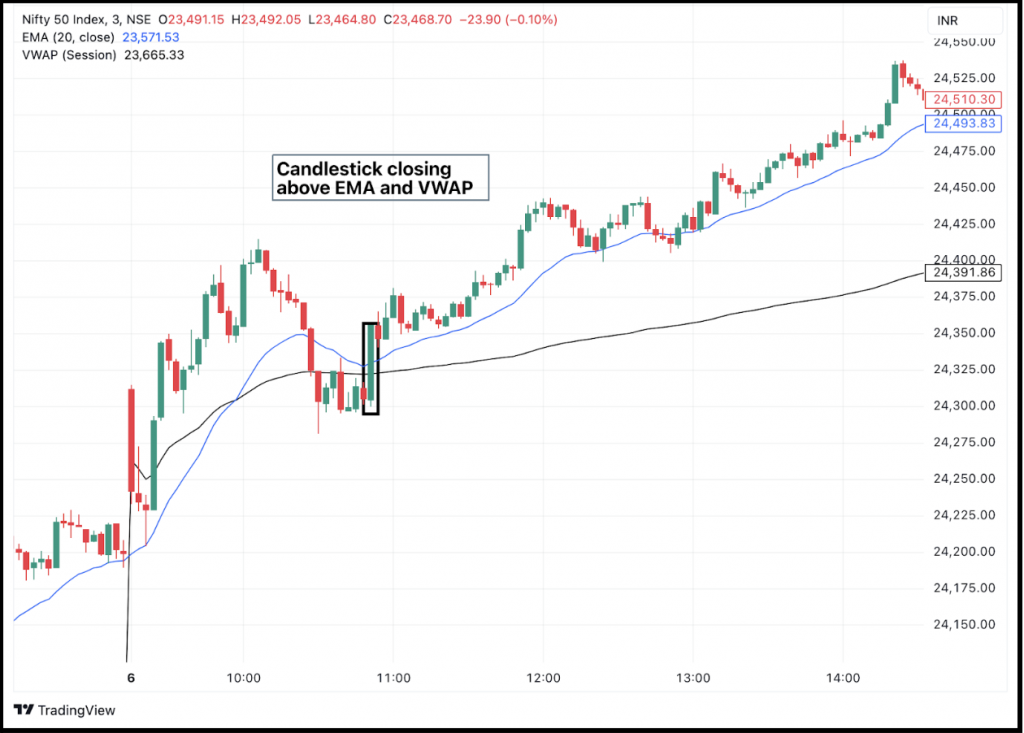
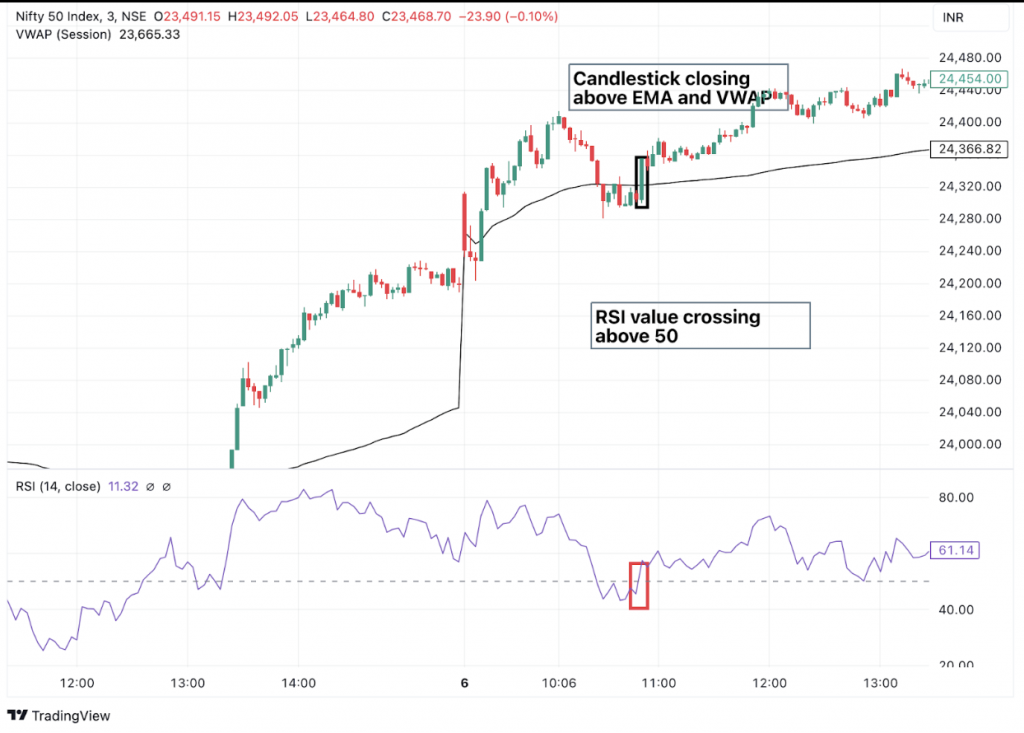
The above chart shows that all three indicators are perfectly aligned, signalling a bullish entry. We can proceed to the Nifty-50 option chain and buy an At-The-Money (ATM) call option to capitalize on the trend. Alternatively, we could also consider the ATM put option to assess profitability, but in a bullish market, call premiums are generally priced higher since they attract more buyers.
However, if we do not foresee a substantial upside in the market, it may be prudent to sell the call option. This approach allows us to benefit from time decay if the market moves sideways, ensuring we can still generate some profit as the option contract expires.
Now that we have a clear understanding of how to take positions in a bullish market, let’s move on to bearish entry strategies. The criteria for a bearish entry are outlined below.
- The index price is less than 20 EMA technical indicator
- The closing price of the candlestick has to be less than VWAP
- The oscillator indicator RSI should be less than 50 level
Making a bearish entry often involves buying a put option, which allows us to profit as the index moves downward.
Planning the exit
Now that we are clear about the conditions for entering the stock let’s move on to understanding when to exit. Knowing when to exit is crucial, as high volatility in the index, especially on lower timeframes, can lead to sudden price swings. To manage this effectively, we decide on the exit point at the time of entry. In this scalping strategy, there are two exits: one based on the EMA indicator and the other on a predefined risk-to-reward ratio.
Risk-to-reward ratio
In this strategy, the risk-to-reward ratio is exciting. We set our exit point when the index reaches twice the distance of the candlestick’s low distance from the entry price. This creates a clear trading plan, establishing a risk-to-reward ratio of 2:1. This method is efficient and straightforward to implement, as it takes advantage of decisive price moves. With a 2:1 reward-to-risk ratio, the overall profits can still exceed losses even if the success rate is only 50%. Below is an example from the Nifty-50 chart illustrating how we exit based on this risk-to-reward ratio.
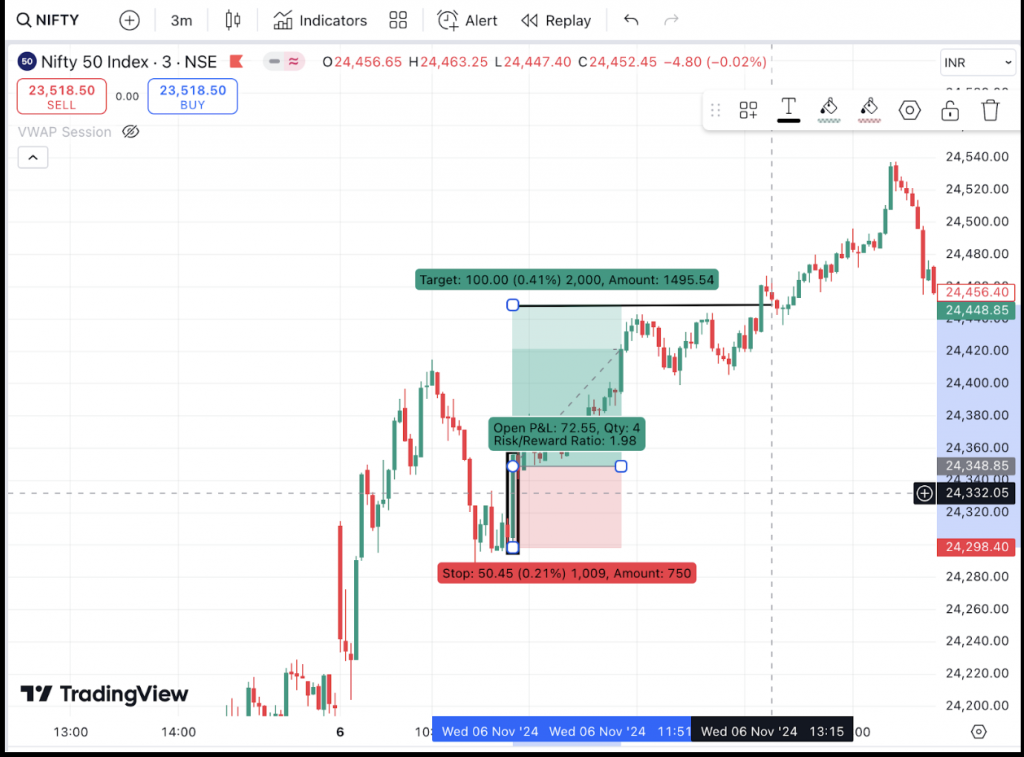
In the above example of Nifty, we can observe that by taking an entry at the exact closing of the index and setting the stop loss at twice the candlestick’s low, the target would have been achieved in approximately three hours.
This risk-to-reward ratio strategy works particularly well in markets with moderate momentum, where candlesticks form smaller, more predictable ranges. It is especially effective for range-bound trading, as it capitalizes on steady price movements, often driven by minor technical patterns or subtle market shifts.
EMA
When triggering an entry in the index, the exit plan can also be based on the Exponential Moving Average (EMA) indicator. The exit is executed when a candlestick closes below the 20 EMA. This approach ensures you stay aligned with the trend and exit only when the trend shows signs of weakening.
Since the 20 EMA moves with the price, it acts as a dynamic stop-loss that adjusts to the market’s volatility and price movements. This method is rule-based, relying on a specific condition (candlestick closing below the EMA), eliminating emotional decision-making. Additionally, it is easy to implement and can be backtested for historical reliability, making it a practical and effective strategy.
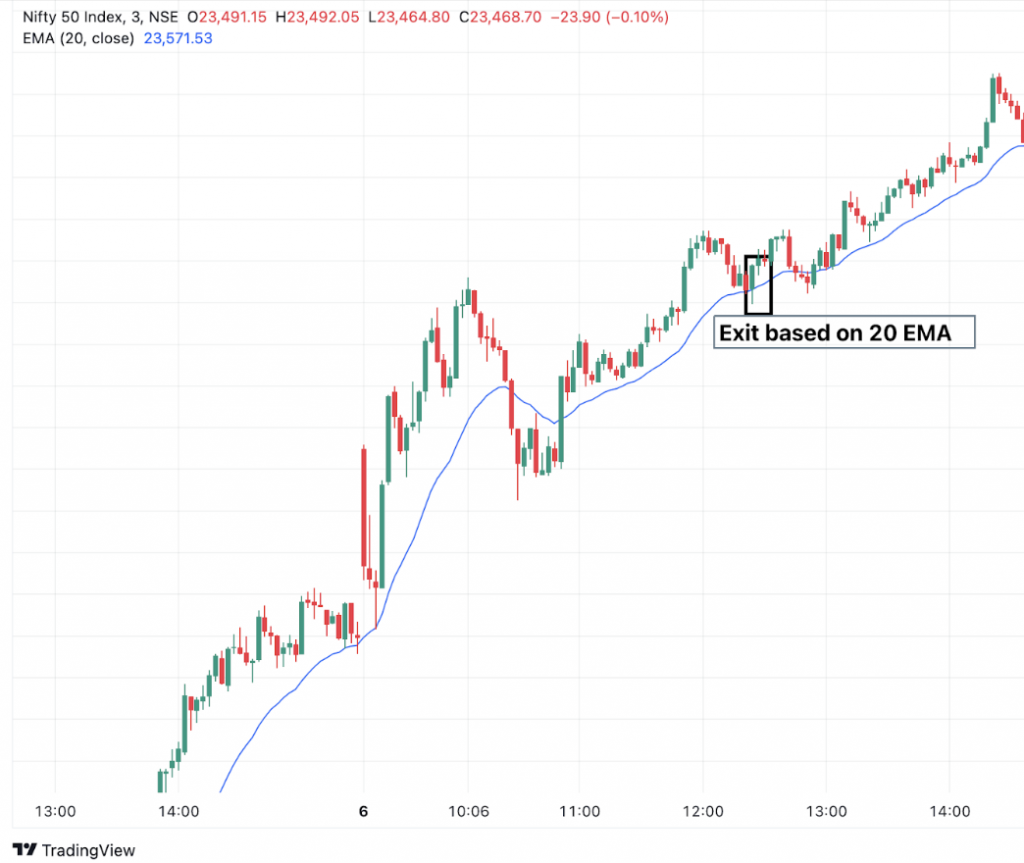
In the above example, the EMA-based exit approach still results in profit, but it leans more towards a risk-taker’s strategy. It is most effective in trending and volatile markets, as the 20 EMA acts as dynamic support or resistance, allowing exits at reasonable points without overreacting to minor pullbacks.
Stop loss
Regarding managing risk, our stop-loss strategy ties closely to the exit criteria we’ve discussed earlier. We use two simple yet effective approaches:
Risk-to-Reward Ratio Stop-Loss:
Here, we set our stop-loss at a distance equal to the candlestick’s low from the entry price. This keeps our risk-to-reward ratio at 2:1, meaning the potential profit is double the risk. It’s a straightforward plan that works well in markets with steady momentum, where price moves are more predictable, and targets can be hit quickly.
EMA-Based Stop-Loss:
We rely on the 20 EMA as a dynamic guide in this approach. If a candlestick closes below the EMA, it’s our signal to exit the trade. This lets us stay in the trend for as long as it’s strong while exiting when there’s a clear sign of weakness.
Combining these methods ensures every trade has a clear risk plan, helping us stay disciplined and confident in our strategy.
Examples
Let’s look at some examples for a better understanding. Below is the chart of Nifty. We apply our indicators to the chart. The primary conditions for the strategy are as follows: the Relative Strength Index (RSI) should be above 50 for bullish entry, the stock price should break above the VWAP, and the stock should close more than 20-EMA all these are on 3-minute time frame.
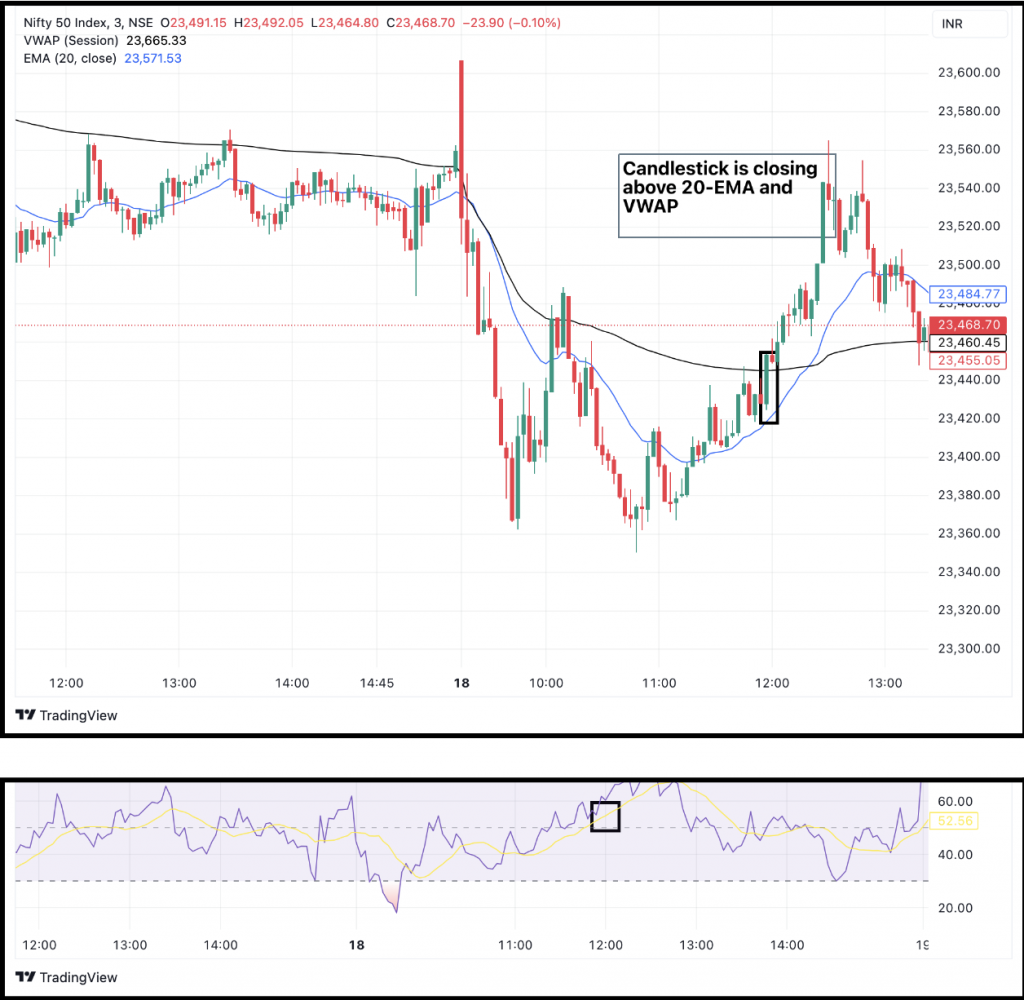
The chart above shows that the RSI value is around 55, not exactly 50. This shows that sometimes, we must be flexible when spotting trading opportunities. However, if we need clarification, skipping such trades is often better. It all comes down to our risk appetite if the entry feels right, we can go for it, and if not, it’s okay to leave it. After all, in trading, avoiding losses is also a form of profit.
If we look at the exit for the above Nifty-50 example, we can base it on the risk-to-reward ratio by setting the stop-loss at the low of the candlestick and the target at twice the distance from the entry (the high of the candlestick). The trade would look like this, as shown in the pictorial representation. In this case, we reached our target within just 30 minutes.
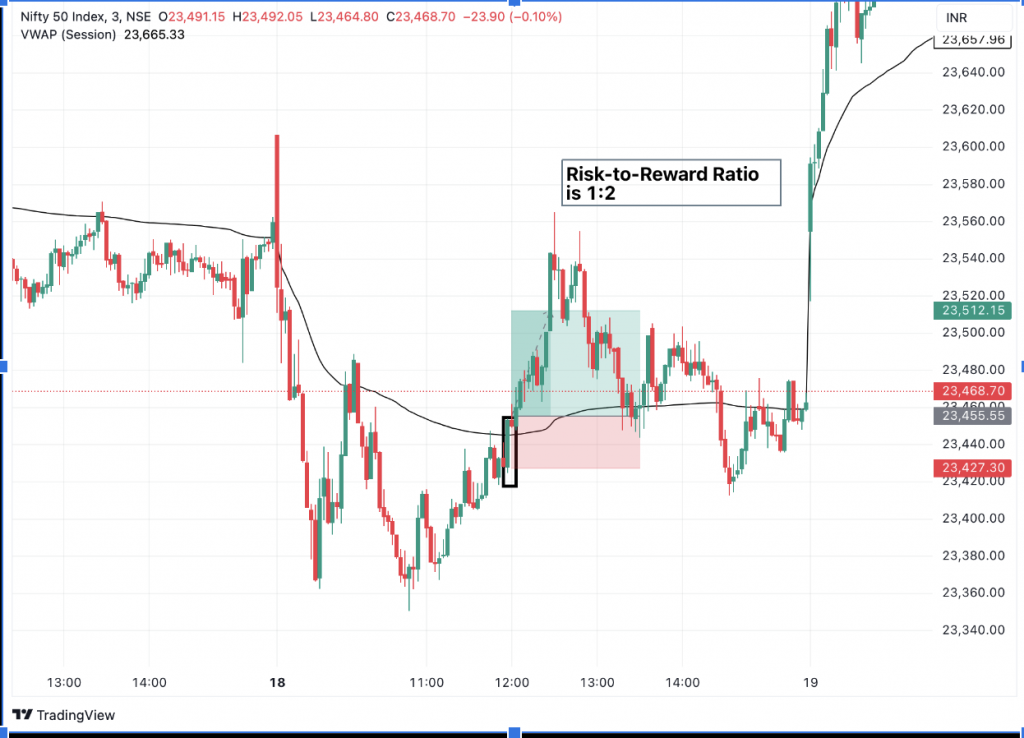
Another approach we can use is setting the 20-EMA as a stop-loss. This acts as a trailing stop-loss, and we would exit the trade as soon as the candlestick closes below the 20-EMA. However, this method might result in lower profits compared to an exit based on a risk-to-reward ratio. In scalping, focusing on a better risk-to-reward ratio is usually more effective, while trend-based indicators like the 20-EMA are better suited for long-term trading.
Things to remember
- Avoid trading on 3-minute candlesticks in Bank Nifty with more than 100 points movement and in Nifty with more than 50 points movement to reduce risk during high volatility.
- Exit 50% of your position when the risk-to-reward ratio is met, and let the remaining 50% ride using the 20-EMA to capture more momentum.
- Using shorter moving averages can give tighter control, but it often leads to more exits and choppiness, so use them cautiously.