Chapter 2: Monthly 89-EMA Strategy
Overview
Now that you have understood the importance of having a clear trading strategy to make money in the market, we can develop one by watching the market over time. In this chapter and the next ones, we’ll go over some tried-and-true strategies that can help us trade profitably.
In this chapter, we will start with positional strategies, which trade on significantly more extended time frames. We’ll see how a simple exponential moving average indicator can guide us on market entry and exit points. This strategy is more suitable for those who can handle temporary market fluctuations, typically long-term investors who hold positions for several years.
This strategy is more suitable for trending markets that show clear, sustained trends, whether in a bull or bear market, because, in sideways markets, frequent crossovers can be misleading. So, we should maintain a clear stance on the market’s direction.
Let’s uncover our first exponential moving average positional strategy.
Indicators used in this strategy
Before we dive into the positional strategy, let’s first look at the indicator we’ll be using: the exponential moving average (EMA). In this strategy, we are using a single indicator, the EMA. Unlike the simple moving average, the EMA gives more weight to recent price changes, making it more responsive to current market conditions.
EMA_today=(Pricetoday×K)+(EMA_yesterday×(1−K)) K=smoothing constant
More in-depth explanation about EMA here
We will compare the exponential moving average close with the candlesticks open, high, low, and close(OHLC) to determine the entry and exit signals in the market
Spotting an entry
We are using a monthly timeframe to plot our exponential moving average indicator. The core principle behind this strategy is that the stocks that we pick by using have to be fundamentally strong and can survive any crash either in it or the overall market.
The secret ingredient we’ll use is the 89-EMA plotted on a monthly timeframe. Here, each candlestick represents the entire month’s OHLC (Open, High, Low, Close) data, and our exponential moving average is calculated based on this monthly timeframe.
We’ll discuss our entry points in a bull market, as this strategy is best suited for trending markets.
Since we’ll be going long on the stock, it’s crucial to identify bullish candlestick patterns like the bullish engulfing and bullish marubozu. These patterns can signal upward solid momentum. (Read more about bullish candlesticks here)
Before using the strategy to spot an entry, we need to make sure that the closing price for the 89-month EMA is more significant than zero. This shows that the stock has enough trading history and stability. Sticking to Nifty 500 stocks can ensure our portfolio contains well-established companies with reliable data.
We can buy the stock based on either the high or low candlestick. First, let’s focus on the monthly low. We should consider buying the stock if it meets either one of the following conditions:
- The monthly low is less than or equal to the 89-month EMA of the monthly close.
- The monthly low is less than or equal to 105% of the 89-month EMA of the monthly close.
Here, we are using a 5% slight buffer in our strategy, meaning the monthly low is 1.05 times the 89-EMA. This adds more validation by acting as a strong support, making it more reliable for a long trade.
- The monthly high is greater than or equal to the 89-month EMA of the monthly close.
- The monthly high is greater than or equal to 95% of the 89-month EMA of the monthly close.
Just like the monthly low, we have a similar condition for the monthly high. The 95% level acts as a threshold to enter the trade slightly earlier, helping us capture more on the upside.
Let’s start with an example. First, apply the 89-EMA on the trading view terminal and switch to the monthly timeframe.
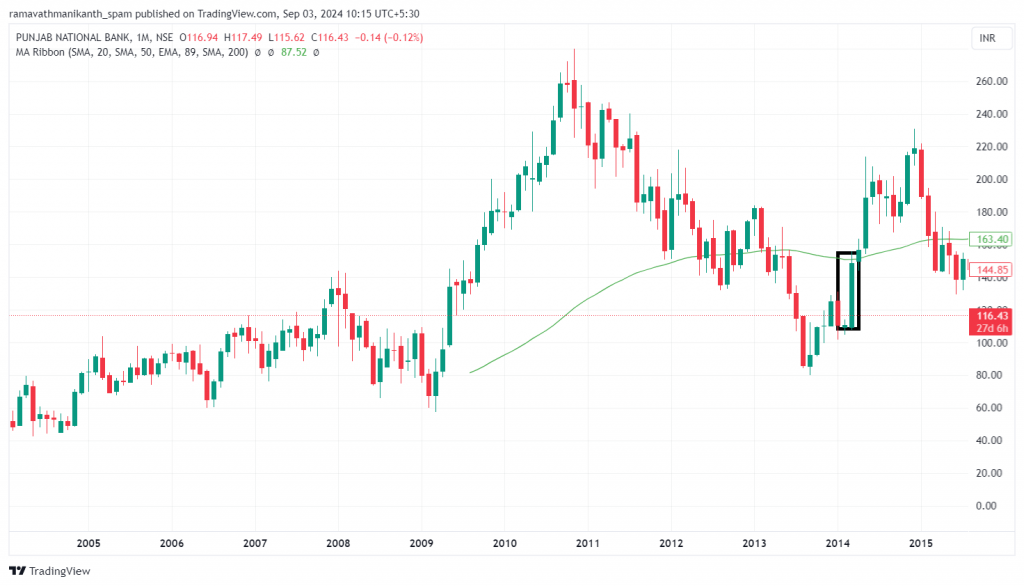
As seen in the above chart, just before the highlighted region, a bullish candlestick formed after PNB Ltd closed near the 89-EMA, indicating upward momentum in the stock. This could be a potential entry point in the market.
Ideally, we should enter the stock at the end of the month when the first candlestick crosses above the 89-EMA on the monthly time frame.
To be on the safer side when taking an entry, we should consider entering the stock only when a bullish candlestick closes above the high of the candlestick that triggered our initial entry signal. This confirmation strategy helps us reduce the likelihood of false breakouts and increases the probability that the trend is genuinely shifting in our favor, providing a more reliable entry point.
Planning the exit
Now that we are clear about the conditions for entering the stock let’s move on to when to exit. It’s crucial to know when to exit because if the stock crashes suddenly, we risk losing our capital.
-We will close our position in the stock if a bearish candlestick, such as an inverted hammer, bearish marubozu, evening star, or the formation of a lower low, appears at the 89-EMA.
– Another condition is if the stock price consolidates, followed by the formation of a bearish candlestick.
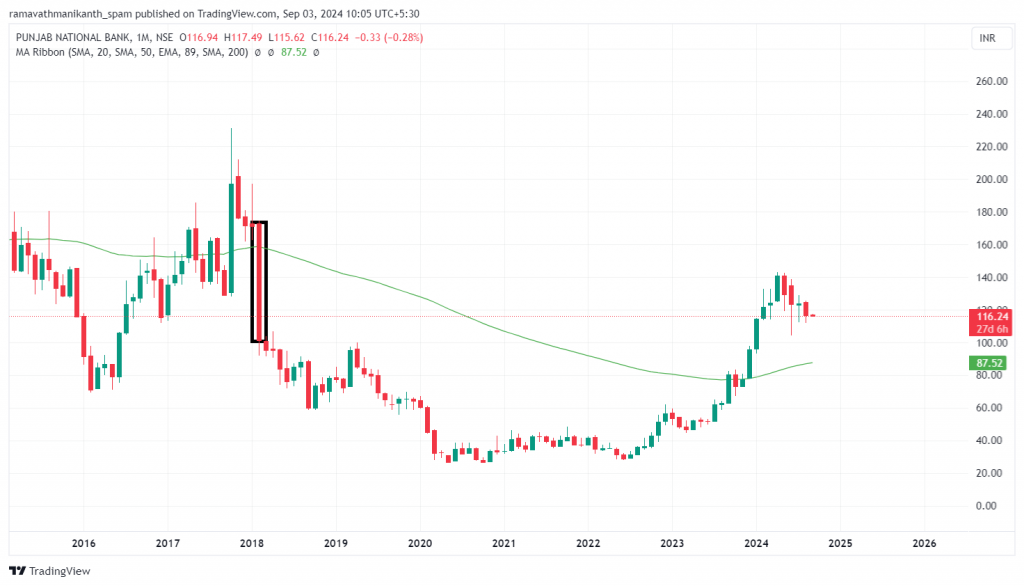
In the above example of PNB Ltd, the appearance of a significant bearish candlestick pattern, such as a bearish marubozu, combined with the continuation of lower lows, serves as a solid signal to consider exiting the position.
Another essential point to remember is that if our holding period exceeds five years, the 89-EMA becomes the sole signal for exiting. We must follow this to ensure we exit the strategy if there’s a significant shift in the long-term trend.
For our next trade, if a particular resistance level is frequently rejecting the stock, it indicates a potential reversal from that point. We can then assume that the resistance level is our target for the following trades.
Stop loss
To set a stop loss for our strategy, one approach is to use the 89-EMA as a stop loss of the position, turning it into a trailing stop loss, allowing you to stay in the position until the stop is triggered.
If the price closes below the 89-EMA, it is a clear sign to exit, indicating that the stock is losing momentum. This makes it essential to keep the 89-EMA as your stop loss.
Another approach is to move the stop loss to a specific resistance level if the strategy shows strong momentum, breaking resistance with bullish candlesticks and high volume. This method can be used if you prefer to avoid following the 89-EMA.
Examples
Let’s look at a clear example of the 89-EMA positional strategy. Below is Wipro’s chart for the monthly time frame in which our strategy was applied.
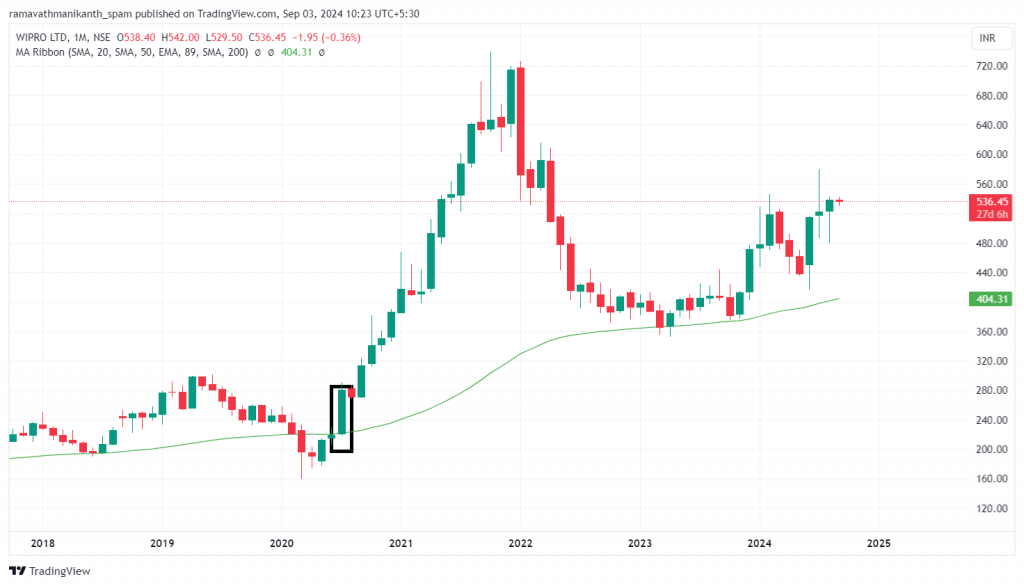
Our 89-EMA strategy triggered an entry on 1st July 2020 with a bullish marubozu, a bullish candlestick indicating intense buying pressure in the stock, which was a key criterion for entering the position.
The exit was identified by the formation of a solid bearish candlestick after a consolidation channel, which formed at the top of the rally on 3rd January 2022. Here is the pictorial representation of it.
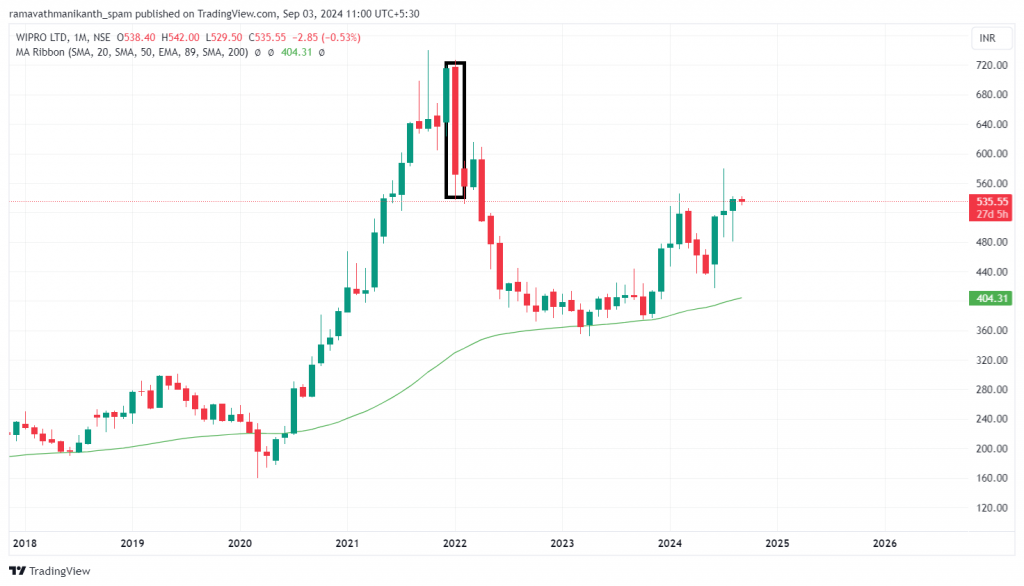
In the above example, a bearish engulfing pattern formed after the rally, indicating selling pressure. This trade lasted for 551 days, and the positional strategy yielded a return of 104%.
Things to keep in mind
- The 89-EMA positional strategy works best on monthly time frames for most stocks, as it captures the long-term trend while filtering out short-term volatility and noise.
- This strategy is effective in predicting long-term movements but can expose the portfolio to risks if market conditions change, making the strategy less effective.
- It performs well in trending markets but may lead to stagnation or losses if the market becomes sideways or choppy, as it is not suited for non-trending phases.
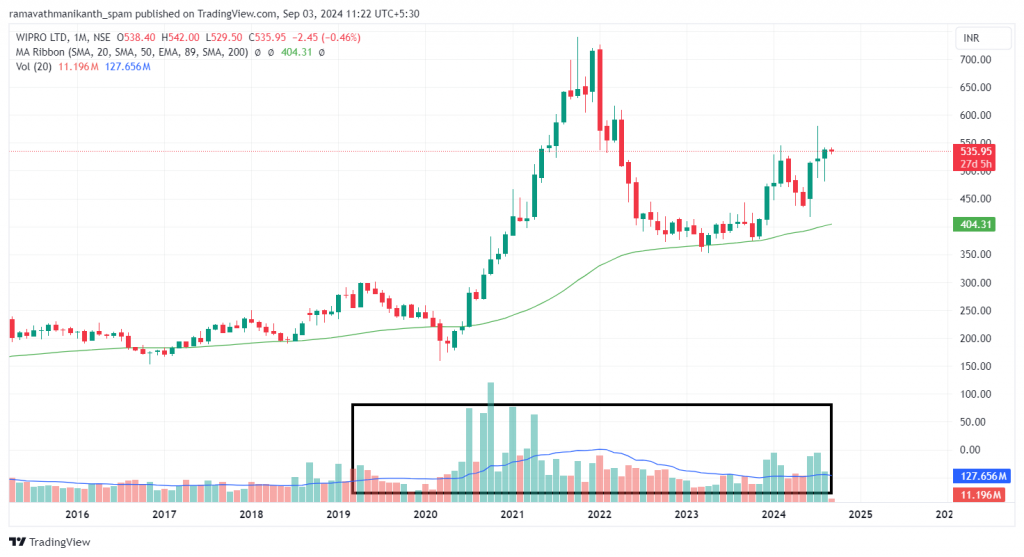
- Volume can be a valuable indicator for both entry and exit points in this strategy. Plotting the average volume of the last 20 bars on the trading chart helps gauge buying or selling pressure.