Our final positional strategy is built on very basic yet powerful technical indicators: the relative strength index (RSI) and exponential moving average (EMA).RSI+EMA strategy is a positional strategy, which means trades last for weeks or months. This positional strategy is often used by investors who aim to capitalize on long-term market trends by holding positions for extended periods.
This strategy is a powerful combination of RSI and 30-day EMA which is more suitable for long-term perspective. It’s particularly effective in indicating when a stock is gaining short-term momentum, enabling traders to capture the move over a few weeks or months. We recommend using the following stock universe, indicators, and time frame.
Let’s look at our strategy
Indicators used in this strategy
In this strategy, we use two technical indicators, EMA and RSI, to filter stocks. An exponential moving average (EMA) gives more weight to recent closing prices, making it more responsive to new data. For our strategy, we use a 30-day time frame, where the 30-day EMA shows the average price over the last 30 trading sessions, with more emphasis on the recent ones. This smooths out short-term fluctuations and helps identify the overall market trend.
The Relative Strength Index (RSI) is a momentum indicator that measures the speed and change of price movements. It ranges from 0 to 100, with values above 70 suggesting that a stock is overbought and values below 30 indicating that it’s oversold. Traders use the RSI to spot potential buy or sell opportunities and to predict trend reversals based on market momentum.
Spotting an entry
We look for entries on the daily time frame, and trade is triggered only when
Relative strength index crossing greater than 60
Daily candlestick closing greater than the 30-day exponential moving average (EMA)
Both conditions must happen at the same time for an entry to be valid. Ideally, the entry is made after the day-closing candlestick. Since we are going long, it’s preferable to identify a bullish candlestick pattern like a bullish marubozu or bullish engulfing.
But for a more risk-averse approach, consider entering the stock only when a bullish candle surpasses the high of the candle that triggered the entry.
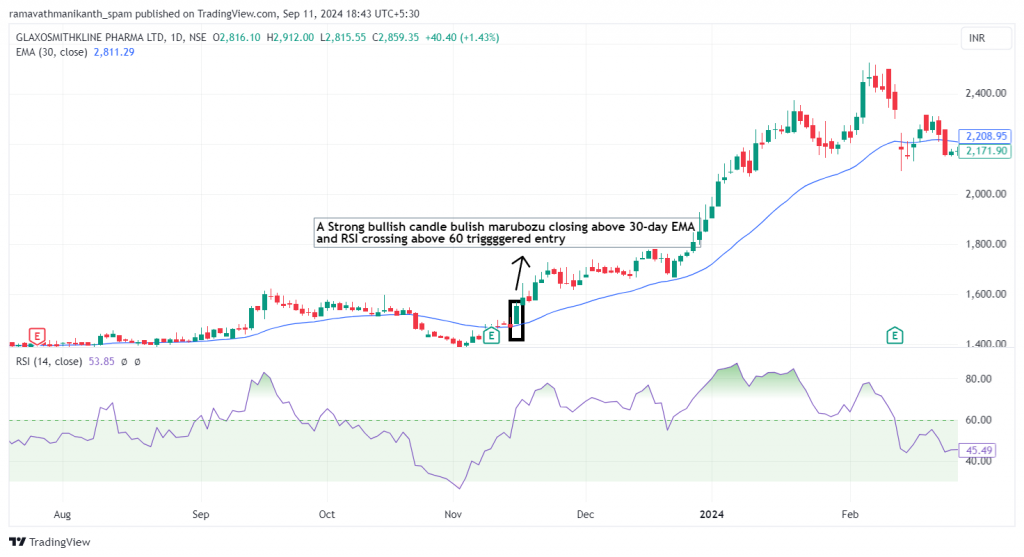
Here is a pictorial representation of the entry
A bullish candle is seen closing above the 30-day EMA, and the RSI is above 60 in GlaxoSmithKline Pharmaceutical Ltd. in the daily and weekly time frames.
In this example, we can see both technical indicators aligning, with the RSI above 60 and the candlestick closing above the 30-day EMA, triggering the entry simultaneously. The presence of a bullish candle, specifically a bullish marubozu, provides strong confirmation for entering the trade.
Planning an exit
This positional strategy takes place in two ways.
Closing of the stock reaching the latest swing after the entry of stock or else testing the previous resistance level
The candlestick is going below the 30-day exponential moving average.
To identify key swing points, simply look at the chart and find the most recent swing high (the highest point before a downward movement) and swing low (the lowest point before an upward movement). Connect these points as they represent important turning points in the stock’s movement. Discover support and resistance more here.
We are using resistance as the exit point because the stock previously struggled to move higher at this level. If the price reaches this level again, it may face selling pressure, as it has had difficulty breaking through in the past.
When the candlestick closes below the 30-day EMA, it is a clear sign of market bearishness. This signals that it’s better to exit the trade to avoid potential losses.
Spotting a bearish candlestick during an exit provides a more decisive confirmation of a market reversal. We should look for bearish patterns, such as a bearish marubozu or an evening star. If any of these patterns appear, along with either of the exit conditions mentioned earlier, it triggers an exit for our positional strategy.
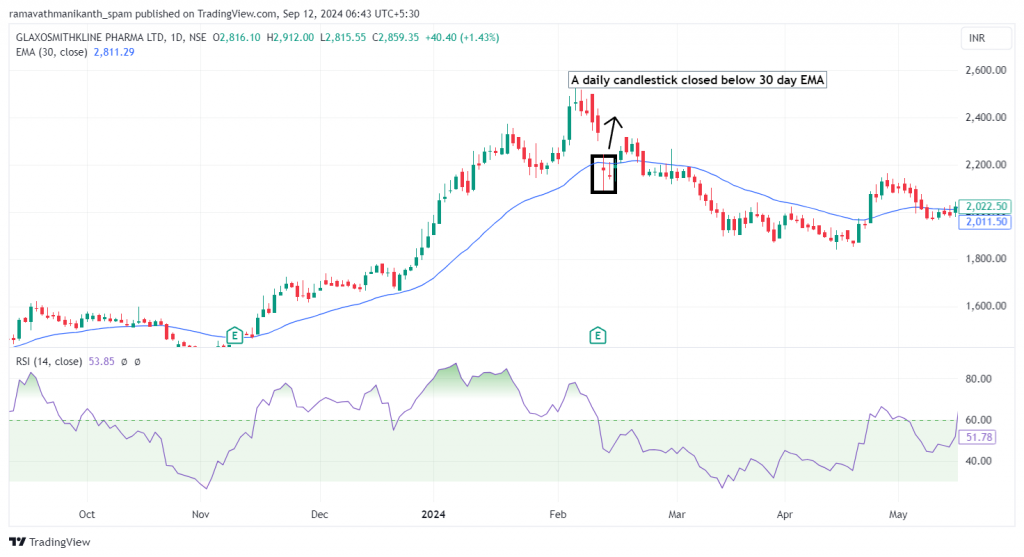
Here is an example of the same trade on GlaxoSmithKline Pharmaceutical
An exit marked by the price breaching the 30-day EMA in GlaxoSmithKline Pharmaceutical Ltd. in the 1D time frame
In the above chart, we can see that a daily candlestick formed an indecisive pattern, such as a doji, and closed below the 30-day EMA. After this, the market took an opposite stance, signaling a potential trend reversal. But remember, we exit our trade if it meets either condition.
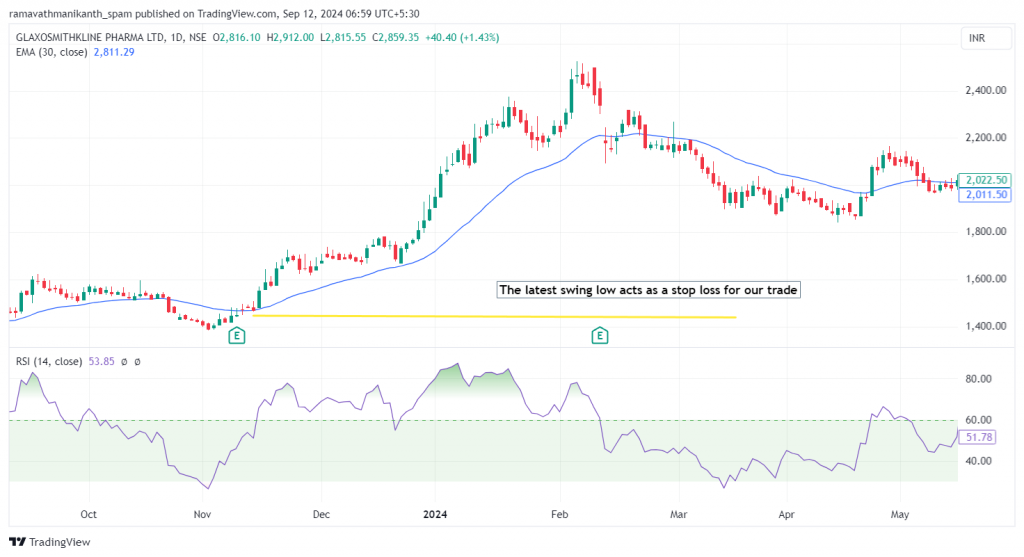
Stop loss
The price breaching the swing low on the daily time frame acts as a stop loss. The swing low serves as a crucial support level where buyers previously stepped in to push the price higher. If the price breaks below this point, it indicates that buyers are losing control and market momentum is shifting toward sellers. This is a sign of a trend reversal, suggesting the uptrend has ended and a potential downtrend could begin.
The daily candlestick chart of GlaxoSmithKline Pharmaceuticals Ltd. shows the latest swing low acting as a stop loss, with the price moving around the 30-day EMA. (Source: trading view)
Examples
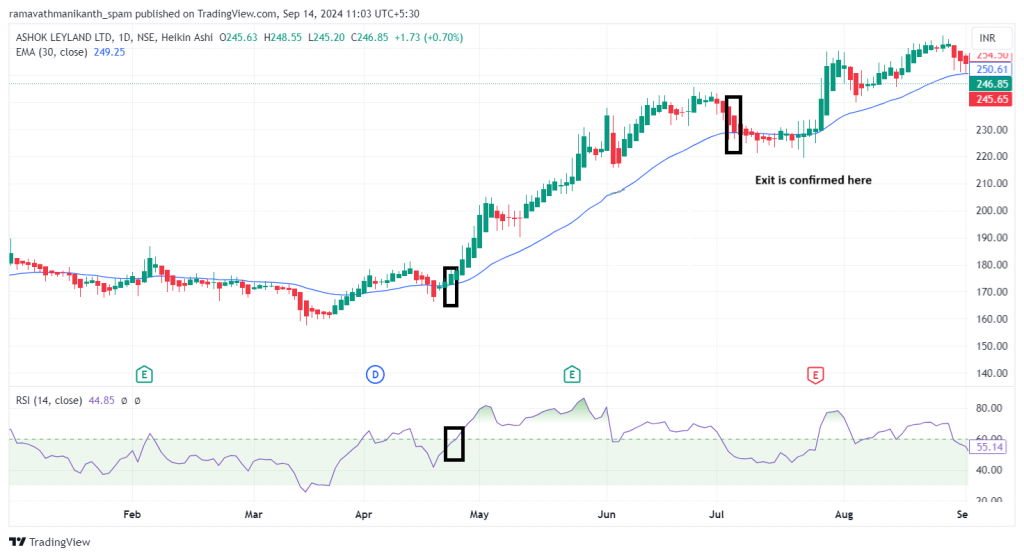
Let’s look at a clear example of this strategy for better understanding. Below is the chart of Ashok Leyland.
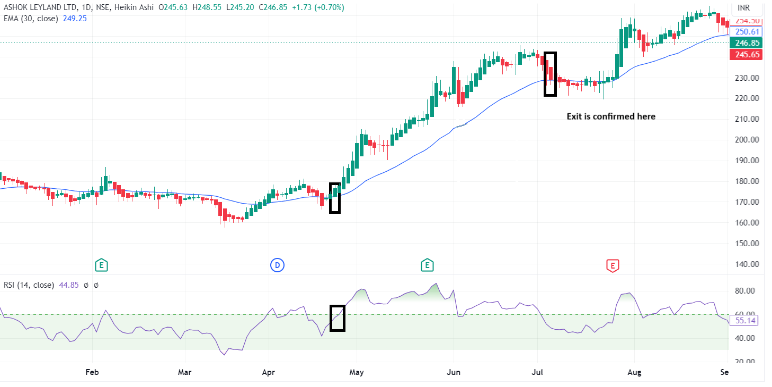
Daily candlestick chart of Ashok Leyland Ltd. showing key moments where the RSI EMA strategy gave buying opportunities (Source: trading view)
Ashok Leyland just closed above the 30-day EMA, with the RSI at 60, showing a potential buying opportunity. To confirm, we can see a series of green candlesticks forming the three white soldiers pattern.
Our exit would be when the candlestick closes below the 30-day EMA, indicating a loss of momentum. Additionally, the appearance of bearish candlesticks confirms our decision to exit. Below is a highlighted part of it.
Daily candlestick chart of Ashok Leyland Ltd. showing the RSI EMA strategy indicating an exit point (Source: trading view)
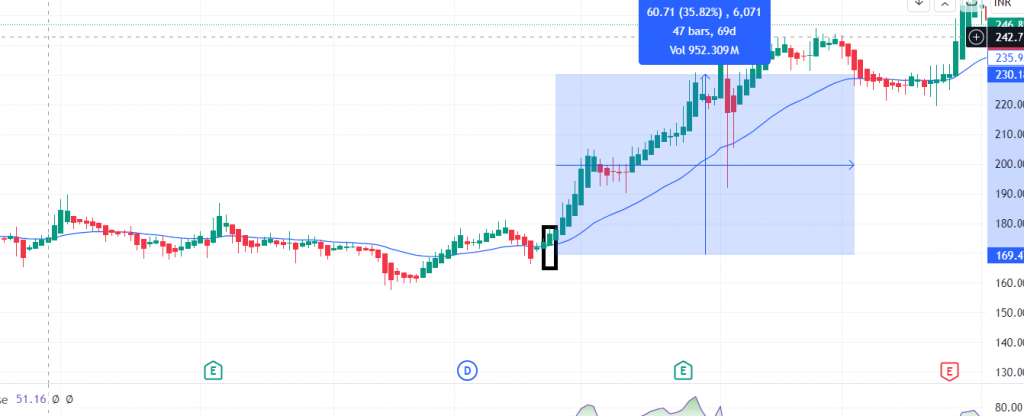
This would have given us a return of 35% in 69 days, which is a very good
Daily candlestick chart of Ashok Leyland Ltd. showing a 35% return over 69 days, as indicated by the RSI EMA strategy. (Source: trading view)
Things to keep in mind
Use two different time frames: weekly to identify the overall trend and strength, and daily to fine-tune entry and exit points.
Spotting short-term bullish patterns like a marubozu or morning star on the daily chart adds an extra layer of confirmation.
Diversify your strategies since every strategy has limitations. The RSI + EMA strategy may be less effective in range-bound markets.
In range-bound markets, RSI may oscillate between overbought and oversold levels without showing a clear trend, and price might cross the 30-day EMA multiple times without a solid directional move, leading to whipsaw trades.
Volume is a key indicator that helps confirm the strength behind price movements, adding confidence to trades.