Chapter 6: RSI + Supertrend Momentum Strategy
This is the last strategy we will discuss in the module, and it is explicitly designed for swing traders. It leverages two popular technical indicators: the relative strength index (RSI) and the Super Trend momentum indicator. When combined, these indicators provide swing traders with clear signals for entry and exit points, making it easier to capitalize on short- to medium-term price movements. This strategy is particularly effective in identifying momentum shifts and capturing gains during market swings.
This strategy is particularly suited for positional trading because it combines both momentum and trend-following indicators. It helps identify when a stock is entering a sustained bullish phase, providing opportunities to hold positions for a few months to capture meaningful gains. Trending markets are ideal for this strategy, especially during clear upward or bullish trends. In such markets, traders can capture strong, sustained movements in stock prices, allowing them to maximize returns while minimizing the noise and short-term fluctuations often seen in volatile or sideways markets.
Indicators used in this strategy
̌From the name of the strategy itself, we can infer that it involves the relative strength index (RSI) and super trend indicators. The relative strength index is a momentum oscillator that measures the speed and change in stock prices. It helps identify potential buy or sell signals and trend reversals based on market momentum. The super trend indicator, on the other hand, identifies reversal points and is directly plotted on the chart based on price action and volatility. It gives clear buy and sell signals, ultimately indicating the trend direction, whether upward or downward. Check out more about the indicators here.
Spotting an entry
This strategy filters the stock based on the below criteria:
- The closing price of the stock should be a super trend indicator
- The relative strength index value is greater than 50
When the daily closing price exceeds the Supertrend indicator, it signals a potential uptrend in the stock. This suggests that the stock price may be moving upward with strength, and the Supertrend, acting as a dynamic support/resistance level, has been breached, which could indicate a buying opportunity or continuation of bullish momentum.
The relative strength index (RSI) above 50 signals positive momentum in the stock’s price movement, indicating that buying pressure is stronger than selling pressure. When the RSI just crosses 50, it shows the stock is entering a positive momentum zone, where selling pressure is shifting towards buying pressure, creating a bullish sentiment in the market. This transition suggests that the market outlook is moving from neutral or bearish to bullish.
An entry into the market is triggered when the stock meets both buy signals. Ideally, a position is taken at the close of the first bullish candlestick following the buy signals from the indicators. This approach is more suitable for risk-takers looking for quicker entries. However, for those seeking a more confirmed signal, entry is made when the bullish candlestick surpasses the high of the candle that initially triggered the buy signal. This method provides more certainty and can reduce the risk of false signals by waiting for more decisive confirmation.
When entering a stock, whether using a risk-taking or risk-averse strategy, spotting bullish candlestick patterns like a bullish marubozu or a morning star can act as a double confirmation for entry.
Here is an example of our RSI+super trend Momentum strategy
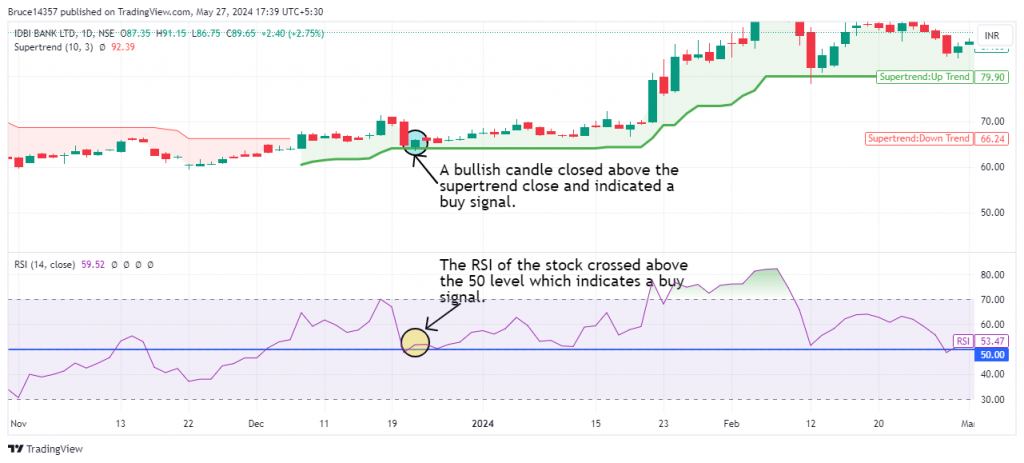
In the chart above, within the highlighted areas, we can see that a bullish candlestick has formed and closed above the super trend indicator, signaling a potential upward trend. Additionally, the relative strength index (RSI) has crossed above 50, confirming the bullish momentum. This combination of signals strengthens the case for a favorable price movement, indicating a potential buy opportunity.
Now, let’s move on to the exit part of this strategy.
Planning an exit
Since the indicators of this strategy are the relative strength index (RSI) and super trend, which typically indicate overbought and oversold zones, the exit should be made when the stock reaches an overbought zone. The super trend depicts the ongoing market trend, so the exit point should be when the trend reverses. The criteria for this strategy’s exit are detailed below.
- Relative strength index reaching value above 70 indicating overbought zone
- The closing price of the stock below the super trend level
- The price reaches its latest swing high or previously tested resistance level or forms a lower-low pattern.
Plan to exit this strategy if either of the mentioned instances occurs. The strategy will exit when the price reaches a swing high or a well-established resistance level, indicating a potential ceiling where selling pressure might increase.
Traditionally, these levels tend to push the price down, suggesting that the trend is weakening. Additionally, a lower-low pattern signifies a shift in trend direction, indicating that the bulls are losing control while bears are gaining momentum. Exiting at this point helps minimize losses or protect existing gains before a stronger downtrend develops.
Spotting a bearish candlestick pattern during our entry can confirm our exit. Patterns like the evening star or bearish marubozu, when combined with any of the above conditions, provide strong confirmation for exiting the trade.
Let’s look at the same example of IDBI Bank and how the stock received the exit signal.
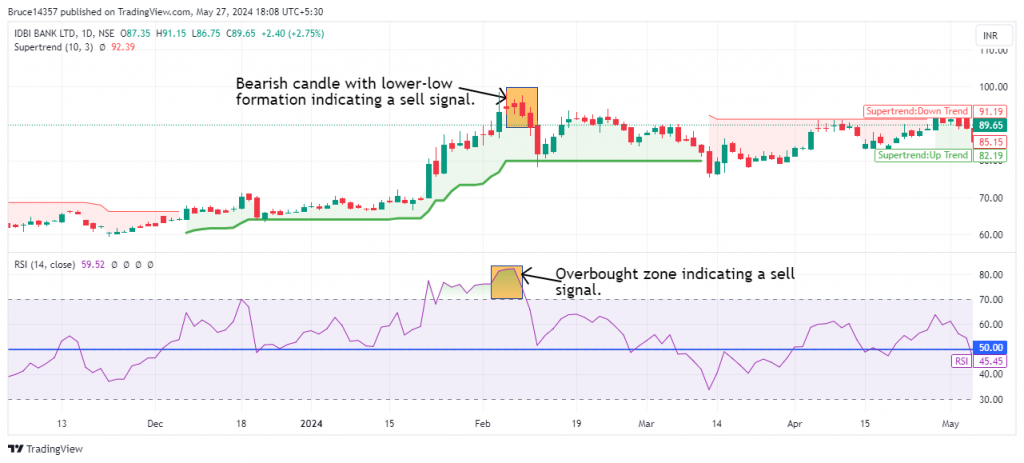
In the above chart of IDBI Bank, we can see a bearish candlestick pattern of three black crows, forming a lower-low pattern. The relative strength index is in the overbought zone, near 80. Additionally, IDBI Bank has just closed below the supertrend level, indicating that the stock has lost its momentum. All these signals, cumulatively, indicate an exit point for the stock price. This IDBI Bank example highlights multiple firm exit signals through a combination of RSI and supertrend.
Stop loss
In this strategy, we use the supertrend indicator, which moves along with the stock price, making it an ideal option to use as a trailing stop-loss.
Examples
Let’s look at another example of this strategy that triggered an entry into Tata Motors. In the chart below, we can see that at the time of entry, the relative strength index is greater than 50, and Tata Power closed above the supertrend, indicating bullishness in the market.
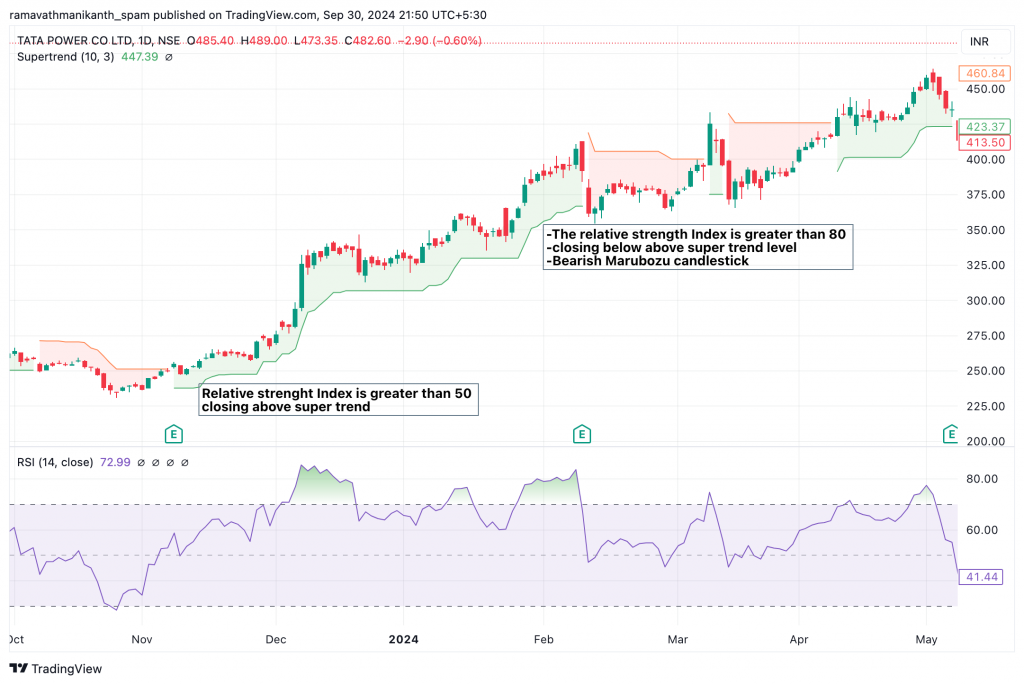
In the same example, Tata Power entry was triggered after 93 days, resulting in a 60% return. The exit was signaled when the relative strength index entered the oversold zone, accompanied by a significant bearish candlestick pattern in the chart, indicating a potential market shift. This was the precise time to exit the trade.
Things to keep in mind
There are some things to keep in mind while trading using this strategy. Let’s look at them one by one:
- This strategy is most suitable for trading on a daily time frame but can also be applied to positional trading strategies using weekly or monthly time frames. Trading this strategy on a weekly or monthly basis can yield good results as well. Finding the optimal time frame typically comes with experience and some trial-and-error to identify what works best.
- When we rely on a single trading strategy, we increase exposure to specific risks. Our entire portfolio could face significant losses if the strategy fails due to changing market conditions. Additionally, since market conditions vary, this strategy performs better in trending markets.
- By using multiple strategies, we can balance risk and enhance the overall resilience of our portfolio.
- It is essential to consider volume during both our entry and exit points to validate the strength of the move.