Chapter 7: Swing Trading Strategy for Mid and Small Caps
Overview
In this strategy, we aim to identify mid and small-cap stocks that are about to gain short-term momentum. Mid and small-cap stocks tend to experience sharper price movements, offering more opportunities for swing traders to capitalize on price swings.
We filter stocks using the relative strength index (RSI) and super trend indicators to identify trading opportunities. In this strategy, we use heiken ashi candlesticks and analyze them in a 2-hour time frame. These candlesticks help reduce false signals and provide a clearer view of market trends.
Indicators used in this strategy
In this strategy, we are going to use indicators that we are already familiar with: the Supertrend and relative strength index (RSI).
To recap, the Supertrend indicator identity. It is plotted on the price chart and provides indicators such as buy and sell signals based on price action and volatility. It helps determine the trend direction, entry, and exit points and improves the accuracy of the trading strategy.
The relative strength index (RSI) is a momentum oscillator that measures the speed and change of price movements. It ranges from 0 to 100, with values above 70 indicating overbought conditions and below 30 indicating oversold conditions.
Spotting an entry
Before applying the indicators to the chart, change the time frame to 2 hours and switch the chart to Heiken Ashi. Also, focus on selecting stocks from midcap and small-cap categories. Here are the criteria for taking an entry:
- 2-hour closing price exceeds the super trend or is within a 5% range of it
- Relative strength index value less than 20 or less than it
We are applying this strategy to the Heikin Ashi chart. The Heikin-Ashi chart is an average of the previous two regular candlesticks. We would be using it since it helps us with more explicit identification, reduced false signals, and more straightforward visual analysis of market direction and strength, which eventually helps us make better-informed decisions.
The Supertrend indicator works well in capturing recent volatile price moves, making it easier to spot trends and reversals. For swing traders, these more significant price fluctuations offer more opportunities.
If the above conditions are met, take an entry on that particular stock within 5% of the Supertrend value. This approach is more suitable for risk-takers, as it allows for the early capture of trends while accepting a higher level of risk.
For a risk-averse approach, it is better to enter a position only when the stock price exceeds the Supertrend level. To further confirm the trade, look for a bullish candlestick pattern, such as a bullish marubozu or a morning star, which provides strong confirmation for entering the trade.
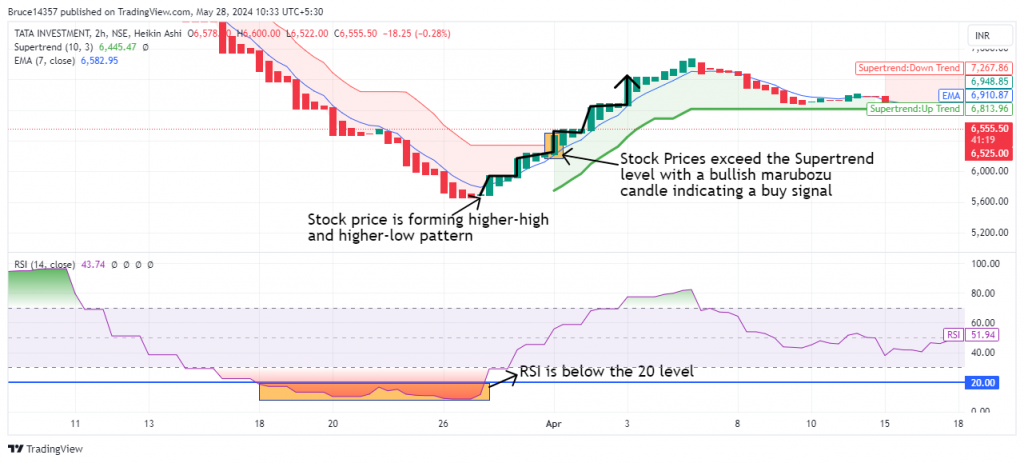
Here is the below example of Tata Investment Ltd.:

After a series of red candlesticks on the Heikin-Ashi chart, the stock showed a reversal with a bullish marubozu candlestick. The RSI has just crossed above 20, indicating it’s in the oversold zone. Additionally, our final technical indicator, the Supertrend, signals that Tata Investment is moving into a bullish trend. These are vital signs suggesting a perfect entry point into the market.
Planning an exit
This mid and small-cap momentum strategy can take an exit when either of the following things happens:
- Relative strength index value reaching 70
- Closing price below the level of Supertrend
- The price reaches its latest swing high or previously tested resistance level and forms a lower-low pattern.
The RSI indicates that the stock has reached its overbought zone, suggesting it has experienced a significant upward movement and may be due for a correction or pullback. This implies that the buying pressure might be exhausted, making it a signal to watch for potential reversals. Similarly, if the stock closes below the Supertrend level, it indicates that the current uptrend is weakening or possibly reversing.
If the price reaches the latest swing or previous resistance level, it may encounter selling pressure, leading to a potential reversal. If the price then forms a lower-low pattern after hitting this level, it indicates a shift in market sentiment from bullish to bearish. A lower-low pattern means the stock is starting to make lower peaks and troughs, suggesting that momentum is turning downward. Exiting at this point helps avoid further losses, as it confirms a weakening trend and the likelihood of a downtrend forming.
Spotting a bearish candlestick pattern, such as a bearish marubozu or evening star, in conjunction with the above exit conditions, provides additional confirmation for exiting the trade.

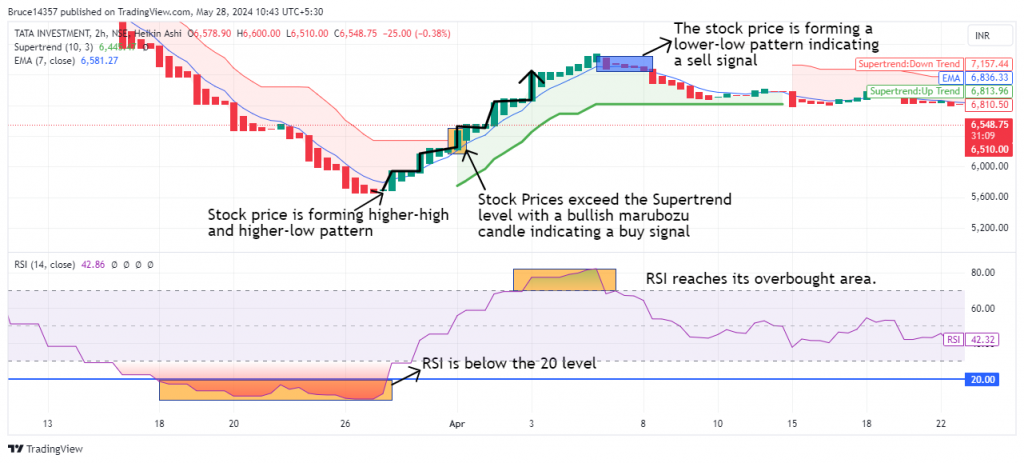
In the same example, we discussed earlier with Tata Investment, the stock has gradually formed a lower low on the chart, and the RSI has moved into the overbought zone, as shown in the highlighted part. The chart above marks multiple ideal exit points according to the strategy.
Stop loss
For this strategy, we’re using the Supertrend indicator as a stop loss because it dynamically adjusts with price movements. For example, in an uptrend, the Supertrend usually moves below the price, offering a trailing stop loss. This helps lock in profits while still allowing the trade some room to move with the trend.
Examples
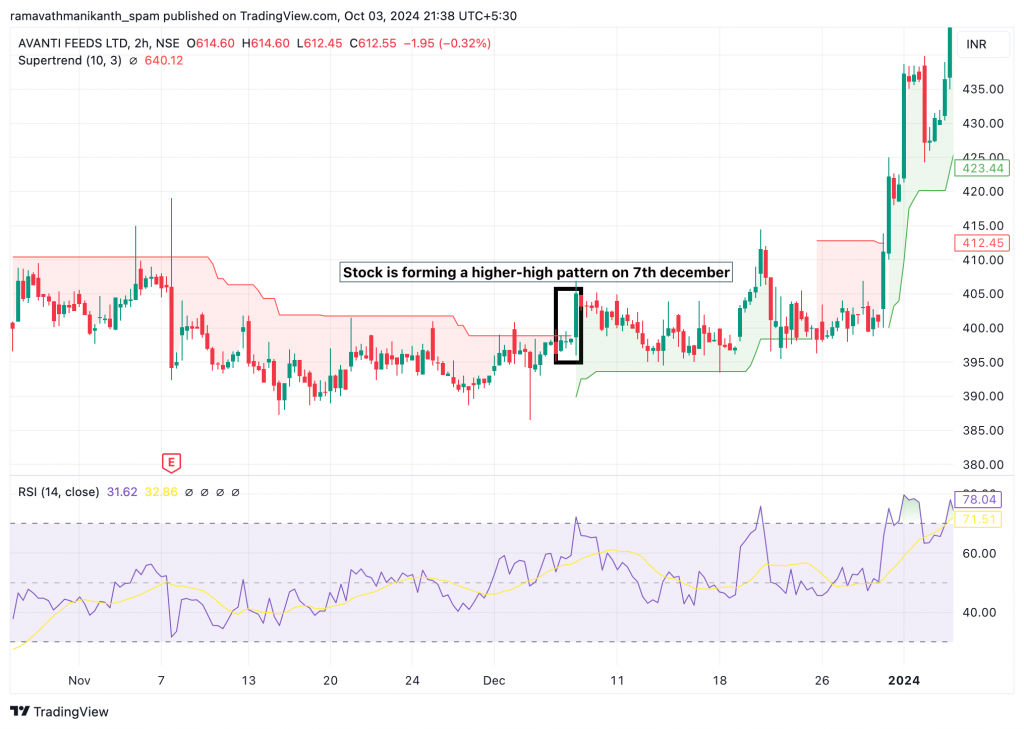
Let’s look at some examples for a better understanding. Below is the chart of Avanti Feeds. We apply our indicators to the chart. The primary conditions for the strategy are as follows: the Relative Strength Index (RSI) should be below 20, the stock price should break above the Supertrend (10,3) indicator, and the stock should form a higher-high pattern.

So, the buying price would be ₹401. After that, as per our strategy, the stop loss should be set using the Super Trend indicator as a trailing stop loss. The chart below shows an exit around ₹570, which is approximately a 50% return—considered excellent in the stock market. Below is the pictorial representation.

Things to keep in mind
- The strategy is flexible across various time frames, including 2-hour, daily, 1-hour, and 3-hour charts, with indicators like Supertrend and RSI providing reliable buy and sell signals based on trend direction.
- To find the optimal time frame, traders can rely on trial-and-error or backtesting using tools like TradingView. However, applying this strategy to only a portion of the portfolio is advisable, given the potential drawbacks of any single approach.
- In the midcap and small-cap space, regular profit booking and stop-loss adjustments are crucial due to increased volatility and sensitivity to market news.
For example, when the Reserve Bank of India put a temporary freeze on Yes Bank due to deteriorating financial health, limiting withdrawals to ₹50,000 per account, the stock experienced a sharp decline. In a single day, it plummeted 56% from its opening price, leading to substantial losses. The chart below illustrates this event.

Imagine we had taken a trade on Yes Bank, but we missed seeing that day, and we would have faced severe loss. So, while trading with this strategy, it’s essential to book profits and trail-stop losses.
Volume helps confirm this strategy in any time frame. We should also consider trading volumes when using a mid and small-cap momentum strategy.