Chapter 6: Multiple Candlestick Patterns
Continuing from the previous chapter on double candlesticks, where we discussed engulfing, harami, and other patterns that help us enter the market, we now move on to multiple candlestick patterns. These patterns involve analyzing three or more candlesticks, but we will focus on just three candlesticks to understand the market direction better.
You might wonder why it is necessary to analyze three candlesticks. The reason is simple: the more candlesticks, the more solid and reliable the trend.
In this chapter, we will explore patterns like morning and evening stars, three black crows and soldiers, three inside up and down, and three rising and falling methods. These patterns give us a clearer picture of the market and help us make better trading decisions.
Let’s look at the first multiple candlestick pattern, the morning star.
Morning Star
How is a morning star pattern formed?
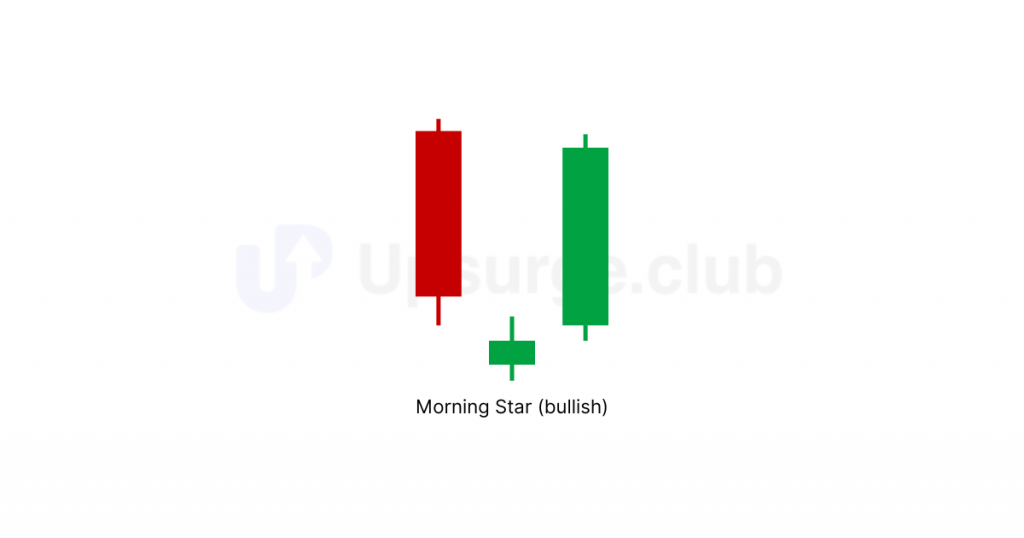
A bullish candlestick pattern generally formed at the bottom of a downtrend, the morning star consists of three candlesticks.
To improve our understanding, we will denote the first candle as C1, the second candle as C2, the third candle as C3, and so on.
- The first candle (C1) is bearish, with the closing price near the previous candle’s low.
- The second candle (C2) is a doji, having a negligible body. It should form below the low of the first candle
- The third candle (C3) should be bullish and close higher than the high of the first candle (C1), like a bullish engulfing candle.
Here’s a pictorial representation of the same:
Let’s break down the same.
- The market is in a downtrend, with the bears in control, forming successive new lows.
- On day 1 (C1), the market forms a long red candle, showing selling acceleration.
- On day 2 (C2), the market forms a doji or spinning top, indicating indecision and causing restlessness among the bears who expected another down day.
- On day 3 (C3), a green candle forms, closing above C1’s red candle opening.
Buying persists throughout C3, recovering all losses of C1. - The bullishness on C3 will likely continue, suggesting buying opportunities in the market.
How to trade a morning star pattern?
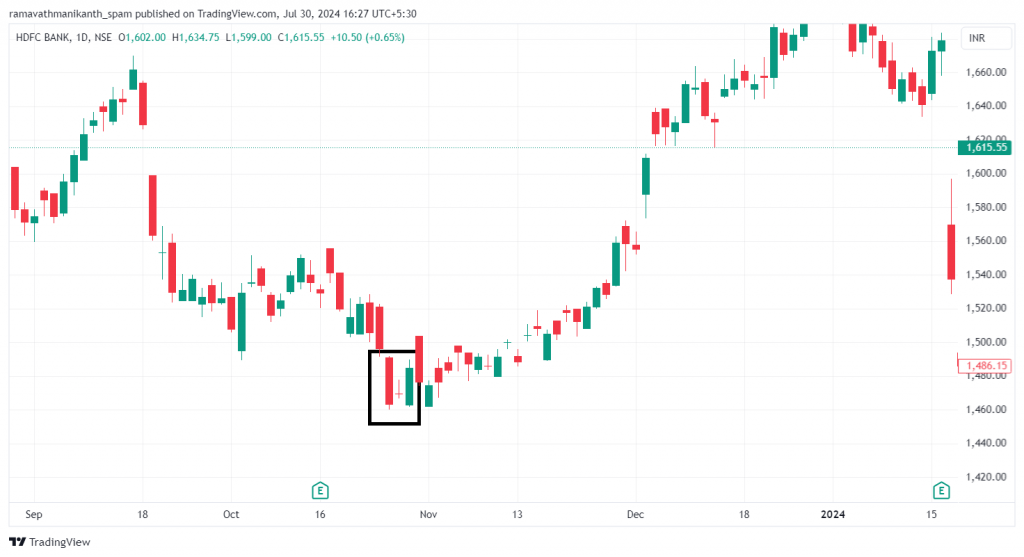
The three characteristics of a morning star are found in the HDFC Bank chart below.
Here’s how to trade it.
- Entry: Enter a long position at the candle’s opening that forms after the morning star pattern.
- Confirmation: A morning star is more reliable in a downtrend if C3 (the green candle) closes above the midpoint of C1 (the red candle), indicating a potential bullish reversal.
- Stop Loss: Place a stop loss at the low of C2 (the doji) to limit potential losses if the trade goes against you.
Let’s now move on to the evening star.
Evening Star
How is an evening star pattern formed?
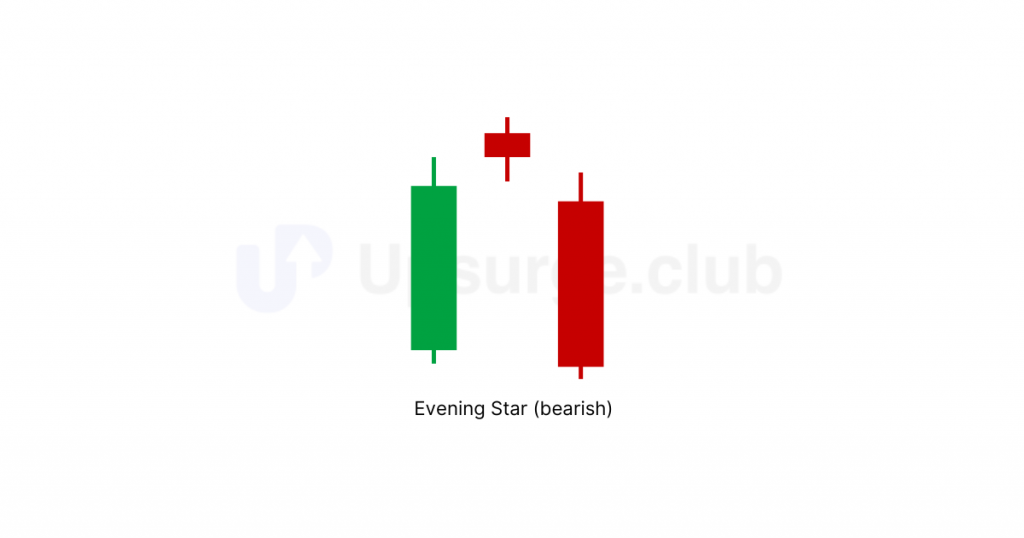
This candlestick pattern signifies a potential bearish reversal, often forming at the end of an uptrend. It indicates that buyers have lost control and bears have made their entry. It also consists of 3 candlesticks.
Here’s how it is constructed:
- The first candle (C1) is bullish, with the closing price near the previous candle’s high.
- The second candle (C2) is a doji with a negligible body, indicating indecision. This forms above C1.
- The third candle (C3) is bearish and closes lower than the first candle (C1), similar to a bearish engulfing candle.
Here is a pictorial representation of the same:
Let’s look at the psychology behind the formation of an evening star pattern.
- The market is in an uptrend, with the bulls in control and successive new highs.
- On day 1 (C1), the market forms a long green candle, showing buying acceleration.
- On day 2 (C2), the market forms a doji, signaling indecision and causing restlessness among the bulls who expected another up day.
- On day 3 (C3), a red candle forms, closing below C1’s green candle opening.
Selling persists throughout C3, erasing all gains of C1. - The bearishness on C3 will likely continue, suggesting selling opportunities in the market.
How to trade an evening star pattern?
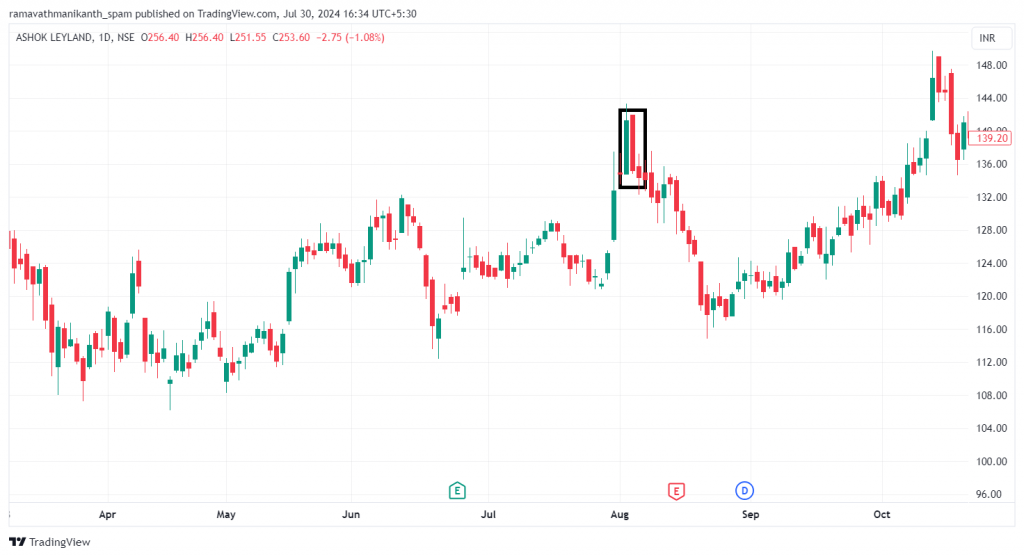
Here is a picture of the evening star pattern forming on the daily chart of Ashok Leyland, making it clearer:
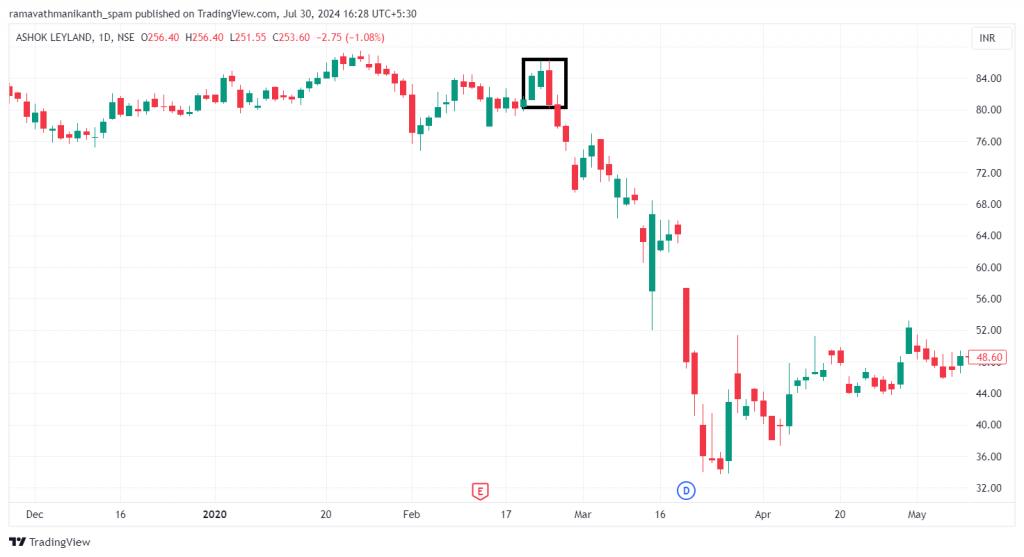
As you can see, after the formation of the evening star, Ashok Leyland stock has faced a significant downtrend. Here’s how one can trade it:
- Entry: Enter a short position at the candle’s opening that forms after the evening star pattern.
- Confirmation: An evening star is more reliable in an uptrend if C3 (the red candle) closes below the midpoint of C1 (the green candle), indicating a potential bearish reversal.
- Stop Loss: Place a stop loss above the high of C2 (the doji) to limit potential losses if the trade moves against you.
Three Black Crows
How is the three black crows pattern formed?
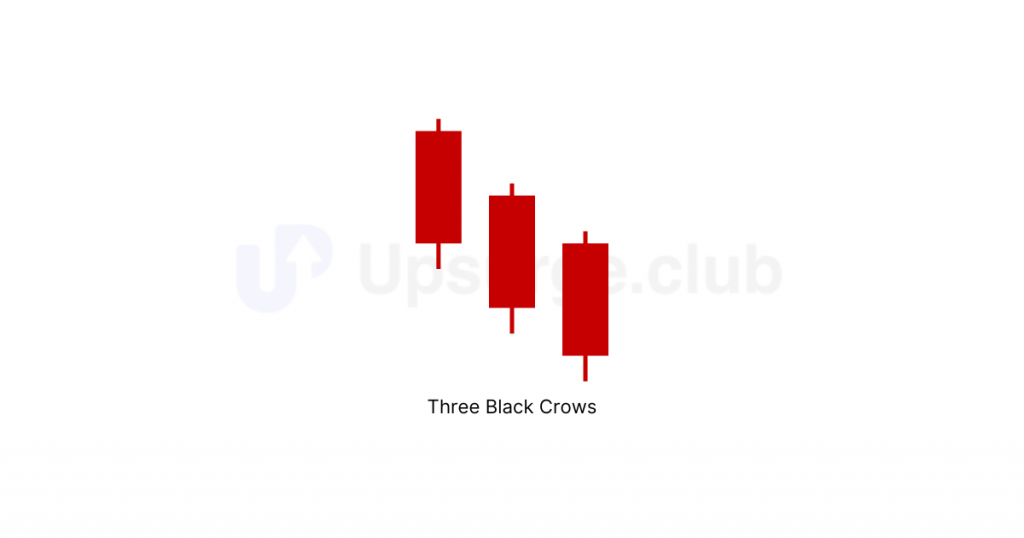
The three black crows pattern is a bearish reversal pattern formed when bearish forces come into action and cause prices to fall for three consecutive days.
Pre-requisites for the formation of three black crows are:
- The first candle (C1) is bearish, with the closing price near the previous candle’s low.
- The second candle (C2) is also bearish, opening within the body of C1 and closing lower, indicating continued selling pressure.
- The third candle (C3) is also bearish, opening within the body of C2 and closing lower, confirming the bearish reversal and strong presence of sellers.
Hence, it is named three black crows because the three bearish candles resemble three ominous crows in a row, indicating increasing selling pressure. Here is a pictorial representation of the same:
Sentiment behind the formation of three black crows:
- The market is in an uptrend, with the bulls in control and successive new highs.
- On day 1 (C1), the market forms a long red candle, signaling a strong shift in sentiment.
- On day 2 (C2), another bearish candle forms, opening within C1’s body and closing lower, indicating continued selling pressure.
- On day 3 (C3), a third bearish candle forms, opening within C2’s body and closing near its low, confirming the bearish reversal.
Selling persists throughout C3, erasing gains from the uptrend. - The bearishness suggested by the three black crows pattern will likely continue, indicating selling opportunities in the market.
Let’s uncover how to trade the three black crows.
How to trade the three black crows pattern?
Here’s how this pattern can be traded:
- Entry: Enter a short position at the candle’s opening (C4) that forms after the three black crows pattern.
- Confirmation: The three black crows pattern is more reliable if the third red candle (C3) closes near its low, indicating strong bearish momentum.
- Stop Loss: Place a stop loss above the high of C1 (the first red candle) to limit potential losses if the trade moves against you.
You can notice the pattern forming on the daily chart of HDFC Bank:
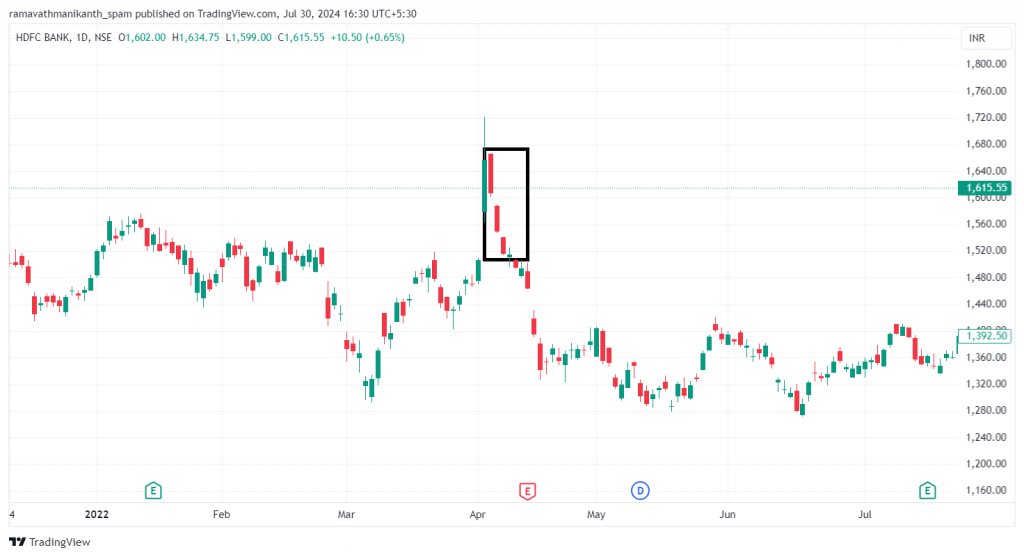
OHLC of the candle are:
Data | Open | High | Low | Close |
First candle | 1666 | 1666 | 1602 | 1608 |
Second candle | 1557 | 1589 | 1547 | 1550 |
Third candle | 1541 | 1541 | 1513 | 1516 |
Based on the above data
- Entry: Enter a short position just after the third candle (C3).
- Confirmation: We have confirmation from the three black crows pattern formed in an uptrend.
- Stop Loss: Place a stop loss above the high of the first candle (C1), at 1666.
Three White Soldiers
How is the three white soldiers pattern formed?
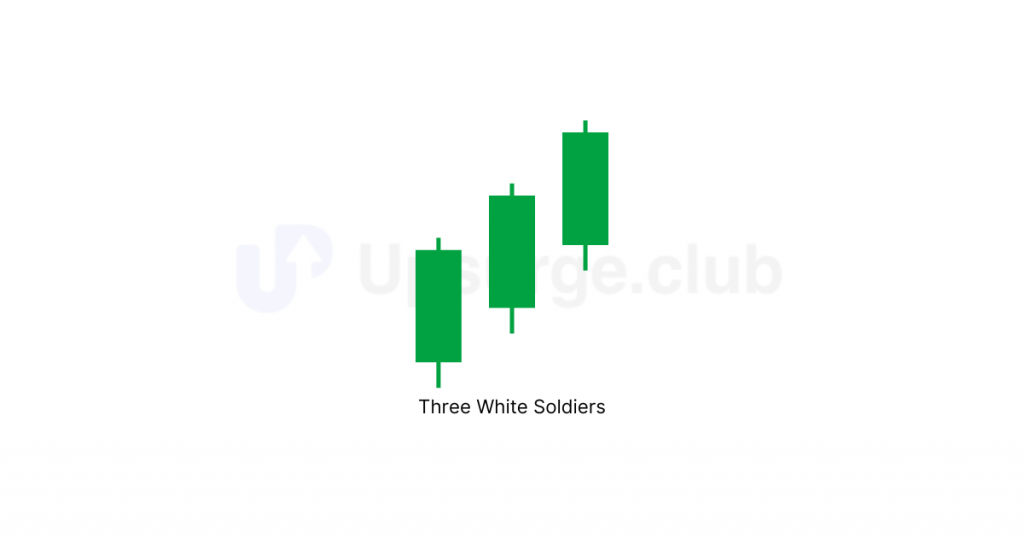
This multiple candlestick pattern, also known as three advancing white soldiers, helps predict a reversal from a downtrend to an uptrend. It is often found after a long downtrend, changing market sentiment to bullish.
The pre-requisites for the formation of this pattern are:
- The first candle (C1) is bullish, with the closing price near the previous candle’s high.
- The second candle (C2) is also bullish, opening within the body of C1 and closing higher, indicating continued buying pressure.
- The third candle (C3) is bullish as well, opening within the body of C2 and closing higher, confirming the bullish reversal and strong presence of buyers.
Here is a pictorial representation of the same:
Market sentiment driving the formation of three white soldiers:
- The market is in a downtrend, with the bears in control and successive new lows.
- On day 1 (C1), the market forms a long green candle, signaling a strong shift in sentiment.
- On day 2 (C2), another bullish candle forms, opening within C1’s body and closing higher, indicating continued buying pressure.
- On day 3 (C3), a third bullish candle forms, opening within C2’s body and closing near its high, confirming the bullish reversal.
- Buying persists throughout C3, reversing losses from the downtrend.
- The bullishness suggested by the three white soldiers pattern will likely continue, indicating buying opportunities in the market.
Let’s learn how to trade this multiple-candlestick pattern.
How to trade the three white soldiers pattern?
Here’s how a trade can be taken:
- Entry: Enter a long position at the candle’s opening (C4) that forms after the three white soldiers pattern.
- Confirmation: The three white soldiers pattern is more reliable if the third green candle (C3) closes near its high, indicating strong bullish momentum.
- Stop Loss: Place a stop loss below the low of C1 (the first green candle) to limit potential losses if the trade moves against you.
Three Inside Up
How is the three inside up pattern formed?
The three inside up is a type of reversal pattern. This pattern requires a specific sequence of individual candles, indicating that the current trend has lost momentum and is likely to change direction.
How is the three inside up pattern formed?
The pre-requisites for the formation of three inside up pattern are:
- The pattern is typically found at the bottom of a downtrend.
- The first candle (C1) is bearish, with the closing price near the previous candle’s low.
- The second candle (C2) is bullish, opening within the body of C1 and closing above 50% of C1’s body length, indicating a potential shift in momentum.
- The third candle (C3) is bullish as well, opening within the body of C2 and closing higher, confirming the bullish reversal and strong presence of buyers.
Here is an image of the three inside up candlestick pattern:

The psychology behind the formation of three inside up:
- The market is in a downtrend, with the bears in control and successive new lows.
- On day 1 (C1), the market forms a long red candle, maintaining a bearish sentiment.
- On day 2 (C2), a bullish candle forms, opening within C1’s body and closing above its midpoint, signaling a potential shift in momentum.
- On day 3 (C3), another bullish candle forms, opening within C2’s body and closing higher, confirming the bullish reversal.
- Buying persists throughout C3, reversing losses from the downtrend.
- The bullishness suggested by the three inside up is likely to continue.
How to trade the three inside up pattern?
Since it’s a bullish reversal candlestick, we should look for buying opportunities in the market. The trade setup will look like this:
- Entry: Enter a long position at the candle’s opening (C4) that forms after the three inside up pattern.
- Confirmation: The three inside up pattern is more reliable if the third green candle (C3) closes near its high, indicating strong bullish momentum.
- Stop Loss: Place a stop loss below the low of C1 (the first red candle) to limit potential losses if the trade moves against you.
Here is a formation of the three inside up candlestick pattern on the daily chart of Wipro:
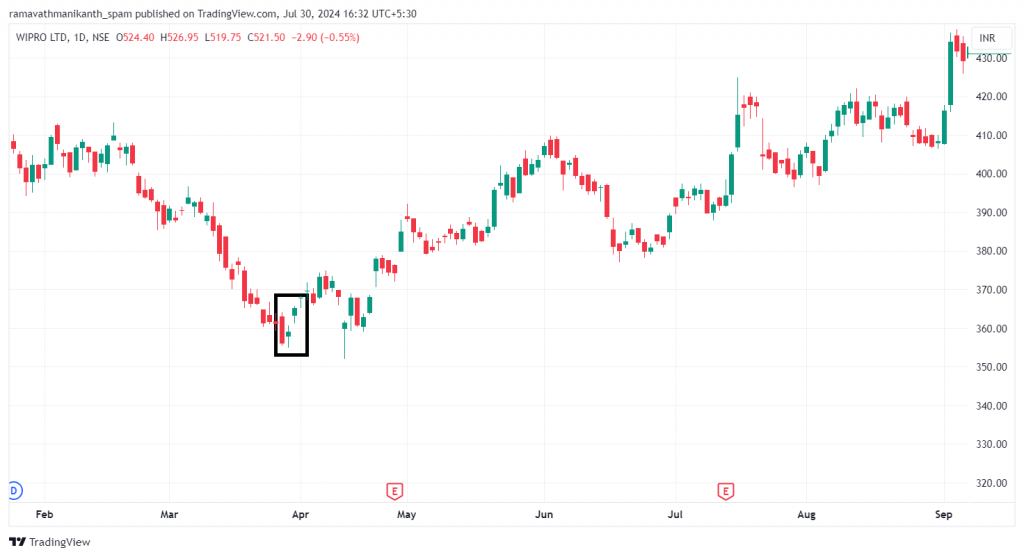
First, the stock was in a downtrend. After that, the three inside up pattern are formed: the middle candle, C2, managed to cover half of C1, and the third candle closed above the first candle, C1.
OHLC data of the above is as follows:
Data | Open | High | Low | Close |
First candle | 363 | 364 | 355 | 356 |
Second candle | 358 | 360 | 355 | 359 |
Third candle | 363 | 365 | 361 | 365 |
Here’s how it can be traded:
- Entry: Enter a long position just after the third candle (C3), i.e., on the candle forming after C3.
- Confirmation: For a stronger confirmation of the trend change, you can wait for the candle after C3 to open higher than C3.
- Stop Loss: Place a stop loss below the low of the first candle (C1), which is 355.
Three Inside Down
How is the three inside down pattern formed?
The opposite of the three-inside-up candlestick pattern is the three-inside-down pattern, which forms after an uptrend and is a potential bearish reversal pattern.
The pre-requisites for the formation of three inside down are:
- The pattern is typically found at the top of an uptrend.
- The first candle (C1) is bullish, with the closing price near the previous candle’s high.
- The second candle (C2) is bearish, opening within the body of C1 and closing below 50% of C1’s body length, with a body twice the size of C1.
- The third candle (C3) is bearish as well, opening within the body of C2 and closing lower.
Here is a pictorial representation:

Market sentiment driving the formation of the three inside down pattern:
- The market is in an uptrend, with the bulls in control and successive new highs.
- On day 1 (C1), the market forms a long green candle, signaling a strong bullish sentiment.
- On day 2 (C2), a bearish candle forms, opening within C1’s body and closing lower, indicating a shift in sentiment.
- On day 3 (C3), a second bearish candle forms, opening within C2’s body and closing near its low, confirming the bearish reversal.
- Selling persists throughout C3, reversing gains from the uptrend.
- The bearishness suggested by the three inside down is likely to continue.
How to trade the three inside down pattern?
Given the bearish reversal indicated by the three inside down pattern, traders should consider potential short-selling opportunities. The trading setup will look like this:
- Entry: Enter a short position at the candle’s opening (C4) that forms after the three inside down pattern.
- Confirmation: The three inside down pattern is more reliable if the third red candle (C3) closes near its low, indicating strong bearish momentum.
- Stop Loss: Place a stop loss above the high of C1 (the first green candle) to limit potential losses if the trade moves against you.
As you can see from the above chart, the second candle, C2, is closing more than 50% of the first candle, C1, indicating strong selling momentum. Hence, we should look out for shorting opportunities.
Now, let’s look at the rising three methods & falling three methods candlestick patterns.
Rising Three Methods
How is the rising three methods pattern formed?
We have seen many reversal candlestick patterns up until now. However, the rising three methods pattern is a bullish continuation pattern. This means the current uptrend is likely to continue in the near future. Consisting of five candlesticks, this pattern supports the ongoing trend instead of signaling a reversal.
The pre-requisites for formation are:
- The pattern is typically found in the middle of an uptrend.
- The first candle (C1) is bullish, with a strong upward move.
- The second, third, and fourth candles (C2, C3, and C4) are small bearish candles, staying within the range of C1.
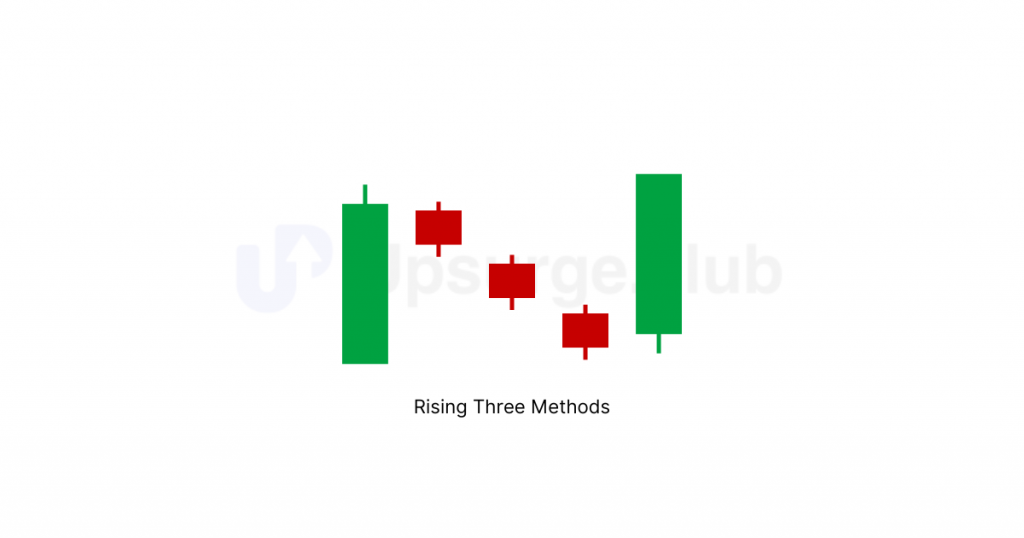
- The fifth candle (C5) is bullish again, closing above the high of C1, confirming the continuation of the uptrend.
Here is a pictorial representation of the rising three methods pattern. This pattern contains five candlesticks, as you can see below:
The mindset that creates the rising three methods:
- The market is in an uptrend, with the bulls in control and successive new highs.
- On day 1 (C1), the market forms a long green candle, signaling strong bullish sentiment.
- On day 2 (C2), a small bearish candle forms, opening within C1’s body and closing lower, indicating a temporary pause in the uptrend.
- On day 3 (C3), another small bearish candle forms, opening within C2’s body and closing lower, maintaining the pause in bullish momentum.
- On day 4 (C4), a third small bearish candle forms, opening within C3’s body and closing lower, continuing the pause.
The bullishness suggested by the rising three methods pattern is likely to continue. The small candlesticks between the two long bullish candlesticks are typically indecision candles, indicating a temporary pause in the uptrend before it resumes. All the small candles don’t need to be bearish; what matters is that they have small bodies and close below the previous candle’s close.
Let’s look at how we can trade the rising three methods pattern.
How to trade the rising three methods pattern?
We should focus on buying opportunities with the rising three methods being a bullish continuation pattern. The trade setup will look like this:
- Entry: Enter a long position at the candle’s opening (C6) that forms after the rising three methods pattern.
- Confirmation: The rising three methods pattern is more reliable if the fifth green candle (C5) closes near its high, indicating strong bullish momentum.
- Stop Loss: Place a stop loss below the low of C2 (the second small bearish candle) to limit potential losses if the trade moves against you.
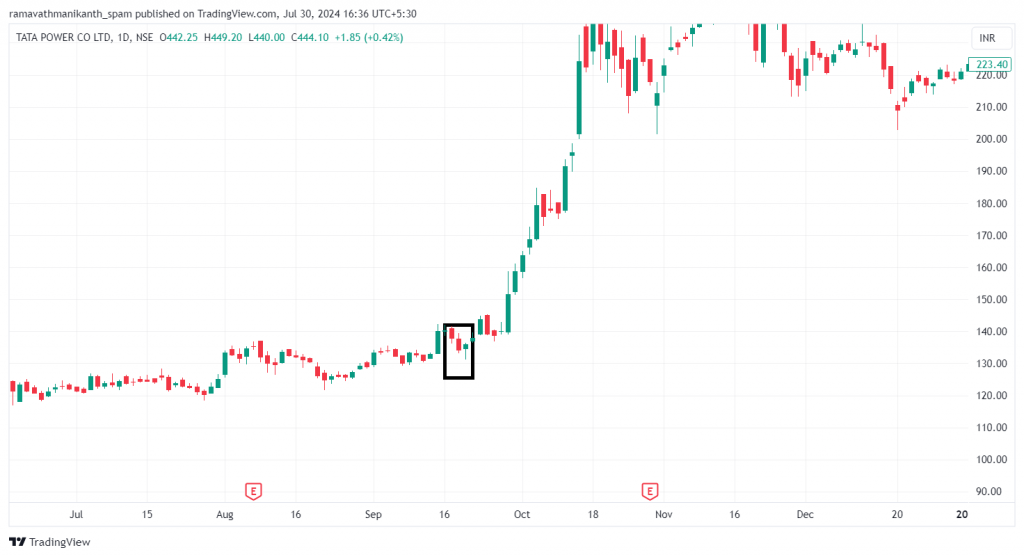
Look at how the uptrend has continued after the formation of the rising three methods pattern on the chart of Tata Power:
Falling Three Methods
How is the falling three methods pattern formed?
The falling three methods pattern shows a bearish trend. Bulls briefly interrupt with three short bullish candles, causing a pause. However, the bears quickly regain control, and a long bearish candle at the end closes below the first candle, completing the pattern.
The pre-requisites for formation are:
- The pattern occurs within a bearish trend.
- The first candle (C1) is a long red candle, showing strong selling pressure.
- The next three candles (C2, C3, C4) are small green candles confined within the range of C1, indicating a brief pause.
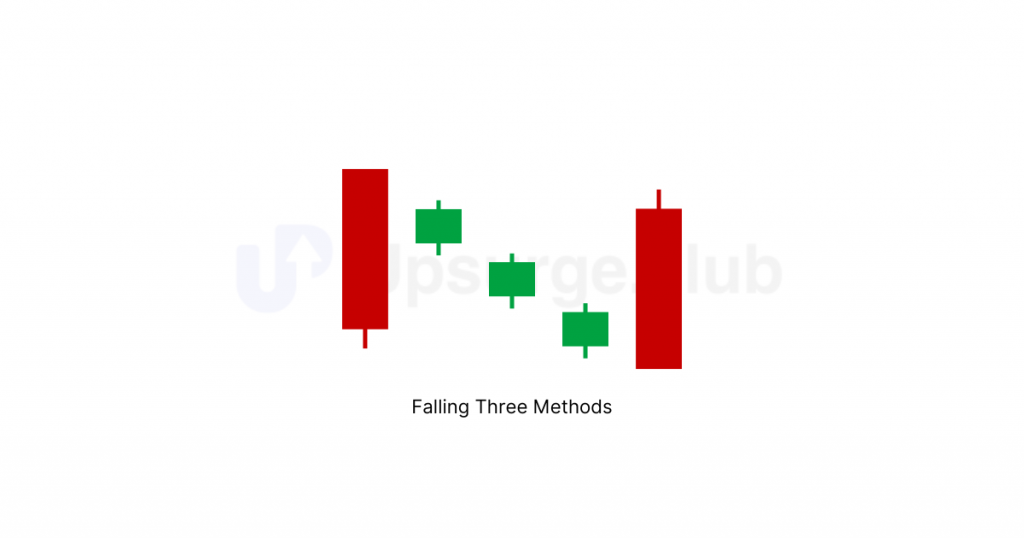
- The fifth candle (C5) is a long red candle that closes below the low of the first candle (C1), confirming the continuation of the bearish trend.
Here’s a pictorial representation:
The psychology behind the formation of the falling three-methods pattern works like this: The pattern starts with a strong red candle showing bearish control. Three small green candles follow, representing a brief attempt by bulls to push prices up. However, a final strong red candle indicates the bears have regained control, continuing the downtrend.
How to trade the falling three methods pattern?
A trade using the falling three methods can be taken as follows:
- Entry: Enter a short position at the candle’s opening (C6) that forms after the falling three methods pattern.
- Confirmation: The falling three methods pattern is more reliable if the fifth red candle (C5) closes near its low, indicating strong bearish momentum.
- Stop Loss: Place a stop loss above the high of C2 (the second small green candle) to limit potential losses if the trade moves against you.
Summary
- The morning star is a bullish reversal pattern at the bottom of a downtrend. It consists of a bearish candle, a doji, and a bullish candle.
- The evening star is a bearish reversal pattern at the peak of an uptrend. It has a bullish candle, a doji, and a bearish candle.
- The three black crows pattern has three consecutive bearish candles, indicating a strong bearish reversal after an uptrend.
- The three white soldiers pattern has three consecutive bullish candles, indicating a strong bullish reversal after a downtrend.
- The three inside-up patterns at the bottom of a downtrend involve a bearish candle, followed by a bullish candle closing above its midpoint, and another bullish candle.
- The three inside down patterns at the top of an uptrend involve a bullish candle, followed by a bearish candle closing below its midpoint, and another bearish candle.
- The rising three methods pattern, a bullish continuation pattern, has a long bullish candle, three small bearish candles within its range, and a final bullish candle closing above the first candle’s high.
- The falling three methods pattern, a bearish continuation pattern, has a long bearish candle, three small bullish candles within its range, and a final bearish candle closing below the first candle’s low.