Chapter 5: Two Candlestick Patterns
Two is better than one, even when it comes to candlestick patterns. In a double candlestick pattern, we analyze two candlesticks to make a trading decision. This means the trading opportunity unfolds over a minimum of two trading sessions.
This chapter will focus on some important two candlestick patterns: engulfing, harami, and tweezer candlestick patterns.
Engulfing Pattern
The first double candlestick pattern we are going to talk about is the engulfing pattern. As we have discussed earlier, double candlesticks require two candlesticks; the first candle with a relatively tiny body, and the second candle’s body completely engulfs the previous one and closes in the opposite direction of the trend. The engulfing pattern is a reversal pattern: it’s bullish at the end of a downtrend and bearish at the end of an uptrend.
Let’s look at their pictorial representation.
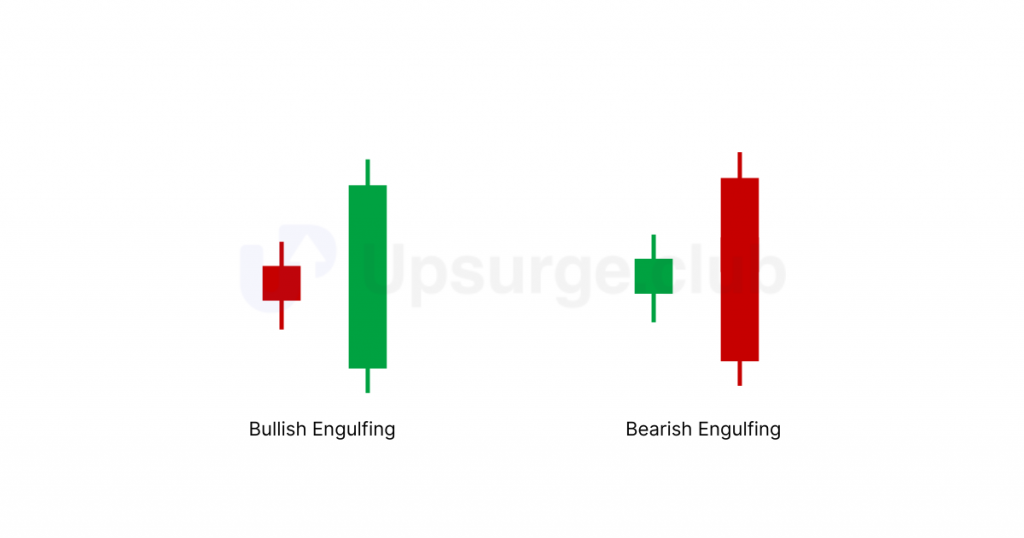
Bullish Engulfing Pattern
How does a bullish engulfing pattern form?
A bullish engulfing candlestick pattern occurs when it is found at the bottom of a downtrend. It is a potentially bullish reversal candle, which means that people tend to buy it after its formation.
The pre-requisites for a bullish engulfing candle are:
- The prior trend should be a downtrend.
- The first candle should be bearish, re-confirming the bearishness in the market.
- The second candle should be bullish, with a body long enough to engulf the whole previous candle, including its wicks.
Here is an image of a bullish engulfing candle forming at the bottom of a downtrend:
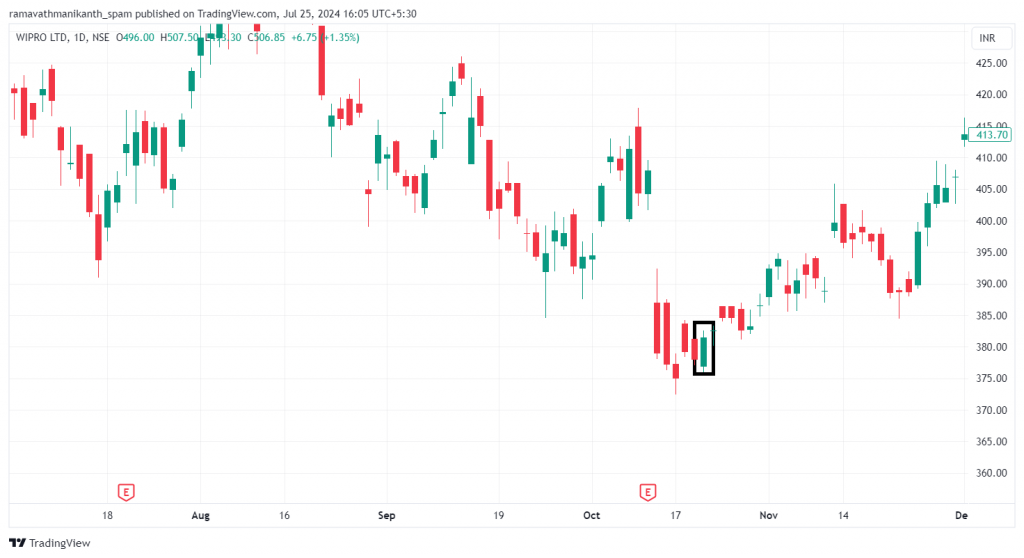
This is how it works:
- The market is in a downtrend, dominated by sellers, as shown by bearish (red) candles.
- A large bullish (green) candle forms, completely engulfing the previous bearish candle, signaling a solid shift in control to buyers.
- The bullish engulfing candle indicates strong buying interest and a change in market sentiment from bearish to bullish.
- This pattern suggests a potential reversal of the downtrend, with buyers gaining strength and the market moving upwards.
How to trade a bullish engulfing pattern?
Bullish engulfing is a potential bullish reversal trend that signals bullish sentiment in the market. The trading plan would be:
- Entry: Enter the trade at the opening price of the next candle, i.e., at the candle that forms just after the formation of the engulfing candle.
- Confirmation: An entry is confirmed if it is found after a downtrend, the second candlestick is bullish and engulfs the previous bearish candle, and the candlestick formed after the pattern closes higher than the bullish candle’s high, indicating a potential bullish reversal.
- Stop loss: Place the stop loss just below the low of the bullish engulfing pattern. This helps to minimize risk in case the pattern fails.
You must remember how to set a target, as explained at the end of the single candlestick chapter. If you need a refresher, give it a quick read here. The same applies to 2 candlestick patterns, too.
Assuming we are going long on Tata Motors, where a bullish engulfing pattern is formed.
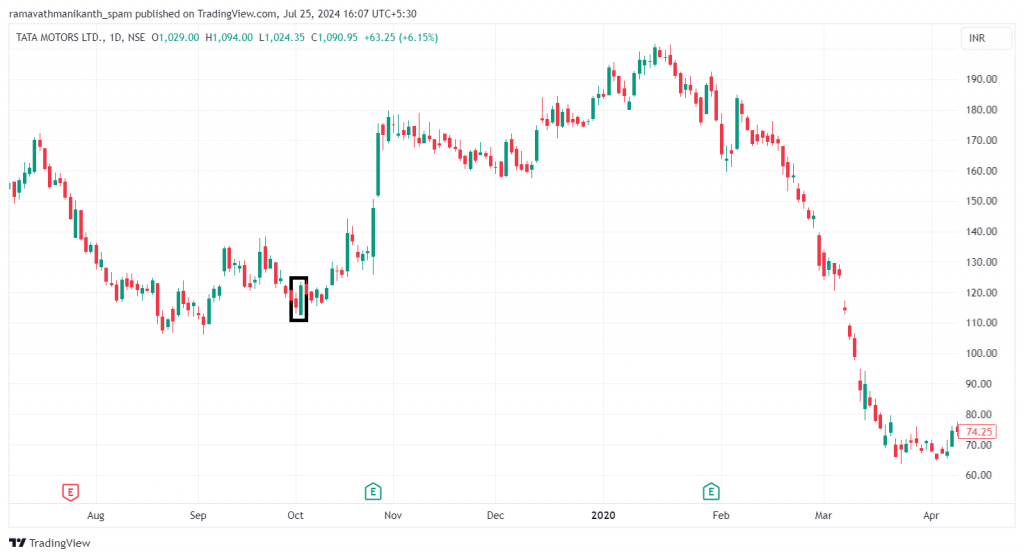
- Entry for the above bullish engulfing candle is the opening of the following candle, which is at 122.80.
- Stop loss would be low of the previous candle, which would be at 113.00.
- The target is to aim for a risk-to-reward ratio of 1:1.5.
There often needs to be more clarity about whether a bullish engulfing pattern needs to engulf the entire previous candle, including the wicks, or just the natural body. If the natural body is engulfed, it can be considered a bullish engulfing pattern. Some may disagree, but what truly matters is how effectively you develop your trading skills with this pattern.
Bearish Engulfing Pattern
How does a bearish engulfing pattern form?
A bearish engulfing pattern signals bearishness in the market and indicates a potential reversal from an uptrend to a downtrend. It forms during an uptrend and suggests that the market sentiment has shifted, opening the door for a downward move.
The pre-requisites for a bearish engulfing candle are:
- The prior trend should be an uptrend.
- The first candle should be bullish, reconfirming the bullishness in the market.
- The second candle should be bearish, and long enough to engulf the green candle.
Here is a chart that has a bearish engulfing pattern forming at the end of an uptrend:
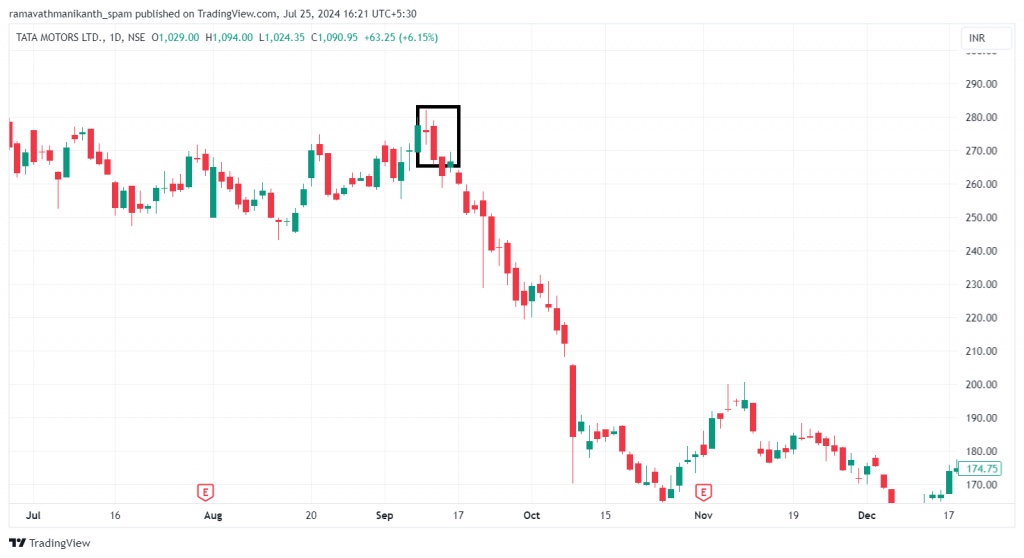
The above chart shows a bearish candle formed after an uptrend, totally covering the previous bullish (green) candle. There is a significant drop in the market after the occurrence of a bearish engulfing pattern.
- The market is in an uptrend, dominated by buyers, as shown by bullish (green) candles.
- A significant bearish (red) candle forms, completely engulfing the previous bullish candle, signaling a solid shift in control to sellers.
- The bearish engulfing pattern indicates intense selling pressure and a change in market sentiment from bullish to bearish.
- This pattern suggests a potential reversal of the uptrend, with sellers gaining strength and the market moving downwards.
Now, let’s see how we should trade the bearish engulfing pattern.
How to trade a bearish engulfing pattern?
- Entry: Enter the trade at the opening price of the next candle, i.e., at the candle that forms just after the formation of the engulfing candle.
- Confirmation: A bearish engulfing pattern is confirmed if it occurs after an uptrend, the bearish candle completely engulfs the previous bullish candle, and the next candle closes lower than the low of the bearish engulfing candle, signaling a potential bearish reversal.
- Stop Loss: Set the stop loss at the high of the bearish engulfing candle to minimize risk if the pattern fails.
Let’s look at how a trade in Ashok Leyland enflolds using the bearish engulfing candlestick pattern.
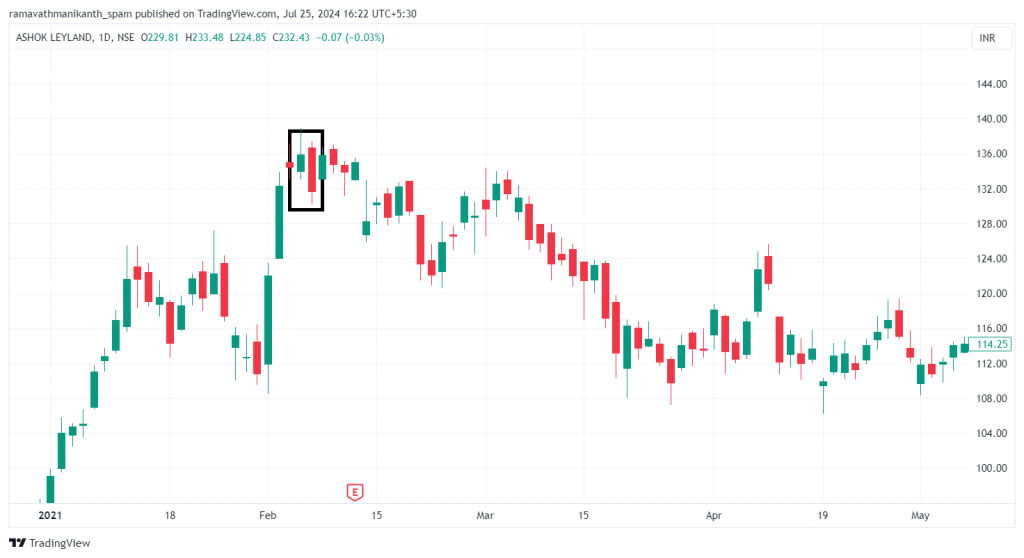
- Entry: Enter the trade at the opening of the next candle, which is 176.40.
- Stop Loss: Set the stop loss at the high of the bearish engulfing candle, which is 177.00.
- Target: Aim for a target with a risk-to-reward ratio of 1:1.5 based on the entry price.
Harami Pattern
Harami’ in Japanese means ‘pregnant’. Being a two-candlestick pattern, the first candle is significant and reflects strong market sentiment, either bullish or bearish, depending on the current trend. The second candle is smaller and has its body completely engulfed within the first candle’s body, indicating a potential reversal in the trend.
The below image shows a harami candlestick pattern.
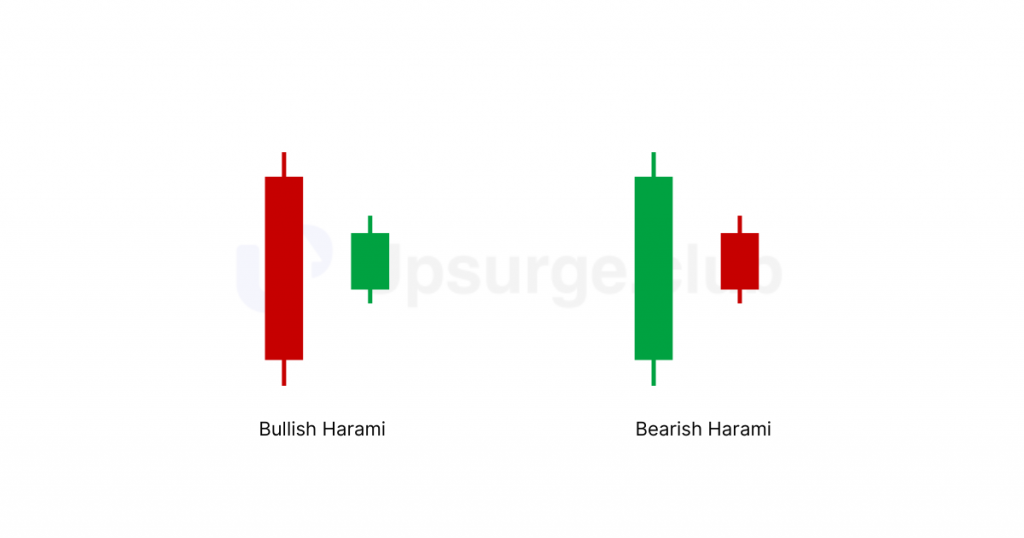
Here, you can see that the previous candle completely covers the second candle. Now, let’s talk about both harami candlestick patterns – bullish harami and bearish harami.
Bullish Harami Pattern
How does a bullish harami pattern form?
The harami pattern is a potential reversal signal that signifies a change in market sentiment.
The pre-requisites for a bullish harami pattern are:
- The prior trend should be a downtrend.
- The first candle should be bearish, confirming the bearishness in the market.
- The second candle should be bullish and small, fitting within the body of the first red candle.
Here is the formation of a bullish harami candlestick pattern, forming at the bottom of a downtrend.
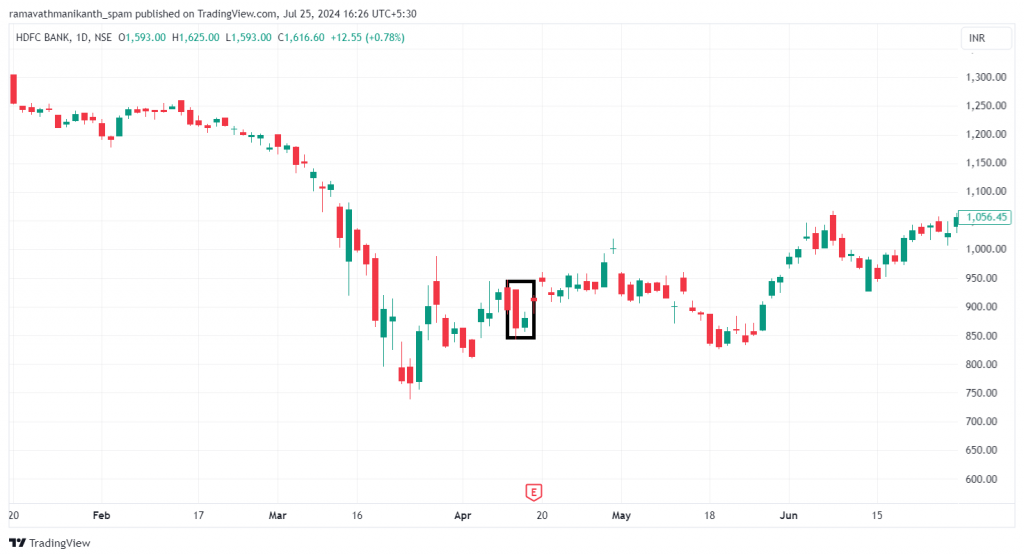
The psychology behind a bullish harami candlestick pattern is:
- Initially, the market was in a downtrend, dominated by sellers, which was reflected by the large bearish (red) candle.
- The sizeable bearish candle confirms the ongoing bearish sentiment in the market.
- The following day, a smaller bullish (green) candle forms within the body of the previous red candle.
- This smaller candle represents a period of indecision (doji candles can be formed here) where the selling pressure has weakened, and buyers are starting to enter the market.
- The green candle’s appearance suggests buyers are becoming more active, although their presence is not strong enough to reverse the trend completely.
- The pattern indicates that the downtrend might be losing its momentum. If buyers continue to gain strength, a reversal from bearish to bullish could be on the horizon.
How to trade a bullish harami pattern?
With an understanding of the bullish harami candlestick pattern, let’s talk about trading it. This pattern suggests a bullish reversal, so look for buying opportunities in the stock.
- Entry: Buy when the price moves above the high of the second (green) candle.
- Confirmation: For added assurance, wait for the next candle (third candle) to close higher than the high of the first (bearish) candle.
- Stop loss: Place the stop loss just at the low of the second (green) candle to protect yourself if the pattern doesn’t work out.
Let’s look at an example in Tata Motors.
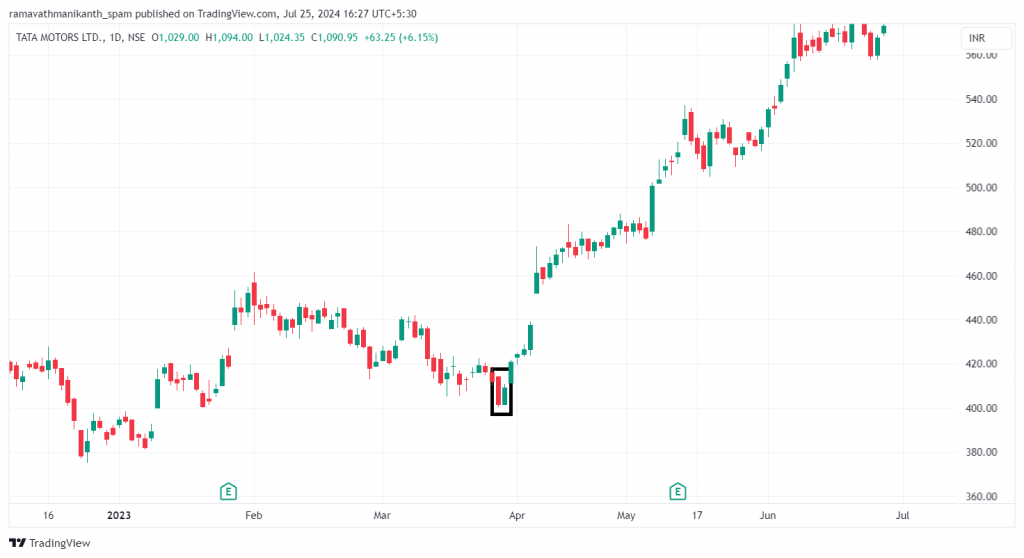
The OHLC data of the above candlesticks are:
First candle:
Open = 414.50
High = 414.50
Low = 400.40
Close = 409.20
Second candle:
Open = 401.60
High = 410.60
Low = 401.40
Close = 409.60
You can see that the first candlestick does not entirely cover the low of the second candle. But remember that we need to be flexible!
Hence, here’s how we would trade:
Entry Point: 410.60
Stop Loss: 401.40
To gain more confidence in the bullish harami pattern, watch for the third candle. For a more decisive confirmation, the third candle should be bullish. You can initiate a trade setup if the third candle closes above the high of the first candle, i.e., above 414.50. Set your stop loss at the low of the first candle.
Now, let’s look at the bearish harami pattern, which works just the opposite of the bullish harami pattern.
Bearish Harami Pattern
How does a bearish harami pattern form?
It is a potential bearish reversal candle, and the pre-requisites for a bearish harami candlestick pattern are:
- The prior trend should be an uptrend.
- The first candle should be bullish, indicating bullishness in the market.
- The second candle should be bearish and small enough to be contained within the body of the first candle.
The psychology behind the formation of bearish harami candlesticks is as follows:
- The market is in an uptrend, dominated by buyers.
- A large bullish (green) candle confirms the ongoing bullish sentiment.
- The following day, a smaller bearish (red) candle forms within the body of the previous green candle.
- This smaller red candle represents a period of indecision (Doji candles can form here), indicating that the buying pressure has weakened and sellers are starting to enter the market.
- The new small bearish candle suggests that sellers are becoming more active, though their presence still needs to be more robust to reverse the trend completely.
- The pattern indicates that the uptrend might be losing momentum.
- If sellers continue to gain strength, a reversal from bullish to bearish could be on the horizon.
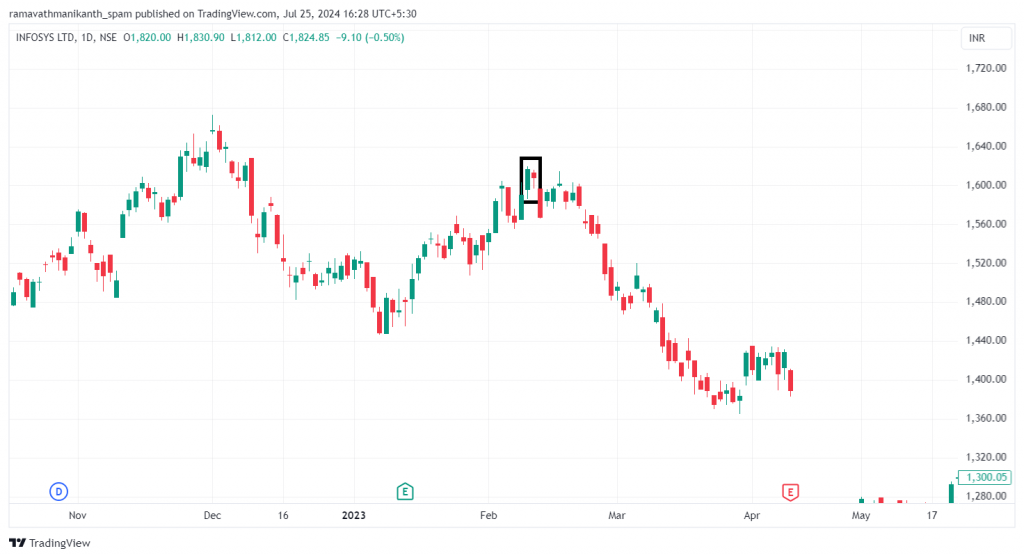
The image of a bearish harami, seen forming at the top of an uptrend in the price chart of Infosys:
How to trade a bearish harami pattern?
- Entry: Sell when the price moves below the low of the second (red) harami candle.
- Confirmation: For added assurance, wait for the next candle (third candle) to close lower than the low of the first (bullish) candle.
- Stop Loss: Place the stop loss at the high of the second (red) harami candle to protect yourself if the pattern doesn’t work out.
Now, let’s look at another exciting double candlestick pattern!
Tweezer Tops and Tweezer Bottoms
These consist of two consecutive candles with matching highs (tweezer top) or matching lows (tweezer bottom). Here’s how they look:
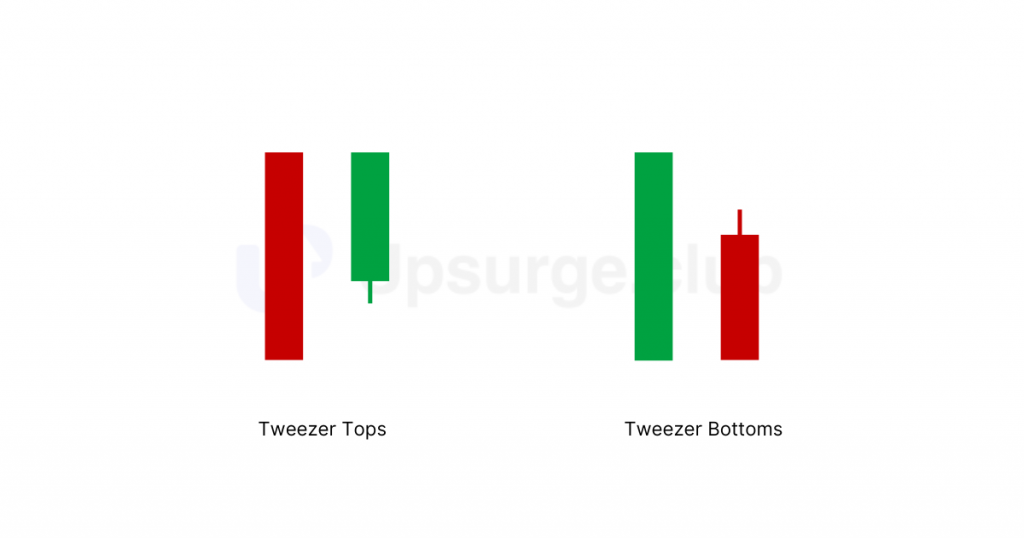
Let’s take a closer look at each one of them.
Tweezer Bottoms Pattern
How is a tweezer bottom formed?
It is a potential bullish reversal pattern, called a tweezer bottom, because it is found after a downtrend. The pre-requisites for a tweezer bottom candlestick pattern are:
- The prior trend should be a downtrend.
- The first candle should be bearish (red), confirming the bearishness in the market.
- The second candle should be bullish, and have a low that matches or is very close to the low of the first red candle.
Let’s examine the tweezer bottom pattern, which forms at the bottom of a downtrend of Infosys stock, for a better understanding.
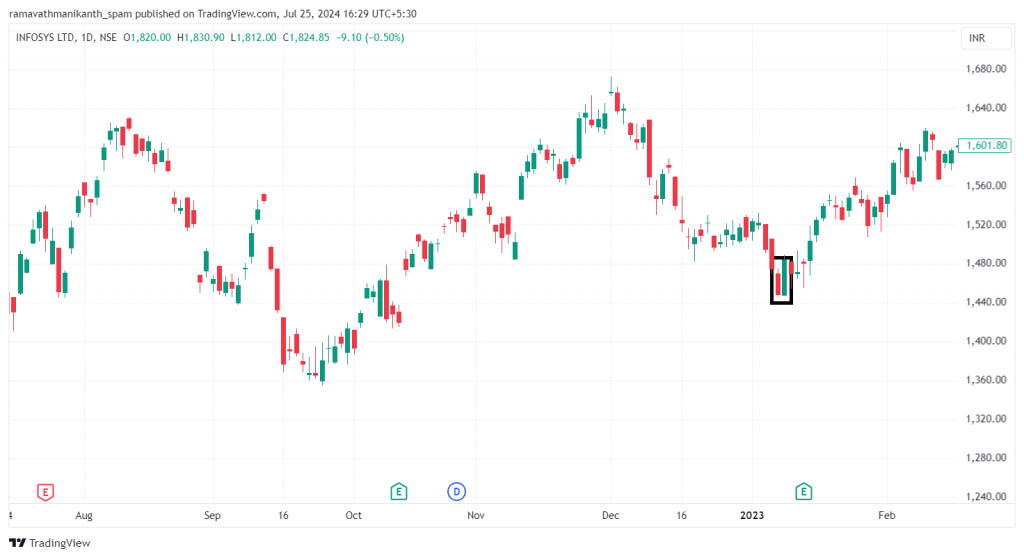
As you can see in the above chart, Infosys stock rallied significantly after the formation of the tweezer bottom. This pattern, formed after a downtrend with both candles having similar lows, indicates a potential bullish reversal.
What does the tweezer bottom tell us?
- Initially, the market was in a downtrend, dominated by sellers, as shown by the large bearish (red) candle. This sizeable bearish candle confirms the ongoing negative sentiment in the market.
- The next day, a bullish (green) candle forms with a low that matches or is very close to the low of the previous red candle. This matching low suggests that the selling pressure is weakening, and buyers are starting to step in.
- The green candle’s appearance indicates buyers are becoming more active, although their presence still needs to be stronger to reverse the trend completely.
- This pattern signals that the downtrend might be losing its momentum if buyers continue to gain strength.
Let’s look at how to trade tweezer bottom.
How to trade a tweezer bottom?
Now that you understand the tweezer bottom candlestick pattern, let’s discuss how to trade it. This pattern shows a potential bullish reversal, so it’s a good time to look for buying opportunities in the stock.
- Entry: Buy when the price moves above the high of the second (green) candle.
- Confirmation: Make sure the next (third) candle closes higher than the high of the second (green) candle to confirm the reversal.
- Stop Loss: Place the stop loss just below the low of the second (green) candle to protect yourself if the pattern doesn’t work out.
Now, let’s discover the tweezer top double candlestick pattern.
Tweezer Tops Pattern
How does a tweezer top get formed?
Converse to a tweezer bottom, a tweezer top is formed after an uptrend. The pre-requisites for the formation of a tweezer top are:
- The prior trend should be an uptrend.
- The first candle should be bullish, confirming the bullishness in the market.
- The second candle should be bearish, and have a high that matches or is very close to the high of the first candle.
Let’s understand with an example.
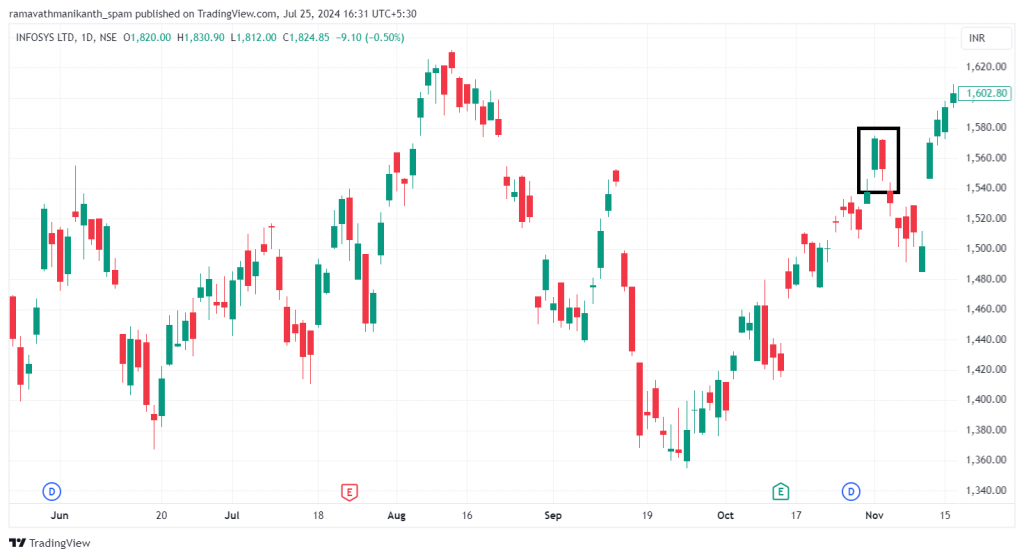
In the above chart, you can see they are formed in an uptrend; the OHLC of the above candlesticks are:
First candle:
Open = 1553
High = 1575
Low =1547
Close =1573
Second candle:
Open = 1572
High = 1572
Low =1545
Close =1553
We can see the high prices of both candles match, confirming the tweezer top candlestick pattern.
The psychology behind the formation of the tweezer top is as follows:
- Initially, the market was in a downtrend, dominated by sellers, shown by a large bearish (red) candle.
- The next day, a bullish (green) candle forms with a low matching or very close to the previous red candle’s low, indicating weakening selling pressure.
- This matching low suggests that buyers are starting to step in, though not yet strong enough to reverse the trend completely.
- The pattern signals that the downtrend might be losing momentum.
If buyers continue to gain strength, a reversal from bullish to bearish could be on the horizon.
How to trade a tweezer top?
- Entry: Sell when the price moves below the low of the second (red) candle.
- Confirmation: Make sure the next candle closes lower than the low of the second (red) candle to confirm the reversal.
- Stop Loss: To protect yourself if the pattern doesn’t work out, place the stop loss at the high of the second (red) candle.
Now that you’ve got the hang of interpreting and trading single and two-candlestick patterns, let’s move on to multi-candlestick patterns.