In this chapter, we will explore different chart patterns that visually represent the battle between buyers and sellers. These patterns help determine if a market is trending higher, lower, or sideways.
Chart patterns can be divided into two broad categories: reversal patterns and continuation patterns. Reversal patterns indicate a trend change, whereas continuation patterns indicate that the price trend will continue after a brief consolidation.
Continuation Patterns
Continuation chart patterns indicate that the current trend will likely continue, up or down. They form during a pause in the market and suggest that after a brief consolidation, the price would resume its previous direction. Understanding these patterns helps traders take advantage of ongoing market movements and manage their trades better.
Now, we will discuss the first continuation pattern, the triangles.
Triangles
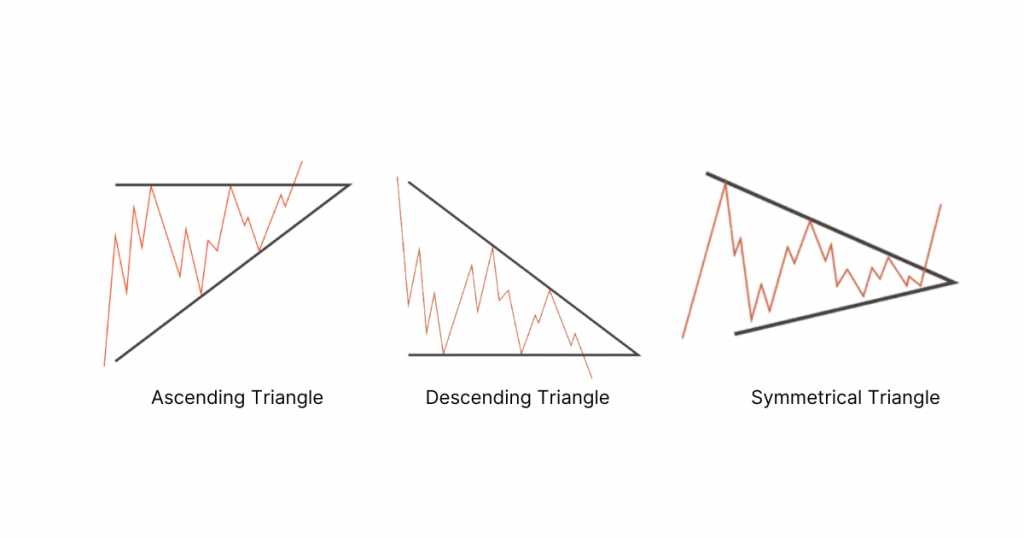
The triangle chart pattern is named because it looks like a triangle. There are three types of triangles: ascending, descending, and symmetrical. These patterns form when the price is in a consolidation, and the price direction before the consolidation can give clues about future market movements.
The illustration shows different types of triangle patterns: ascending, descending, and symmetrical.
Symmetrical Triangle
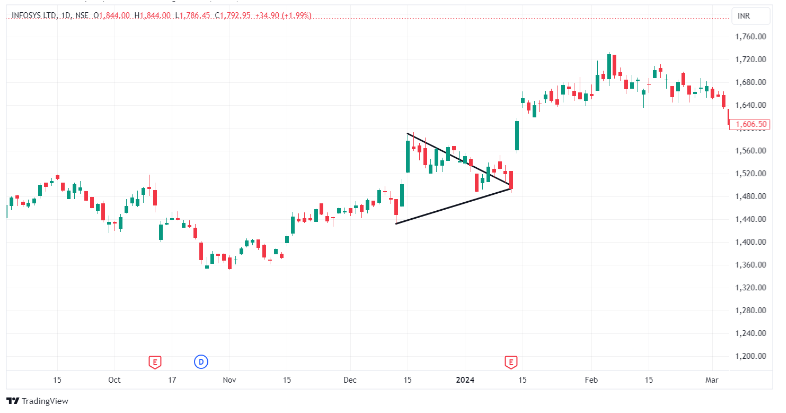
This continuation chart pattern sometimes called a coil, contains at least two lower highs and two higher lows. When these points are connected with lines, they converge as they extend, forming a symmetrical triangle.
Daily candlestick chart of Infosys showing a symmetrical triangle pattern. (Source: TradingView)
As you can see, a symmetrical triangle is formed by connecting lower highs and higher lows. Here is the formation process of a symmetrical triangle:
The market is in either an uptrend or a downtrend before the symmetrical triangle starts to form.
Prices start to make lower highs and higher lows, creating two converging trendlines that form a symmetrical triangle. As the pattern develops, trading volume typically decreases, indicating a consolidation phase.
The two trendlines converge towards an apex, where the price movement becomes more constricted.
The pattern is confirmed when the price breaks out of the triangle, either upward or downward, typically accompanied by an increase in volume. This breakout signals the direction of the following significant price move.
How to trade a symmetrical triangle?
Entry: Enter a trade at the opening of the next candle after the price breaks out of the symmetrical triangle.
Confirmation: The symmetrical triangle is confirmed when the price breaks out of the triangle with higher trading volume, showing the new trend’s direction.
Stop Loss: Place a stop loss just below the lower trendline (for an upward breakout) or just above the upper trendline (for a downward breakout) to limit potential losses if the trade moves against you.
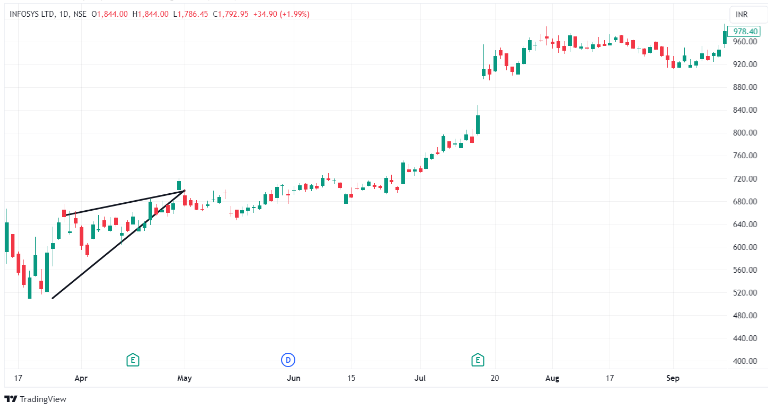
Ascending Triangle
An ascending triangle appears when two or more nearly identical highs form a horizontal resistance line while higher lows create an ascending support line. This pattern suggests increasing buying strength and looks like a right triangle. It often signals that a breakout above the resistance line may occur, indicating a possible upward trend continuation.
Here’s how it can be plotted on a price chart:
Daily candlestick chart of Infosys showing an ascending triangle pattern. (Source: TradingView)
The formation process of an ascending triangle:
Prices start to make higher lows while facing resistance at a consistently high level, creating a horizontal upper trendline and an upward-sloping lower trendline that forms the ascending triangle.
As the pattern develops, trading volume typically decreases, indicating a consolidation phase.
The two trendlines converge towards an apex, where the price movement becomes more constricted.
The pattern is confirmed when the price breaks out above the horizontal resistance line, typically accompanied by an increase in volume. This breakout signals a continuation of the previous uptrend.
How to trade an ascending triangle?
Entry: Enter the trade at the opening of the next candle after the price breaks above the horizontal resistance line of the ascending triangle.
Confirmation: The ascending triangle is confirmed when the price breaks out above the resistance line with a bullish candle and higher trading volume, indicating the new trend’s direction.
Stop Loss: Place a stop loss just below the upward-sloping trendline to limit potential losses if the trade moves against you.
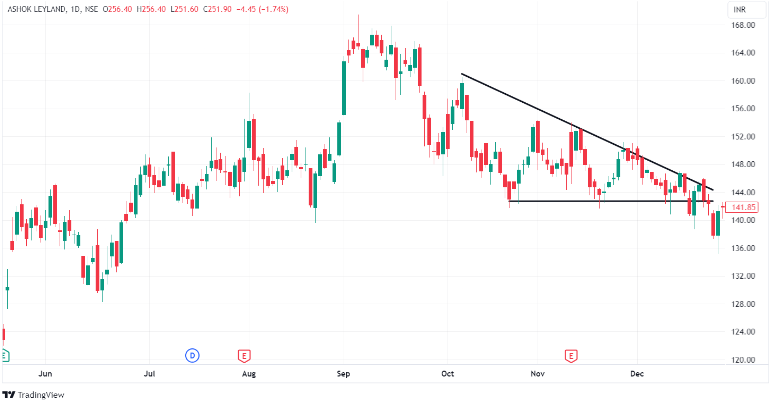
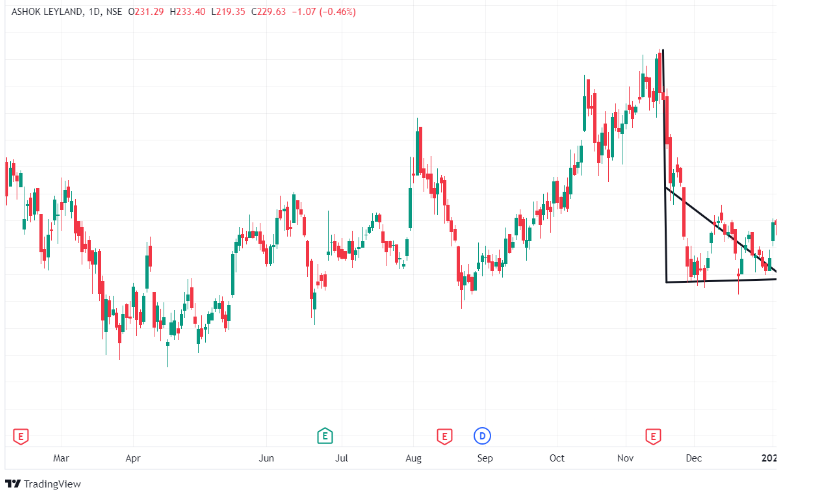
Descending Triangle
This pattern also looks like a right-angle triangle. Two or more similar lows create a horizontal line at the bottom. Two or more lower highs create a descending trend line above that meets the horizontal line as it goes down. Here’s a descending triangle plotted on a price chart:
The daily candlestick chart of Ashok Leyland shows a descending triangle pattern. (Source: TradingView)
The market psychology behind a descending triangle is as follows:
The market usually has a downtrend before the descending triangle starts to form.
Prices make lower highs while the lows stay consistently low, creating a flat bottom line and a sloping top line that forms the descending triangle.
As the pattern develops, trading volume usually decreases, showing a period of consolidation.
The two lines converge towards a point where the price movement becomes tighter.
The pattern is confirmed when the price breaks below the flat bottom line, usually with higher volume. This breakout signals that the downtrend will likely continue.
How to trade a descending triangle?
Entry: Enter the trade at the opening of the next candle after the price breaks out below the horizontal support line of the descending triangle.
Confirmation: The descending triangle is confirmed when the price breaks out below the support line with a bearish candle and higher trading volume, indicating the new trend’s direction.
Stop Loss: Place a stop loss just above the downward-sloping trendline to limit potential losses if the trade moves against you.
Flags
Now, we’ll explore another interesting chart pattern – the flag.
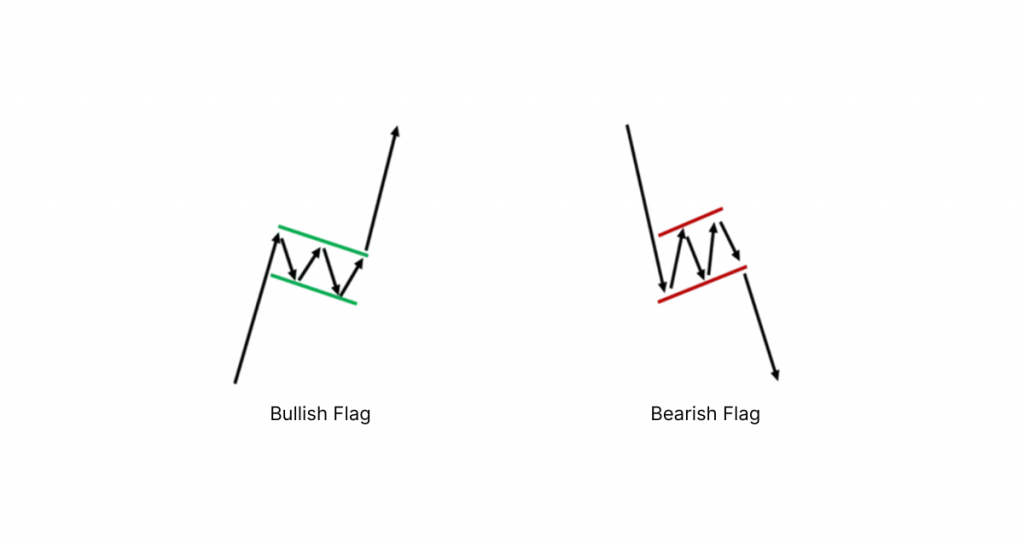
Flags are chart patterns made up of two parts – a steep rise or decline in prices, followed by a short period of consolidation. They are of two types – bullish and bearish. Here’s how they look:
Bullish flag and bearish flag chart patterns
Bullish Flag
This pattern forms when a stock’s price rises sharply. Flag patterns start with a big move-up and a short correction period. This correction happens between two parallel lines, making a shape like a flag on a pole.
The psychology for bullish flag formation is as follows:
The stock experiences a sharp, steep rise in prices.
After this big move-up, prices enter a short correction phase.
This correction happens between two parallel lines, forming a flag shape.
The pattern is confirmed when prices break out of the flag, usually continuing in the direction of the initial steep rise, indicating a potential trend continuation.
How can we trade a bullish flag?
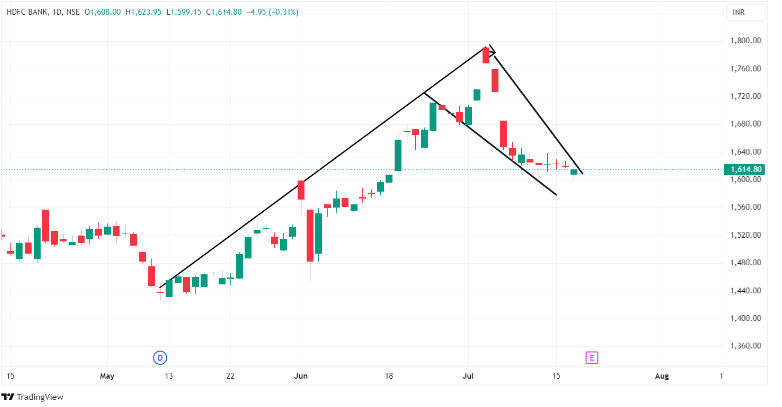
The daily candlestick chart of HDFC Bank shows a bullish flag formation. (Source: TradingView)
The trade setup is as follows:
Entry: Enter the trade at the breakout above the upper parallel line, which is at ₹1,650 in the case of the above chart.
Stop Loss: Set the stop loss below the lower parallel line, which is at ₹1,600 here.
Target: Aim for a target by adding the flagpole height (approximately 340 points) to the breakout point (1,650), giving a target of around ₹1,990.
Bullish Penants
Similar to a bullish flag, there is also a bullish pennant pattern. Both start with a steep move but differ in structure in that the bullish pennant forms a triangle rather than a flag shape. Here’s an example to help illustrate this pattern.
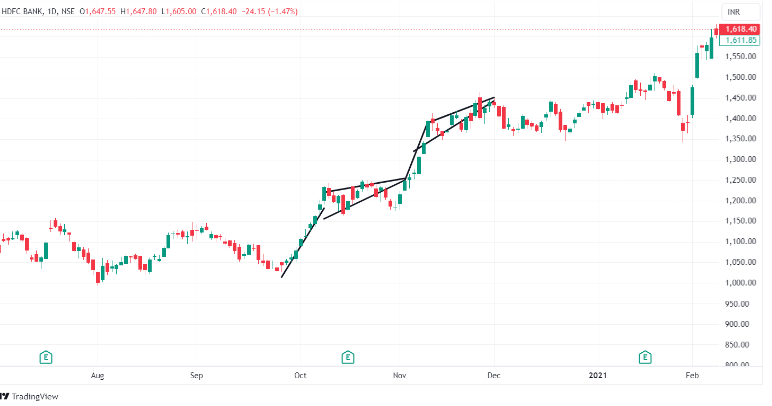
The daily candlestick chart of HDFC Bank shows multiple bullish pennant formations indicating potential continuation patterns of the uptrend. (Source: TradingView)
In the above image, you can see the continuous formation of a bullish pennant flag.
Trading a bullish pennant is very similar to trading a bullish flag. To trade a bullish pennant, go long on the stock when the price breaks above the converging trendline. The target is set based on the height of the flagpole, and the stop-loss is placed just below the lower trendline of the pennant.
Bearish Flag
This pattern forms when a stock experiences a sharp, steep rise in price. Bullish flag patterns start with a big up-move, followed by a short period of consolidation. This consolidation happens between two parallel lines, forming a shape like a flag on a pole.
The psychology for bearish flag formation is as follows:
The stock experiences a sharp, steep drop in prices.
After this big move down, prices enter a short correction phase.
This correction happens between two parallel lines, forming a flag shape.
The pattern is confirmed when prices break out of the flag, usually continuing in the direction of the initial steep drop, indicating a potential trend continuation.
Here is the pictorial representation of it
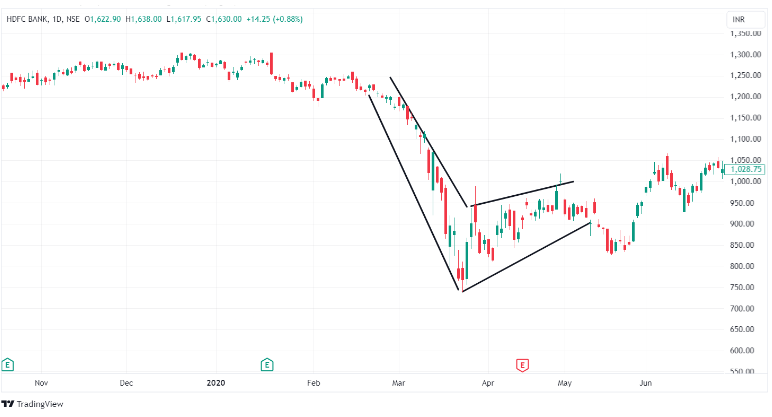
The daily candlestick chart of HDFC Bank shows a bearish flag formation. (Source: TradingView)
How can we trade bearish flag?
Entry: Enter the trade at the breakout below the lower parallel line.
Stop Loss: Set the stop loss just above the upper parallel line.
Target: Aim for a target by subtracting the height of the flagpole from the breakout point.
Bearish Penants
The bearish pennant is converse to the bullish penant. Similar to bearish flags, pennants form a small symmetrical triangle shape where two converging trendlines meet, indicating a period of consolidation before the previous bearish trend resumes.
The daily candlestick chart of Ashok Leyland shows a bearish pennant, indicating a potential downtrend continuation. (Source: TradingView)
Trading a bearish pennant involves taking a short position when the price breaks below the converging trendlines. The target price is determined by the distance of the initial sharp decline, and the stop loss should be set just above the upper trendline of the pennant. As the downward trend continues, this approach helps manage risk while aiming for potential profit.
Reversal Chart Patterns
Reversal chart patterns appear on price charts and tell us that a price trend might change direction. After a long rise or fall in prices, these patterns suggest the trend could end and move the opposite way. Traders look for these patterns to decide when to buy or sell, expecting a change in market direction.
Let’s look at the first reversal chart pattern: the head and shoulder pattern.
Head and Shoulders
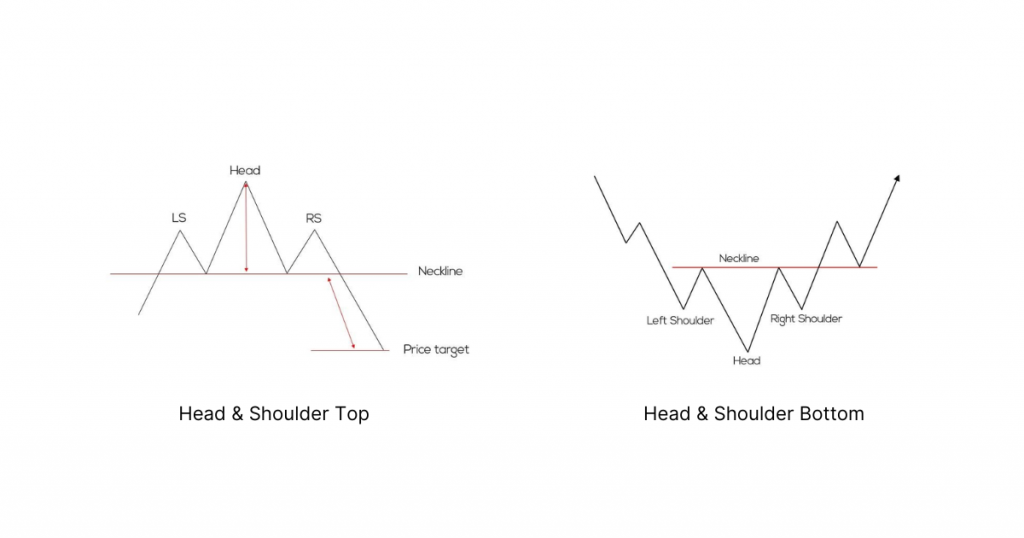
The head and shoulders pattern looks like a person’s head and shoulders on a price chart. It has three peaks, with the middle one being the farthest.
There are two types of head and shoulders: head and shoulders sometimes, also referred to as head and shoulders top. Another is inverse head and shoulders, or head and shoulders bottom.
Here’s a pictorial representation:
Head and shoulder top and head and shoulder bottom chart patterns
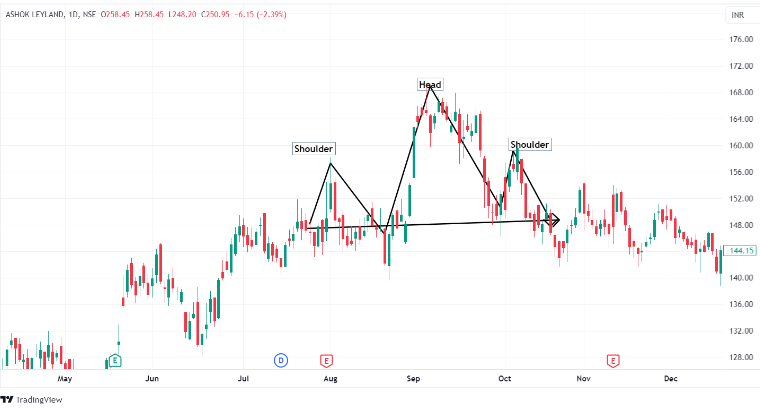
Head and shoulders top
A head and shoulders top reversal pattern forms after an uptrend and signals a potential trend reversal upon completion. The pattern consists of three successive peaks: the middle peak, known as the head, is the highest, while the two outside peaks, called the shoulders, are lower and roughly equal in height.
The formation process behind the head and shoulders top:
The market is in an uptrend, and prices rise to a new high, forming the first peak (left shoulder) before pulling back slightly.
After the pullback, prices rise again to form a higher peak (head), but then declines again, hitting the previous support level.
Prices rise once more but fail to reach the height of the head, forming the third peak (right shoulder). The pattern is confirmed when prices fall below the neckline, drawn by connecting the lows after each peak, signaling a potential trend reversal from bullish to bearish.
Daily candlestick chart of Ashok Leyland showing a head and shoulders pattern, indicating a potential trend reversal. (Source: TradingView)
How to trade head and shoulders top?
Entry: Enter a short trade when the price breaks below the neckline with increased volume.
Target: Set the target price by subtracting the height from the head to the neckline from the breakout point below the neckline.
Stop Loss: Place the stop loss above the right shoulder to limit potential losses if the breakout fails.
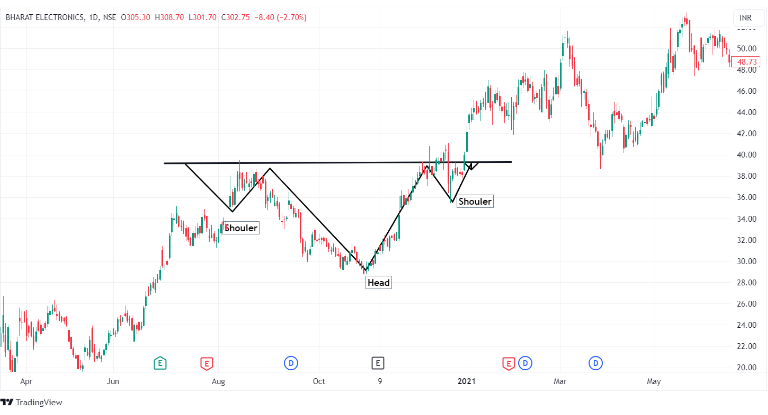
Head and shoulders bottom
The opposite of the head and shoulders top is the head and shoulders bottom. It is also known as the inverse head and shoulders pattern. Here, the formation occurs after a downtrend, indicating a potential reversal to an uptrend. As it completes, the pattern shifts market sentiment from bearish to bullish, signaling a possible upward movement in prices.
The formation process of the head and shoulder bottom is as follows:
The market is in a downtrend, and prices fall to a new low, forming the first trough (left shoulder) before rebounding slightly.
After the rebound, prices fall again to form a lower trough (head) but then rise, hitting the previous resistance level.
Prices fall once more but do not reach the depth of the head, forming the third trough (right shoulder). The pattern is confirmed when prices rise above the neckline, drawn by connecting the highs after each trough, signaling a potential trend reversal from bearish to bullish.
Daily candlestick chart of Bharat Electronics Ltd. showing an inverse head and shoulders pattern. (Source: TradingView)
How to trade head and shoulders bottom?
Entry: Enter a long trade when the price breaks above the neckline with increased volume.
Target: Set the target price by adding the height from the head to the neckline to the breakout point above the neckline.
Stop Loss: Place the stop loss below the right shoulder to limit potential losses if the breakout fails.
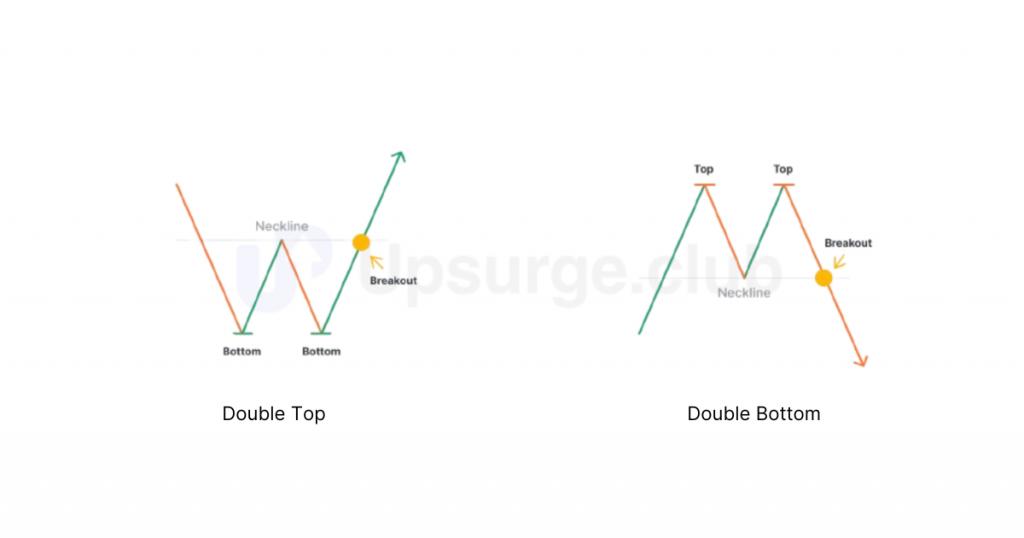
Double Bottom And Double Top Patterns
A double bottom and double top are potential trend reversal patterns. They occur when a stock moves in a pattern resembling the letter “W” (double bottom) or the letter “M” (double top), something like this:
Double top and double bottom chart patterns
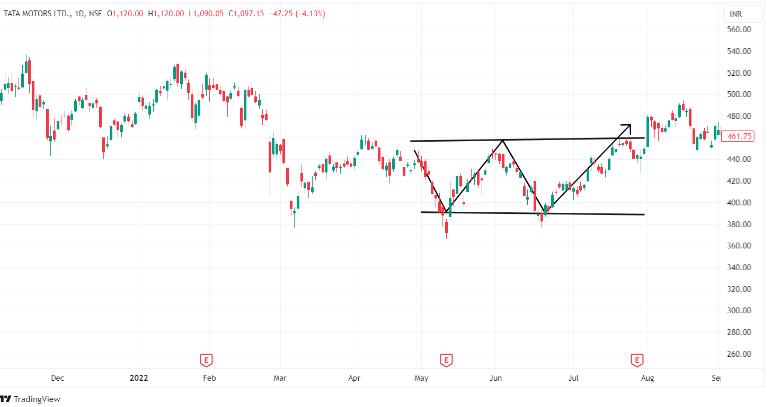
Double Bottom
A double bottom is a bullish reversal pattern. The stock first drops to a low point and then rises to a resistance level. It drops to the low point again forming a support before finally moving up from the downtrend.
Here is a pictorial representation of a double-bottom pattern.
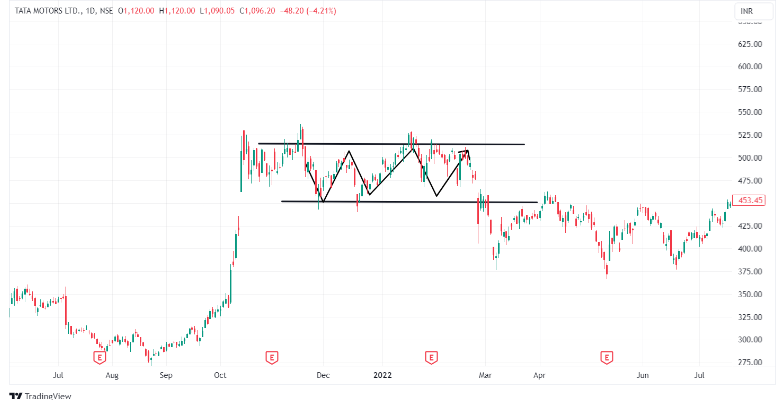
Daily candlestick chart of Tata Motors showing a double bottom pattern indicating a bullish reversal. (Source: TradingView)
The formation process of double bottom is
The market is in a downtrend, and prices fall to a new low before finding support and rebounding slightly.
After the initial rebound, prices rise but hit resistance and pull back, forming a peak between the two low points.
Prices decline again, but the selling pressure weakens, and the market forms a second low around the same level as the first low point.
The pattern is confirmed when prices rise above the peak formed between the two highs, signaling a potential trend reversal from bearish to bullish.
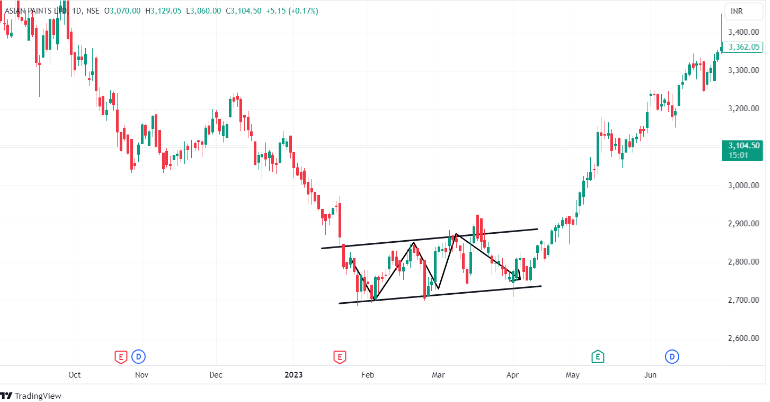
A tribple bottom occurs when the price touches the support three times before breaking the resistance. Here’s how it looks on a chart:
Daily candlestick chart of Asian Paints showing a triple bottom pattern. (Source: TradingView)
In fact, the price breaking out after a triple bottom gives a stronger rally than the one after a double bottom.
Now, we will look at the opposite of the double bottom, which is the double top.
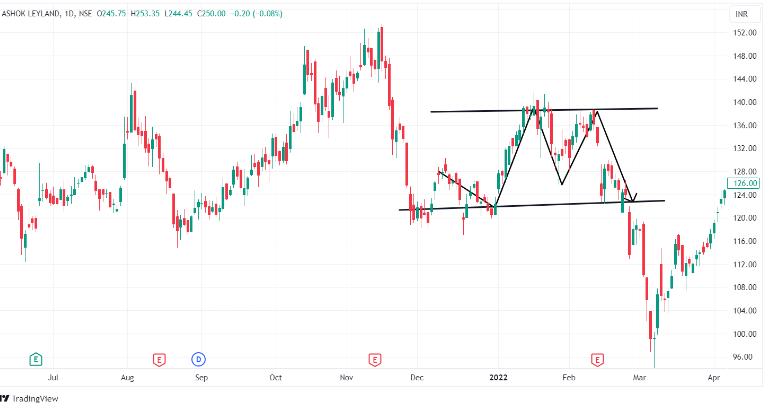
Double Top
A double top is a bearish reversal pattern. The stock first rises to a high point and then falls to a support level. It rises to a high point again before finally moving down from the uptrend.
Here is a pictorial representation of a double-top pattern.
The daily candlestick chart of Ashok Leyland shows a double top pattern, indicating a bearish reversal. (Source: TradingView)
The process of forming a double bottom is as follows:
The market is in an uptrend, and prices rise to a new high before hitting resistance and pulling back slightly.
After the pullback, prices fall but find support, forming a low point between the two highs.
Prices rise again, but the buying pressure weakens, and the market forms a second high at about the same level as the first high.
The pattern is confirmed when prices fall below the low point between the two highs, signaling a potential trend reversal from bullish to bearish.
How to trade the double bottom and double top patterns?
Double bottom and double top patterns can be handy in trading when identified correctly. For a double top, measure the distance from the top of the “M” to the neckline to set a target and place a stop loss above the neckline. Enter a short trade when the neckline breaks.
For a double bottom, place a stop loss below the neckline and enter a long trade when the neckline breaks upward. These patterns work well, but careful and patient analysis is needed to avoid mistakes.
Let’s demonstrate with an example.
Here is a chart of HDFC bank formation of a double-bottom pattern:
Daily candlestick chart of HDFC Bank showing a double bottom pattern and neckline around ₹1,400 (Source: TradingView)
For the above chart, we can enter a long trade, as the double bottom indicates a potential bullish reversal pattern. We can set our stop loss at the preceding support level and target a price move by measuring the distance between the neckline and the support level.
Conversely, here’s a possible trade after a triple top pattern is formed. For a triple top, place a stop loss above the neckline and enter a short trade when the neckline breaks downward.
Daily candlestick chart of Tata Motors Ltd. showing a triple bottom pattern. (Source: TradingView)