Now that we’ve covered chart patterns, let’s discuss indicators.
Indicators are tools developed by successful traders as independent trading systems. They are based on a preset logic and help traders enhance their technical analysis, including candlesticks, volume, support, and resistance levels. Indicators assist in making trading decisions by helping with buying, selling, confirming trends, and sometimes predicting future trends.
There are two main types of indicators: lagging and leading. A leading indicator predicts future price movements, often signaling a reversal or a new trend before it happens. However, they are only sometimes accurate, and knowing how to use them effectively requires experience and practice. Lagging indicators, on the other hand, are used to confirm trends. They usually generate a signal after a trend begins but have a better accuracy rate than leading indicators.
In this chapter, we will discuss one famous lagging indicator, the moving average, and how to trade using it. Let’s go!
The moving average
The moving average indicator is very similar to the ‘average’ we learned in school: the sum of observations divided by the total number of observations. Let’s recall with a simple example—let’s calculate the average weight of five men.
Man
Weight (in kg)
Ravi
71
Kishore
75
Bhuvan
55
Vignu
55
Manohar
65
The average of the above observation = (71 + 75 + 55 + 55 + 65) / 5 = 64.20 kg.
Similarly, if we calculate the average of the closing prices of a particular stock over a specific period, it’s called the stock’s simple moving average (SMA). Let’s calculate a stock’s 5-day moving average based on its closing prices of the past 5 days.
Day
Closing Price
Day-1
414
Day-2
416
Day-3
419
Day-4
423
Day-5
444
Average
423.20
The average closing price is the sum of all closing prices over a certain number of days divided by the number of days. When this average is plotted over time, it results in a simple moving average. Hence, the simple moving average is nothing but the changing average of the stock price on a particular day. It can be represented by a line whose movement can be compared with the stock’s price.
Its lookback period can be changed as per a trader’s requirement. In the above example, the five-day moving average for the share price is 423.32. A moving average smooths out price data to give a clearer view of the stock’s trend over time.
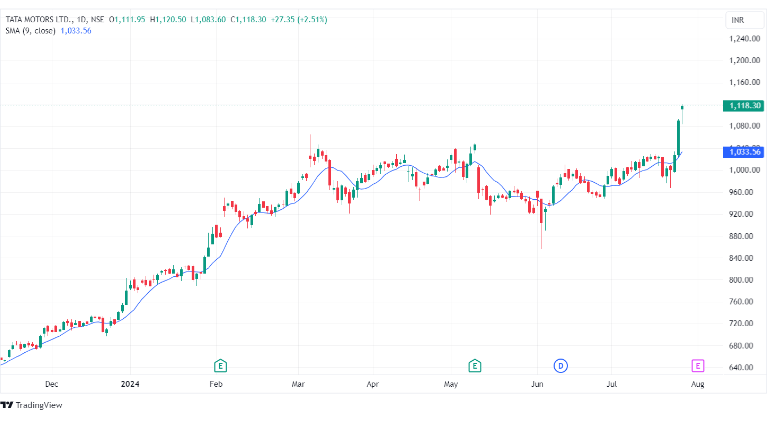
9-day moving average (in blue) plotted on the daily chart of Tata Motors Ltd. (Source: TradingView)
As seen in the chart, the blue line above the candlesticks is the simple moving average, showing the stock’s overall trend.
Another type of moving average is the exponential moving average (EMA), which reacts heavily to recent price changes. Let’s learn about it in more detail.
The exponential moving average
An exponential moving average (EMA) is a type of moving average that gives more weight to recent prices. The EMA is often used in technical analysis to spot trends and potential reversals.
Here is the calculation of a 5-period EMA based on closing prices:
Day
Closing Price
Day-1
100
Day-2
102
Day-3
104
Day-4
106
Day-5
108
Step 1: Calculate the Simple Moving Average (SMA) for the first five days
SMA = (100 + 102 + 104 + 106 + 108) / 5 = 104
This SMA serves as the starting point for the EMA.
Step 2: Calculate the multiplier for weighting the EMA
Multiplier = 2 / (5 + 1) = 0.3333
Step 3: Calculate the EMA for Day 6 using a hypothetical price
Let’s say the closing price for Day 6 is 110.
EMA = (Closing price – Previous EMA) * Multiplier + Previous EMA
For Day 6: EMA = (110 – 104) * 0.3333 + 104 = 2 + 104 = 106
So, the EMA for Day 6 is 106.
When this calculation for each day is plotted over time, it results in an exponential moving average. It can be represented by a line whose movement can be compared with the stock’s price.
Here too, the lookback period can be changed as per a trader’s requirement. An exponential moving average gives a weighted average of the stock price to give a clearer view of the stock’s trend over time and also signals potential reversals.
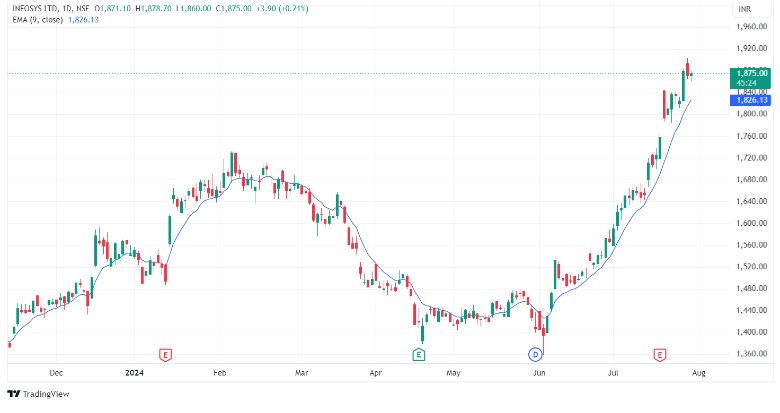
9-day exponential moving average (in blue) plotted on the daily chart of Infosys Ltd. (Source: TradingView)
How to trade moving averages
A simple moving average (SMA) smooths out price data to help identify longer-term trends, though it needs to catch up and capture quick changes. To better capture these changes and make more timely trading decisions, traders often use the exponential moving average (EMA), which gives more weight to recent prices.
The exponential moving average is a lagging indicator it is used in several ways:
Identifying trends
Imagine you’re trading a stock, and the 50-day EMA is rising. This suggests an upward trend, so you might consider buying the stock or holding your existing position.
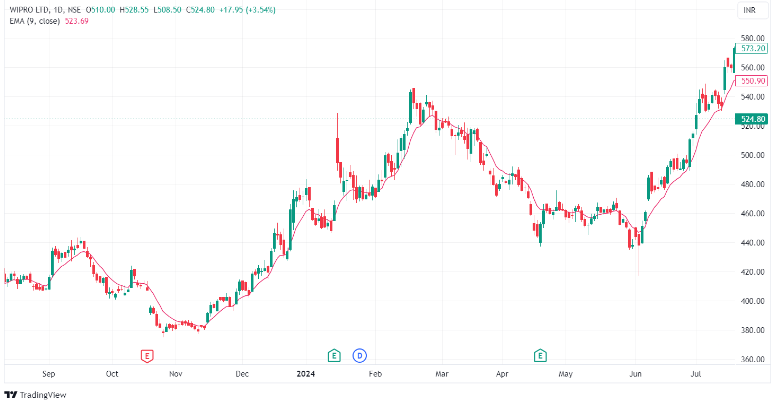
Here is an example of a 9-period exponential moving average. As the 9-day EMA rises, the stock’s upward trend continues.
Wipro Ltd. daily chart showing an uptrend above the 9-day EMA (Source: TradingView)
Identifying support and resistance levels
Sometimes, stock prices may frequently bounce off their 20-day EMA, which acts as a support level. The price falling below the EMA might signal a selling opportunity.
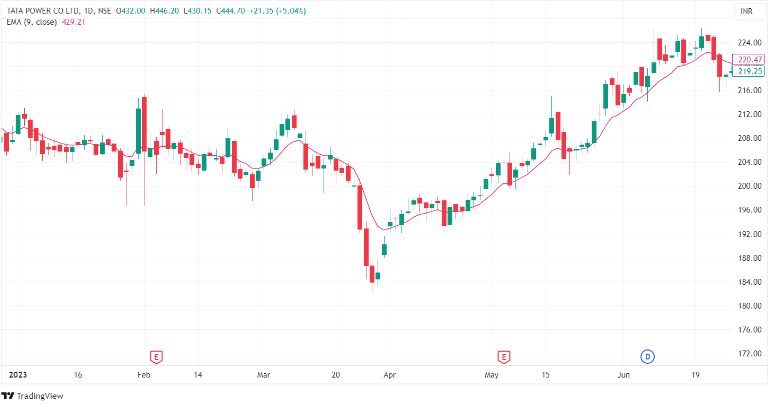
Tata Power CLtd. daily chart showing the 9-day EMA acting as support (Source: TradingView)
We can see that the 9-day EMA first acted as a resistance and later as a support, similar to what happened with Tata Power.
Using moving average crossovers
Combining two EMAs can be used as a trend reversal signal in trading, especially with moving average crossovers.
A moving average crossover occurs when one moving average crosses over another moving average, each having different lookback periods. Bullish and bearish trading signals can be developed depending on the direction of the two average lines.
Let’s look at the most famous crossovers.
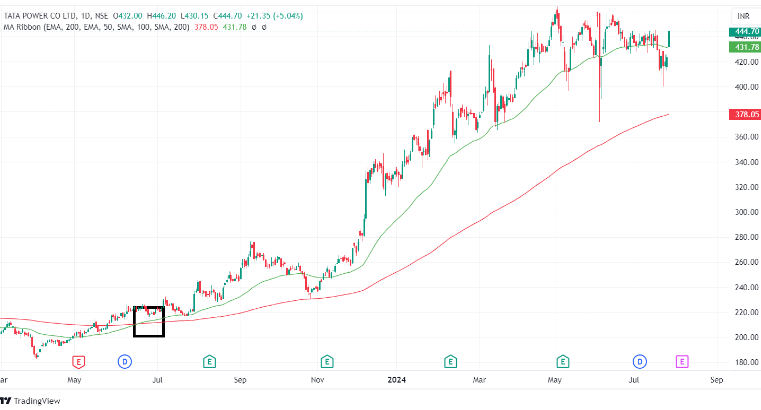
Golden Crossover: This occurs when a short-term EMA, like the 50-day EMA, crosses above a long-term EMA, such as the 200-day EMA. It signals a potential bullish trend reversal.
Tata Power Ltd. daily chart highlighting the golden crossover with the 50-day EMA (green) crossing above the 200-day EMA (red), indicating a bullish trend. (Source: TradingView)
As we can see, after the golden crossover happened, there was a bullish trend for an extended period.
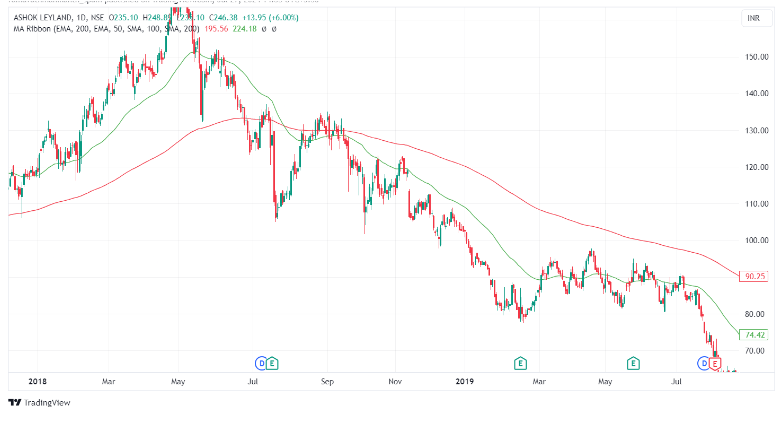
Death Crossover: This happens when a short-term EMA crosses below a long-term EMA. It suggests a potential bearish trend reversal.
Ashok Leyland Ltd. daily chart showing the death crossover with the 50-day EMA (green) crossing below the 200-day EMA (red), indicating a bearish trend. (Source: TradingView)
As we can see, after the death crossover, there was an extended bearish trend.
Not all moving average signals should be relied on…
In sideways markets, moving averages can give many buy and sell signals, often leading to small gains or losses.
It’s hard to know which trade will be the big winner, so it’s best to take all the trades suggested by the moving average system. One big winning trade can cover all the losses and provide good profits.
Summary
Indicators help traders understand market trends, gauge strength, and find entry/exit points using market data like price and volume.
There are two main types of indicators: lagging, like moving averages, and leading, which predicts future movements.
A moving average (MA) smooths out price data to show trends over time; simple moving averages (SMA) use equal weighting, while exponential moving averages (EMA) give more weight to recent prices.
SMAs are useful for identifying long-term trends but may miss quick changes; EMAs react faster and help make timely trading decisions.
A golden crossover occurs when a short-term EMA crosses above a long-term EMA, indicating a potential bullish trend. A death crossover happens when a short-term EMA crosses below a long-term EMA, signaling a potential bearish trend.
In sideways markets, moving averages can produce many signals with small gains or losses; following all signals can maximize potential gains.