Chapter 11: Indicators – Part 3
In this chapter, we’ll explore additional indicators such as ADX, CPR, ATR, and VWAP. These tools are valuable for assessing market strength, identifying key price levels, and making informed trading decisions.
Average Directional Index
The average directional index (ADX), created by the legendary Welles Wilder in 1978, is a popular technical indicator for identifying strength. Understanding the strength of trends is essential in trading and investing, and the ADX provides valuable insights into these aspects. This is why it has become one of the most widely used technical indicators in trading.
ADX quantifies the strength of a trend. The calculations are based on a moving average of price range expansion over a specific period, typically set to 14 bars by default, though other periods can be used.
Calculation of the ADX will be as follows:
Calculate +DM (Positive Directional Movement) and -DM (Negative Directional Movement):
- +DM = Current High – Previous High (if positive and more significant than -DM)
- -DM = Previous Low – Current Low (if positive and more significant than +DM)
- Use +DM if the difference between the current high and the previous high is greater than the difference between the last low and the current low.
- Use -DM if the difference between the prior low and the current low is greater than between the current high and the previous high.
Calculate True Range (TR):
TR is the greatest of the following three:
- Current High – Current Low
- The absolute value of Current High – Previous Close
- The absolute value of Current Low – Previous Close
Smooth the 14-period averages of +DM, -DM, and TR; it is nothing but a calculation of previous averages.
First, calculate the sum (smoothing) of the first 14 readings of TR, +DM, and -DM. This gives the initial smoothed values.
To find the next smoothed value, use this formula:
- Next 14th day TR = Previous 14TR – (Previous 14TR / 14) + Current TR
- Apply the same formula to +DM and -DM.
Calculate +DI and -DI:
- +DI = (Smoothed +DM / Smoothed TR) * 100
- -DI = (Smoothed -DM / Smoothed TR) * 100
Calculate Directional Movement Index (DMI):
DMI = [|(+DI) – (-DI)|] / (+DI + -DI) * 100
Calculate ADX:
First, average the DMI values over 14 periods to get the initial ADX value. To continue, use the formula:
ADX = ((Previous ADX * 13) + Current DMI) / 14
Knowing the exact formula of a technical indicator is optional, as most trading software has this built-in. The main focus is on the signals it provides. Now, let’s explore how the ADX can help generate trading signals.
How to trade with the ADX indicator?
The ADX is a momentum-based indicator. When the ADX value rises, it indicates the trend strengthening, whether bullish or bearish. Conversely, if the ADX value decreases, it suggests that the trend’s strength is weakening.
ADX has a value ranging from 0 to 100. Here is a table summarizing the values:
ADX Value | Trend Strength |
0-25 | Non-trending market or range-bound market |
25-50 | Strong trend |
50-75 | Powerful trend |
75-100 | Solid trend (rarely happens and can be considered unsustainable) |
Based on the ADX value, we can determine whether the trend’s strength is bullish or bearish. When plotted on a chart, the ADX indicator will look something like this:
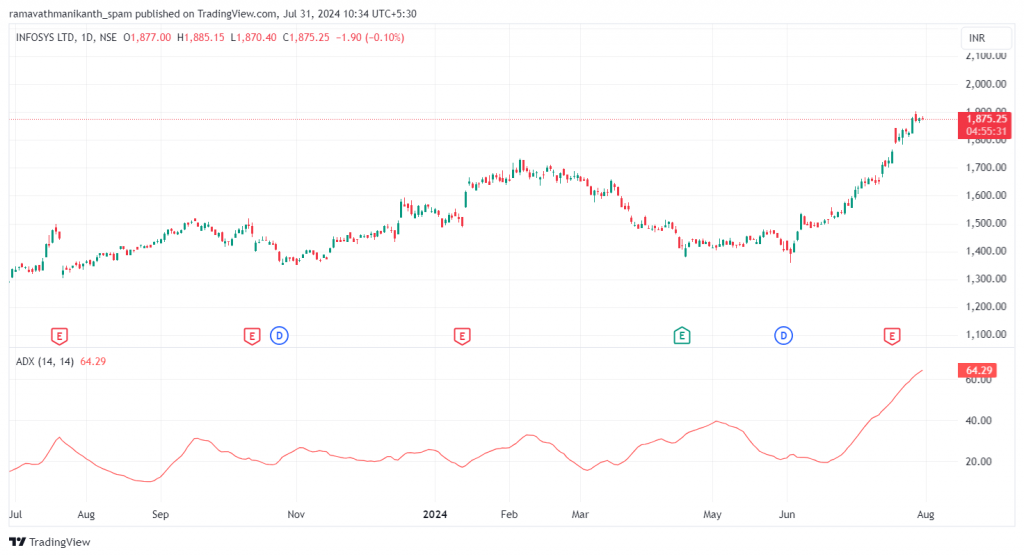
In the chart above, an ADX value of 65 indicates a strong trend, suggesting that Infosys has experienced a significant up-move, and the rally is likely to continue.
Central Pivot Range
Also known as the CPR, this technical indicator is handy for intraday trading, as it helps identify key price points for setting up trades. It’s built on the concepts of support and resistance, which we have learnt in earlier chapters.
It has three components:
1. Pivot
2. Bottom Central Pivot (BC)
3. Top Central Pivot (TC)
These are relatively easy to calculate:
Pivot = (High + Low + Close) / 3
Bottom CPR = (High + Low) / 2
Top CPR = (Pivot – BC) + Pivot
CPR (Central Pivot Range) offers notable advantages by providing traders with precise entry and exit points. It helps set up stop-loss levels and determine key price points. The upper and lower ranges derived from the central pivot point allow for the placement of stop-loss orders at predetermined levels, which enhances risk management and helps traders make informed decisions.
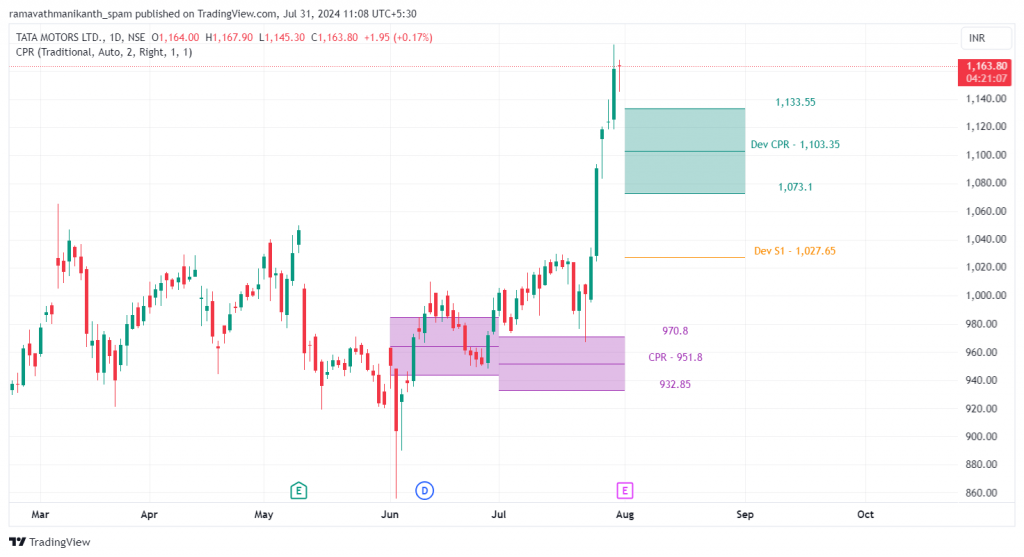
Here are how the CPR lines look when plotted on a price chart:
How to trade using the CPR indicator?
As we know, CPR (Central Pivot Range) consists of three levels: TC (Top Central), BC (Bottom Central), and Pivot.
If the current market price is above the top central line, it indicates a buying opportunity, like the chart above.
Another scenario occurs when the current market price is trading below the bottom central line. This situation suggests a shorting opportunity.
Now, let’s move on to another indicator, the ATR (Average True Range).
Average True Range
The ATR (Average True Range) is a technical indicator used to measure market volatility. It is typically calculated over 14 periods, which can be intraday, daily, weekly, or monthly, depending on the time frame you’re looking at.
ATR is very useful for setting stop-loss levels and targets, as it signals changes in market volatility. The calculation typically uses 14 periods as the lookback.
The formula for the ATR is
ATR = (Previous ATR * (n – 1) + True Range) / n
Where “n” is the number of periods (usually 14).
Step 1: Calculate the True Range (TR) for each day:
True Range is the greatest of the following:
- Current High – Current Low
- The absolute value of Current High – Previous Close
- The absolute value of Current Low – Previous Close
For Day2:
Current High – Current Low = 104 – 99 = 5
|Current High – Previous Close| = |104 – 100| = 4
|Current Low – Previous Close| = |99 – 100| = 1
TR = max(5, 4, 1) = 5
For Day-3:
Current High – Current Low = 105 – 101 = 4
|Current High – Previous Close| = |105 – 103| = 2
|Current Low – Previous Close| = |101 – 103| = 2
TR = max(4, 2, 2) = 4
Continue this for each day until you have the TR values of all 14 days.
Step 2: Calculate the initial ATR using the first 14 days
ATR is the average of the True Ranges over a set number of days, typically 14 days.
Initial ATR = (Sum of first 14 TR values) / 14
Step 3: Calculate subsequent ATR values
Once the initial ATR is calculated, use the following formula for subsequent days:
ATR = [(Previous ATR * (n – 1)) + Current TR] / n
where n is the number of periods
Example Calculation:
Let’s say the first 14 TR values sum to 70, giving an initial ATR of 5. For Day-15:
TR (Day-15) = 6 (hypothetical value)
ATR = [(5 * (14 – 1)) + 6] / 14
ATR = [(5 * 13) + 6] / 14
ATR = (65 + 6) / 14
ATR = 71 / 14
ATR = 5.07
This ATR value of 5.07 represents the average true range over the past 14 days, indicating the market’s volatility.
The higher the ATR, the higher the volatility, and the lower the ATR, the lower the volatility.
How to trade using the Average True Range?
Check the ATR value to understand the stock’s volatility.
Setting Stop-Losses
- Long Position: If you’re buying a stock, you can use the ATR to set the stop-loss at a level below the entry price. A standard method is to use 2 x ATR. For example, if the ATR is 2 and you enter a trade at ₹100, set the stop-loss at ₹96 [100 – (2 x 2)].
- Short Position: If you’re selling a stock (shorting), you can use the ATR to set the stop-loss above the entry price. If you enter at ₹100 with an ATR of 2, place the stop-loss at ₹104 [100 + (2 x 2)].
Let’s understand with an example.
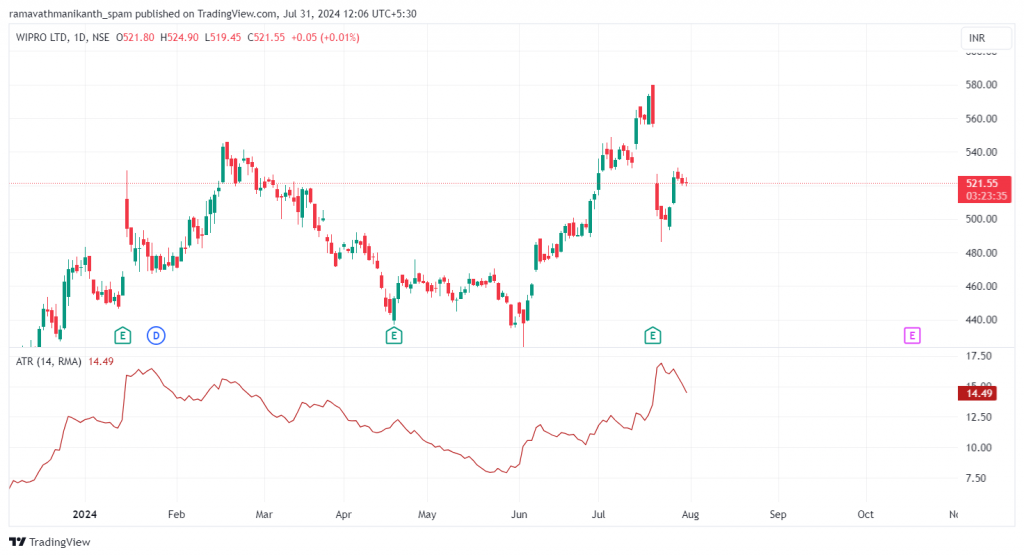
Based on the chart provided, the current ATR (Average True Range) value for Wipro Ltd. is approximately 14.49. Here’s how you can use this ATR for a long trade in the stock:
- Entry Point: Suppose you enter a long trade at the current price of Rs. 521.55.
- Stop Loss: Use the ATR to set your stop-loss level. A standard method is to place the stop-loss at 2 x ATR below the entry price.
ATR = 14.49
Stop Loss = Entry Price – (2 x ATR)
Stop Loss = 521.55 – (2 x 14.49)
Stop Loss = 521.55 – 28.98 = ₹492.57
Using the ATR, we can similarly calculate the stop loss for a short position. However, it’s crucial to take positions based on overall market sentiment. You can combine your knowledge of candlestick patterns and other technical indicators to do this effectively.
Volume Weighted Average Price
As you gain experience trading, you’ll realize how crucial volume is in confirming trends. This technical indicator, the volume-weighted average price (VWAP), combines volume with price. It represents the average price of a stock, weighted by the trading volume.
Similar to the moving average, the VWAP calculation experiences a lag because it relies on historical data. This characteristic makes it more suitable for intraday trading.
The formula for VWAP is
VWAP = ∑ (Volume x Price) / ∑Volume
Where:
– Price is the typical price for the period, calculated as (High+Low+Close)/3
– Volume indicates the number of shares traded during that period
ATR = (Previous ATR * (n – 1) + True Range) / n
Where “n” is the number of periods (usually 14).
Let’s assume we have the following data for a stock:
Period | High | Low | Close | Volume |
1 | 105 | 100 | 102 | 200 |
2 | 107 | 101 | 104 | 150 |
3 | 110 | 103 | 109 | 250 |
Step 1: Calculate TP (Typical Price) for each period:
- TP (1) = (105 + 100 + 102) / 3 = 102.33
- TP (2) = (107 + 101 + 104) / 3 = 104.00
- TP (3) = (110 + 103 + 109) / 3 = 107.33
Step 2: Calculate TPV (Typical Price x Volume) for each period:
- TPV (1) = 102.33 x 200 = 20466
- TPV (2) = 104 x 150 = 15600
- TPV (3) = 107.33 x 250 = 26832.5
Step 3: Calculate cumulative TPV and cumulative Volume:
- Cumulative TPV = 20466 + 15600 + 26832.5 = 62898.5
- Cumulative Volume = 200 + 150 + 250 = 600
Step 4: Calculate VWAP:
- VWAP = Cumulative TPV / Cumulative Volume
- VWAP = 62898.5 / 600 = 104.831
The VWAP for these three periods is 104.83. This value gives the average price the stock has traded, weighted by the trading volume
How to trade the VWAP?
VWAP is commonly used to identify the trend direction. Simply put, if the current price is above the VWAP line, it indicates a bullish trend, suggesting buying opportunities. Conversely, if the current price is below the VWAP line, it indicates a bearish trend, suggesting selling or shorting opportunities.
Entry and Exit Points:
Buying (Long Position)
- Entry: Consider buying when the price crosses above the VWAP line. This suggests the stock is gaining strength.
- Stop Loss: Place the stop loss slightly below the VWAP line to protect against downside risk if the price drops back below the VWAP.
Selling (Short Position)
- Entry: Consider selling or shorting when the price crosses below the VWAP line. This indicates that the stock may be weakening.
- Stop Loss: Place the stop loss slightly above the VWAP line to protect against the risk of the price rising back above the VWAP.
Let’s look at an example by analysing the chart of Infosys with the VWAP indicator.
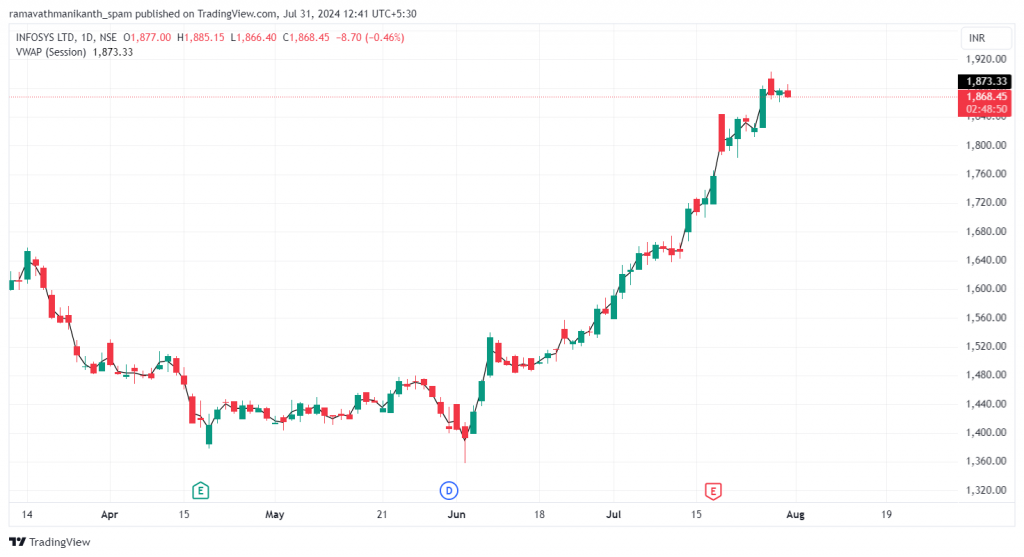
Current Price: ₹1,868.45
VWAP: ₹1,873.33
Analysis based on VWAP
Since the current price is above the current VWAP, a long position should be considered. A stop loss should be set slightly below the VWAP level to protect against a downside move, for example, at ₹1,870.
Summary
- ADX (Average Directional Index) measures trend strength. Ranging from 0-100, a rising ADX indicates a strong trend, while a falling ADX signals a weakening trend.
- CPR (Central Pivot Range) helps identify key price levels and set stop losses. It includes Pivot, Top Central (TC), and Bottom Central (BC) lines. A price above TC is suggestive of buying opportunities, while a price below BC is suggestive of selling opportunities.
- ATR (Average True Range) measures market volatility. It is helpful for setting stop loss levels and entry points, with higher ATR levels indicating higher volatility.
- VWAP (Volume Weighted Average Price) combines price and volume to determine the average trading price. A price greater than the VWAP is considered bullish and a price lesser than the VWAP is considered bearish.